• Application Note

Simultaneous Extraction and Quantitation of Morphine and Its Metabolites in Plasma Using Mixed-Mode SPE and UPLC-MS/MS

Simultaneous Extraction and Quantitation of Morphine and Its Metabolites in Plasma Using Mixed-Mode SPE and UPLC-MS/MS

  • Zhe Yin
  • Kenneth J. Fountain
  • Erin E. Chambers
  • Diane M. Diehl
  • Waters Corporation
Technician holding test tube examining human centrifuged serum

For forensic toxicology use only.

Abstract

In this application note we demonstrate, a UPLC-MS/MS method was developed to separate morphine and five of its metabolites on a 2.1 x 100 mm, 1.8 μm ACQUITY UPLC HSS T3 Column in a single run using an ACQUITY UPLC System connected to a fast-scanning triple quadrupole MS detector (TQD).

Introduction

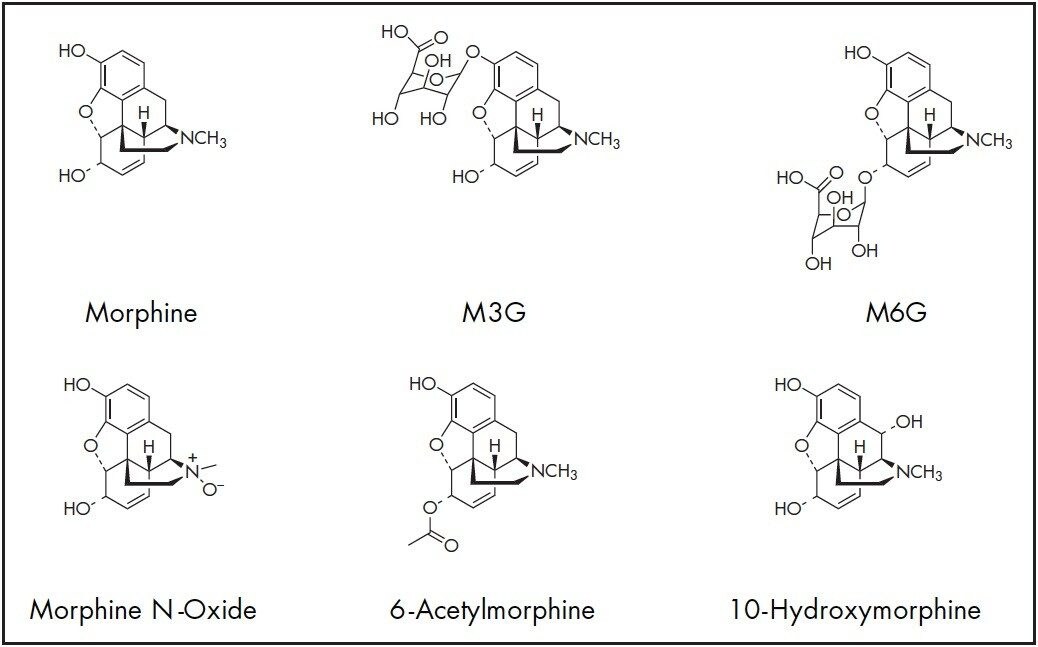
Morphine is an effective pain-relieving drug that is primarily metabolized into morphine-3-glucuronide (M3G) and morphine- 6-glucuronide (M6G). The highly potent M6G may have adverse effects such as respiratory depression and renal failure if accumulated in the body. Other metabolites of morphine include morphine N-oxide, 6-acetylmorphine and 10-hydroxymorphine. As morphine abuse continues to affect modern society, an effective method must be established to analyze morphine and its metabolites in biological fluid samples.1

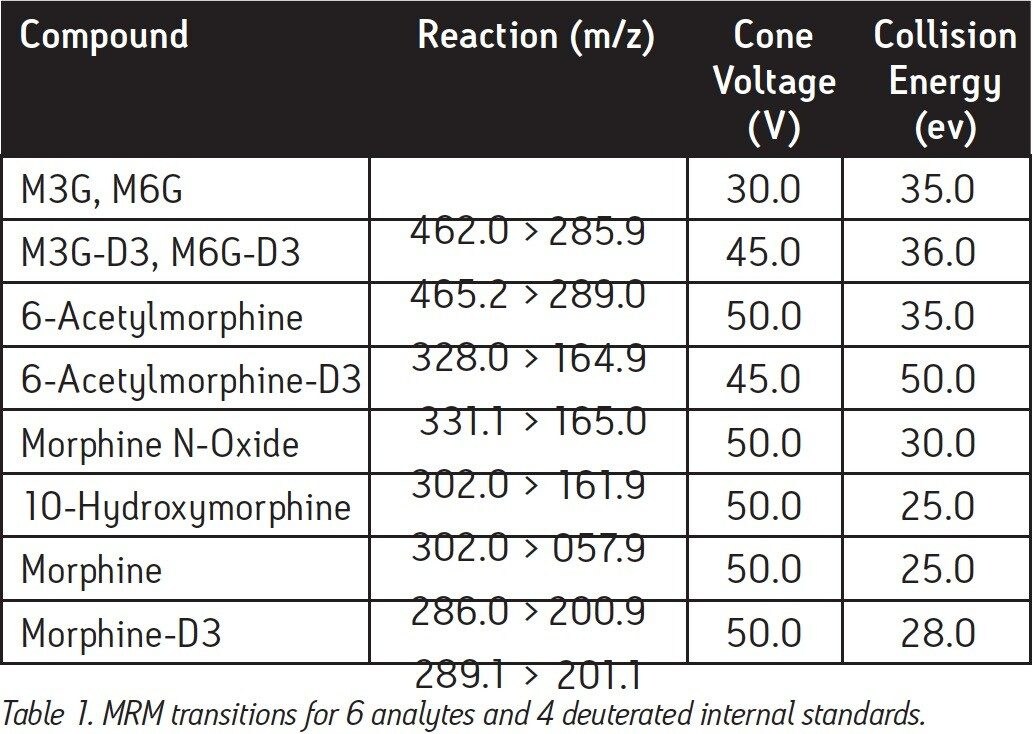
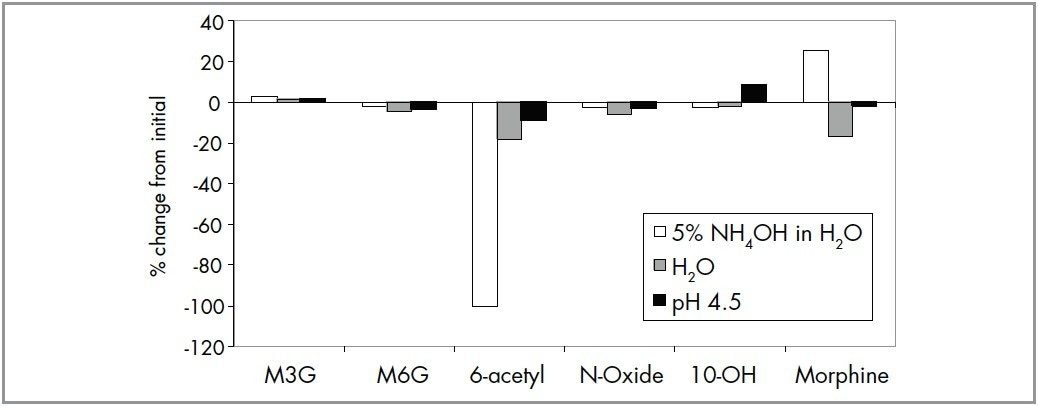
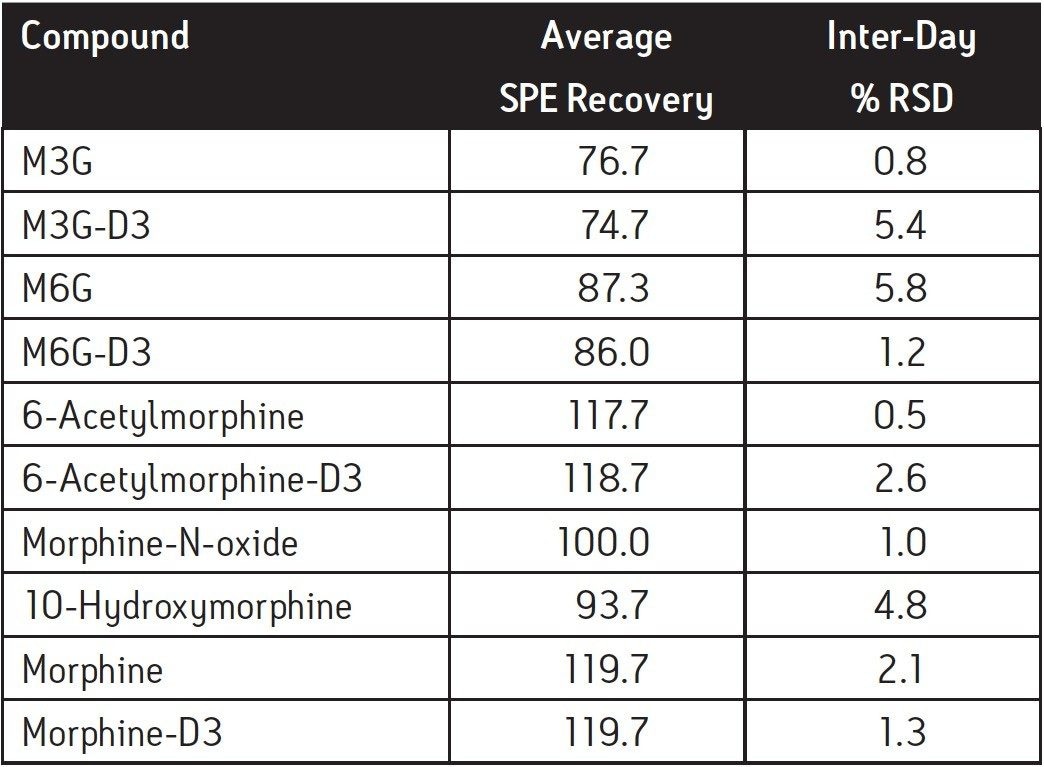
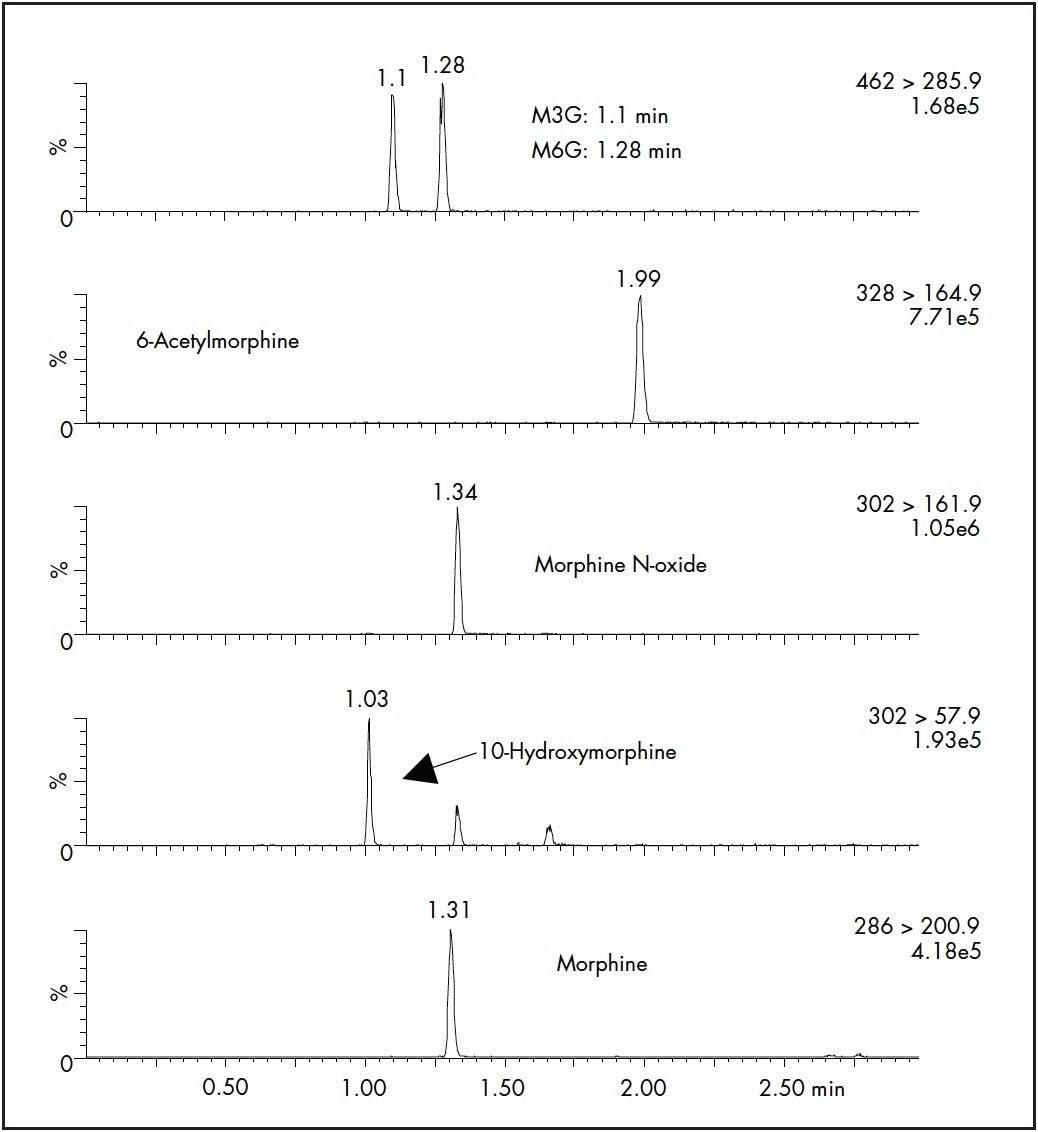
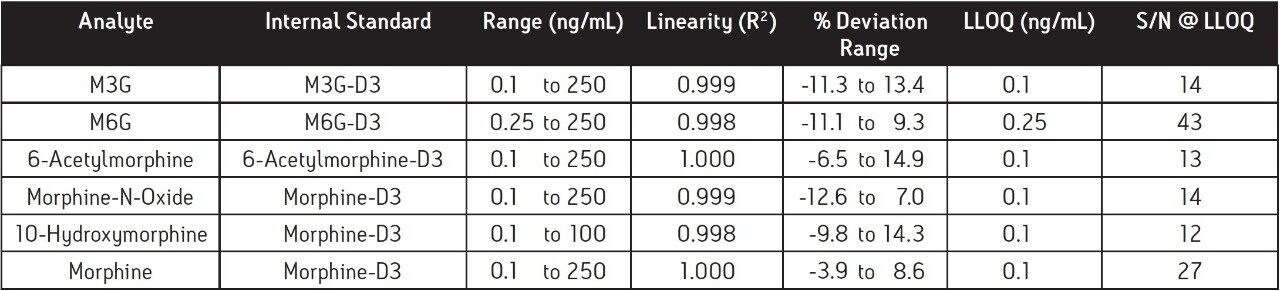
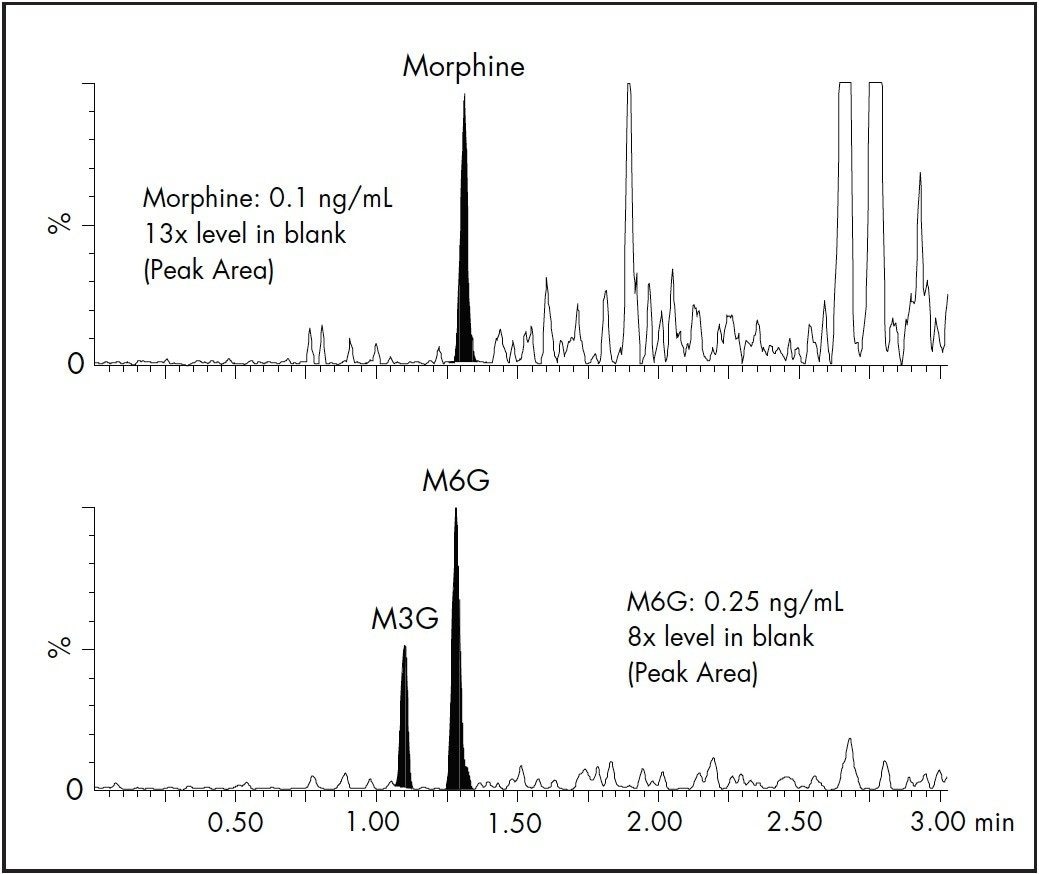
In this work, a UPLC-MS/MS method was developed to separate morphine and five of its metabolites on a 2.1 x 100 mm, 1.8 μm ACQUITY UPLC HSS T3 Column in a single run using an ACQUITY UPLC System connected to a fast-scanning triplequadrupole MS detector (TQD). The method achieved adequate retention of these very polar compounds by reversed-phase (RP) chromatography in an 8-minute total run time. Mixed-mode solid-phase extraction (SPE) uses both reversedphase and ion-exchange mechanisms to separate analytes more selectively from matrix components. Therefore, sample preparation of porcine plasma was performed with the Oasis Mixed-mode Cation eXchange (MCX) μElution Plate. The strong cation-exchange sorbent was chosen because morphine, its five metabolites and, their internal standards are basic compounds (pKa of morphine = 9.85). The structures of the six analytes are shown in Figure 1. The Oasis MCX SPE procedure requires a high-pH elution step that is not suitable for 6-acetylmorphine due to degradation. To avoid compound degradation prior to UPLC-MS/MS analysis, a neutralizing collection step was employed.2 The SPE recovery and reproducibility of the method were determined, as well as the linearity and lower limit of quantitation (LLOQ) for each analyte.

Structures of morphine and five metabolites

Experimental

UPLC Conditions

System:

Waters ACQUITY UPLC System

Column:

ACQUITY UPLC HSS T3 Column 2.1 x 100 mm, 1.8 μm

Part Number:

186003539

Column Temp:

45 °C

Sample Temp:

4 °C

Flow Rate:

0.5 mL/min

Mobile Phase A:

0.1 % HCOOH in H2O

Mobile Phase B:

CH3OH

Injection Volume:

15 μL

Injection Mode:

Partial loop with needle overfill (PLNO; 20 μL loop size)

Weak Needle Wash:

95/5 (H2O/CH3OH)

Strong Needle Wash:

95/5 (CH3CN/H2O)

Gradient:

Time(min)

Profile

Curve

A (%)

B (%)

Initial

98.0

2.0

-

3.0

40.0

60.0

6

3.5

2.0

98.0

6

5.0

2.0

98.0

6

5.1

98.0

2.0

6

8.0

98.0

2.0

6

MS Conditions

MS System:

Waters ACQUITY TQD

Ionization Mode:

Electrospray Positive

Capillary Voltage:

1.0 kV

Cone Gas:

50 L/Hr

Desolvation Gas:

800 L/Hr

Collision Cell Pressure:

4.07e -3 mbar

Desolvation Temp:

350 °C

Source Temp:

120 °C

Dwell Time:

10 ms

MRM Transitions:

See Table 1

Standard Solutions

All of the six standard and four internal standard (IS) solutions were received at a concentration of 100 μg/mL from the manufacturer Working solutions were prepared by diluting and mixing each of the six standard solutions with 50:50 CH3OH:H2O (v:v) to give the appropriate concentrations for calibration. The four individual IS solutions were diluted with 50:50 CH3OH:H2O (v:v) to give an IS working solution of 1 μg/mL for each compound.

Sample Preparation

Calibration curves for each of the six compounds in porcine plasma were generated with individual points at the following concentrations: 0.1, 0.25, 0.5, 1, 5, 10, 25, 50, 100, and 250 ng/mL. The internal standard working solution was spiked to a final concentration of 25 ng/mL each. Porcine plasma was spiked as follows for each concentration:

50 μL standard working solution and 50 μL internal standard working solution were added to 2 mL porcine plasma. The sample was then vortexed and diluted with 1.9 mL 4 % H3PO4 in water. These solutions are the pretreated (diluted and acidified) plasma solutions which are ready for SPE. The plasma blank was prepared by adding 50 μL of 50:50 CH3OH:H2O (v:v) and 50 μL internal standard working solution to 2 mL porcine plasma and 1.9 mL 4 % H3PO4 in water.

Extraction Procedure

Solid-phase extraction was performed with the Oasis MCX μElution 96-well Plate. Because acetylmorphine was found to be unstable at high pH, the eluates were collected into a collection plate containing 3 % HCOOH in CH3OH in order to neutralize the basic elution solvent (final pH ~ 4.5). These samples were then evaporated and reconstituted with water to ensure compatibility with the starting gradient conditions.

The detailed SPE procedure is described below:

Oasis MCX μElution 96-well plate (Part Number: 186001830BA)

  1. Condition the wells with 200 μL CH3OH
  2. Equilibrate with 200 μL water
  3. Load 500 μL diluted plasma sample
  4. Wash with 200 μL 2 % HCOOH in water
  5. Wash with 2 x 100 μL CH3OH
  6. Elute with 2 x 25 μL 5 % NH4OH in 90:10 CH3OH:H2O into a collection plate already containing 50 μL 3% HCOOH in CH3OH
  7. Evaporate at room temperature until completely dry
  8. Reconstitute with 50 μL water

SPE Recovery

Recovery for the analytes and internal standards was determined by comparing the MRM peak areas of pre-extracted spiked samples at 25 ng/mL to those of the post-extracted spiked samples at the same concentration. The pre-extracted samples were spiked with 50 μL of the standard mixture at 1 μg/mL each and extracted in the plate. Blank plasma samples were extracted in the plate and then spiked with 10 μL of the standard mixture at 625 ng/mL each. The pre-extracted and post-extracted spiked samples were evaporated to dryness and reconstituted with 50 μL water. Extraction was performed on three different days (N = 4 each day).

Calibration Curves

Calibration curves were generated using the Waters QuanLynx Application Manager for MassLynx MS Software by plotting the ratio of analyte to internal standard peak area for each concentration. The linear regression was constructed using a weighting of 1/x with the origin excluded. The percentage deviation for each calibration point was obtained from QuanLynx by comparing the concentration value calculated from the linear regression to the expected value.

Results and Discussion

To investigate analyte stability, a standard mixture containing 20 ng/mL of each analyte was prepared in H2O, 5% NH4OH in H2O, 5% NH4OH:3% formic acid (1:1, v:v) and stored at 4 °C (set temperature of the autosampler) for 24 hours. Stability of the analytes was evaluated by comparing the area counts after 24 hours to the area counts obtained immediately after the solutions were prepared. In general, the compounds are stable in H2O. At high pH, however, 6-acetylmorphine degrades completely after 24 hrs, and area counts for morphine increase by 25% (Figure 2). It is expected that some of the 6-acetylmorphine hydrolyzes to morphine at high pH. All the six compounds were stable (<10 % change) in the neutralizing solution.

Twenty-four hour stability of morphine-related compounds incubated
Figure 2. Twenty-four hour stability of morphine-related compounds incubated at 4 °C in various solutions (N = 3).

SPE recoveries for most of the compounds at 25 ng/mL were >90% except for the glucuronide metabolites, that had slightly lower recovery (Table 2). Inter-day SPE reproducibility was better than 6%. A representative chromatogram of a pre-extracted spiked sample is shown in Figure 3.

SPE recoveries and inter-day % RSD
Table 2. SPE recoveries and inter-day % RSD.
UPLC-MS/MS chromatogram of a pre-extracted spiked sample at 25 ng/mL of each analyte in porcine plasma
Figure 3. UPLC-MS/MS chromatogram of a pre-extracted spiked sample at 25 ng/mL of each analyte in porcine plasma. Retention times for each analyte are shown at each peak apex.

The results for linearity and LLOQ are shown in Table 3. All calibration curves had an R2 ≥0.998, and % deviation for each point was < ± 15 % of the expected values. The LLOQ values (5x level in blank 4) for all analytes were determined to be 0.1 or 0.25 ng/mL. The signal-to-noise (S/N) ratio of each analyte at the LLOQ was also determined. Two representative chromatograms showing the LLOQ for morphine and M6G are shown in Figure 4.

Linearity, % deviation and LLOQ results for morphine and five metabolites
Table 3. Linearity, % deviation and LLOQ results for morphine and five metabolites.
Representative XIC chromatograms at the LLOQ of morphine and M6G in porcine plasma
Figure 4. Representative XIC chromatograms at the LLOQ of morphine and M6G in porcine plasma.

Conclusion

A method for the simultaneous extraction and quantitation of morphine and five of its metabolites in porcine plasma was developed. All six compounds were analyzed in a single UPLC-MS/MS run in 8 minutes. A neutralizing collection step was used in the SPE protocol to prevent analyte degradation. The SPE procedure using an Oasis MCX μElution Plate was able to achieve consistent recoveries ranging from 77% to 120%, depending on the analyte. The method was linear over at least 3 orders of magnitude with R2 ≥0.998, and achieved LLOQ values in the range of 0.1 to 0.25 ng/mL. This method achieves the desired detection limits in less time than previously published methods, and addresses the issue of analyte instability for the selective extraction of polar compounds.

References

  1. M. Espinosa Bosch, A. Ruiz Sanchez, F. Sanchez Rojas, C. Bosch Ojeda, J. Pharm. Biomed. Anal. 43 (2007) 799-815.
  2. E. J. Rook, M. J.X. Hillebrand, H. Rosing, J. M. van Ree, J. H. Beijinen, J. Chromatogr. B. 824 (2005) 213-221.
  3. E. Chambers, D. M. Wagrowski-Diehl, Z. Lu, J. R. Mazzeo, J. Chromatogr. B. 852 (2007) 22-34.
  4. US FDA (CDER/CVM). Guidance for Industry. Bioanalytical Method Validation Federal Reg. 66:28526 (2001).

Featured Products

720002896, January 2009

Back To Top Back To Top