Complex mixture analysis is a term that is applicable to a wide-range of MS application areas. A prerequisite is efficient chromatographic separation, whether performed by GC or ACQUITY UPLC. Typically data is acquired in full scan mode on a quadrupole or time-of-flight (ToF) mass spectrometer, such as the Waters GCT Premier or LCT Premier XE. ToF offers significant benefits such as improved full scan sensitivity, reduced cycle time, and high resolution.
The primary challenges for an analyst when reviewing acquired data are:
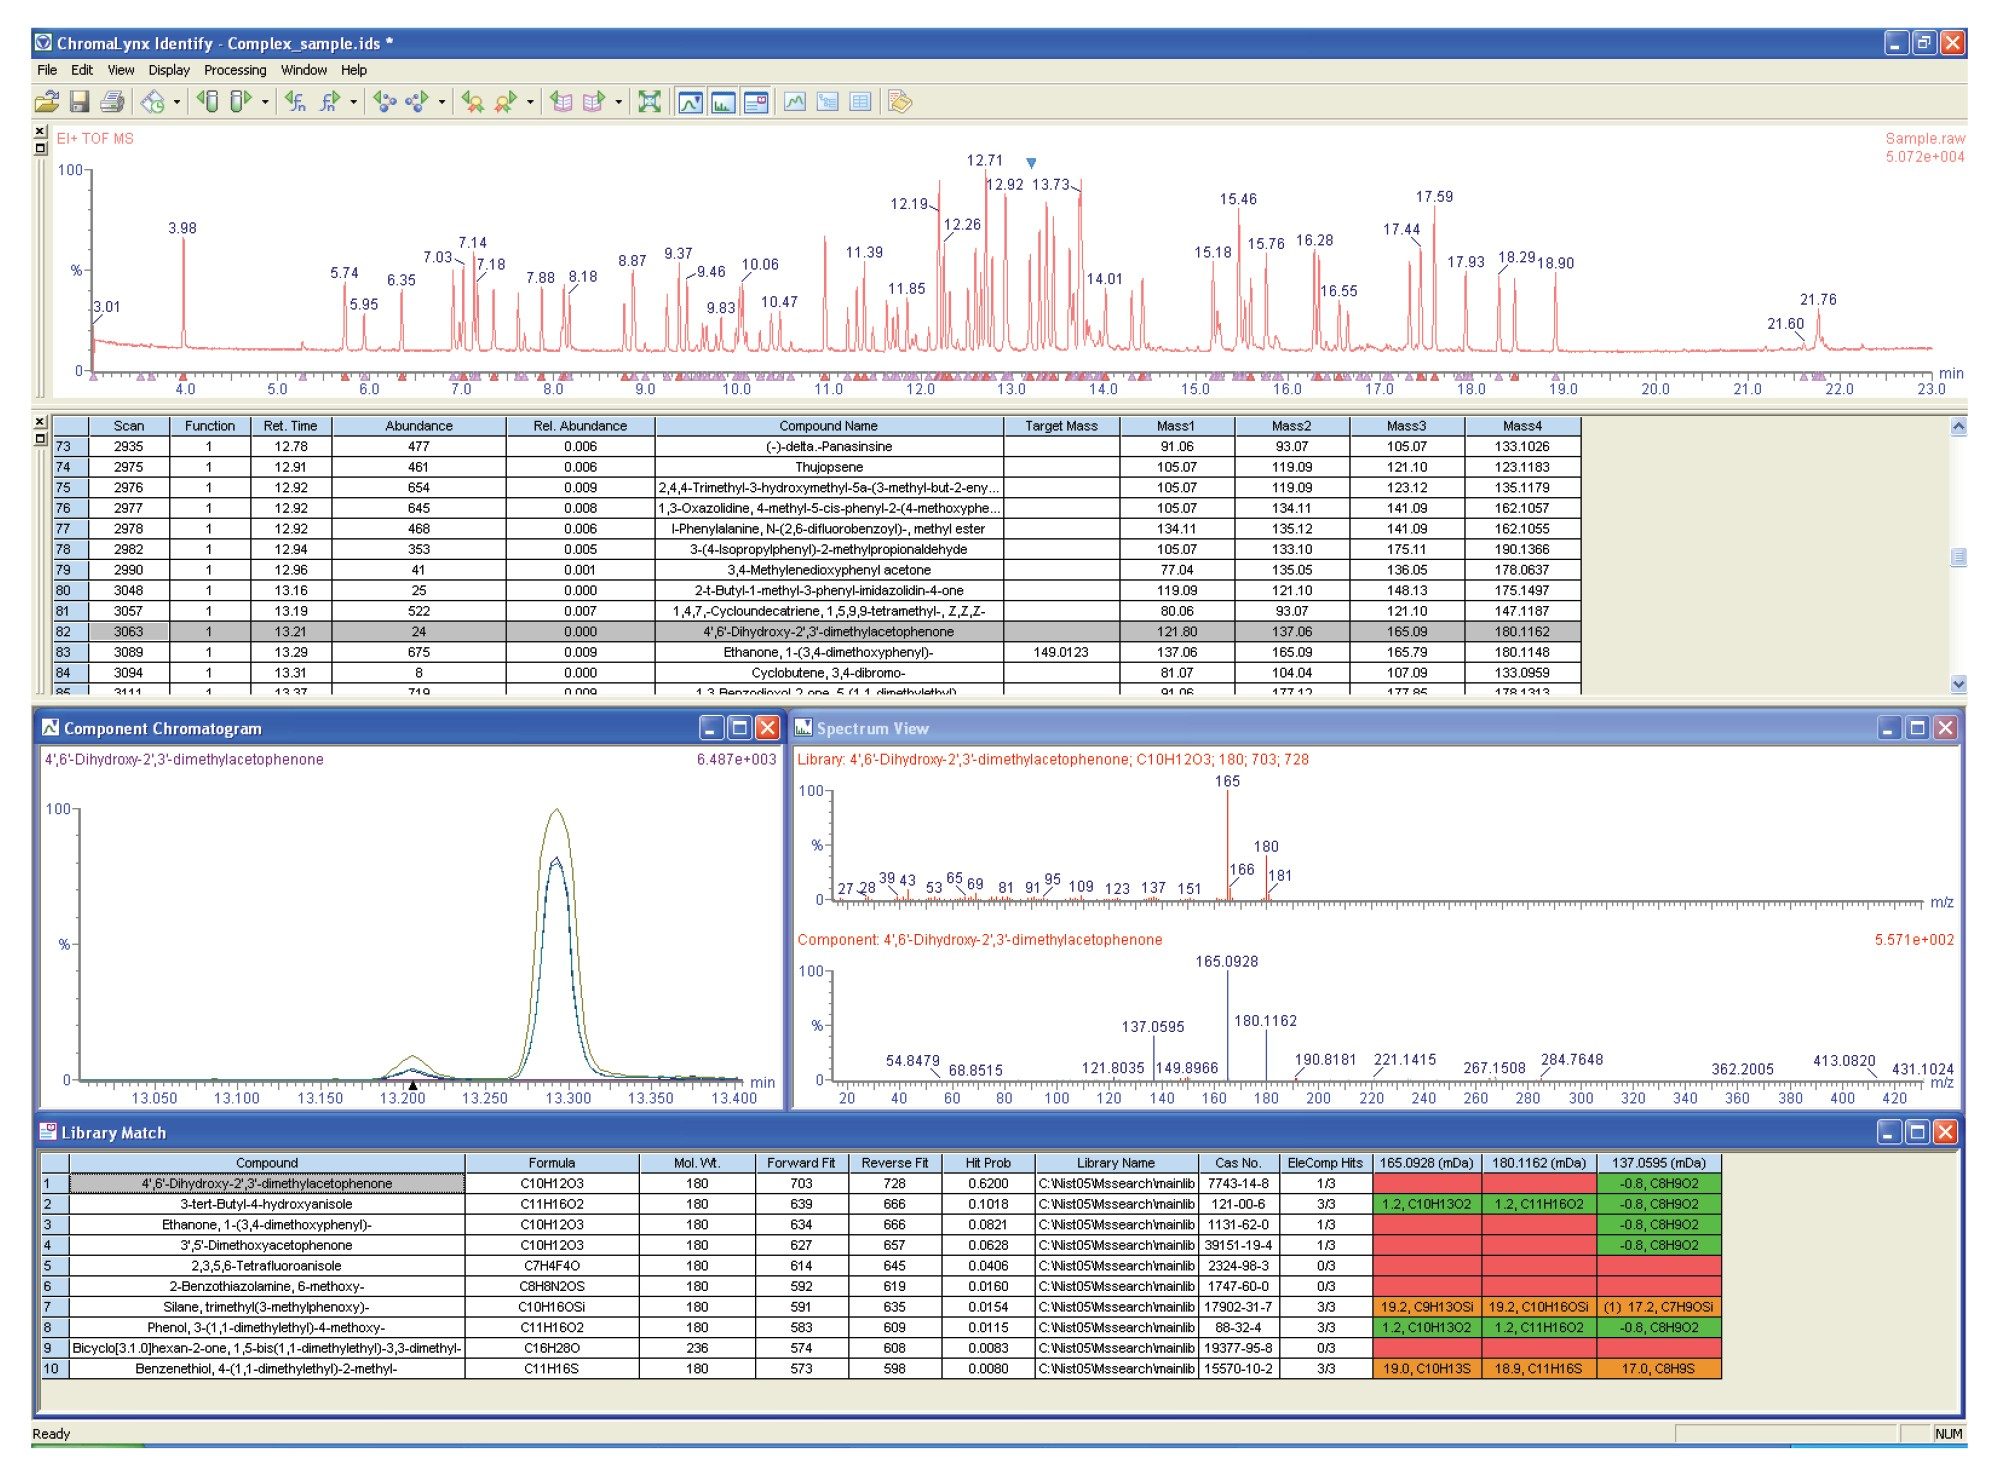
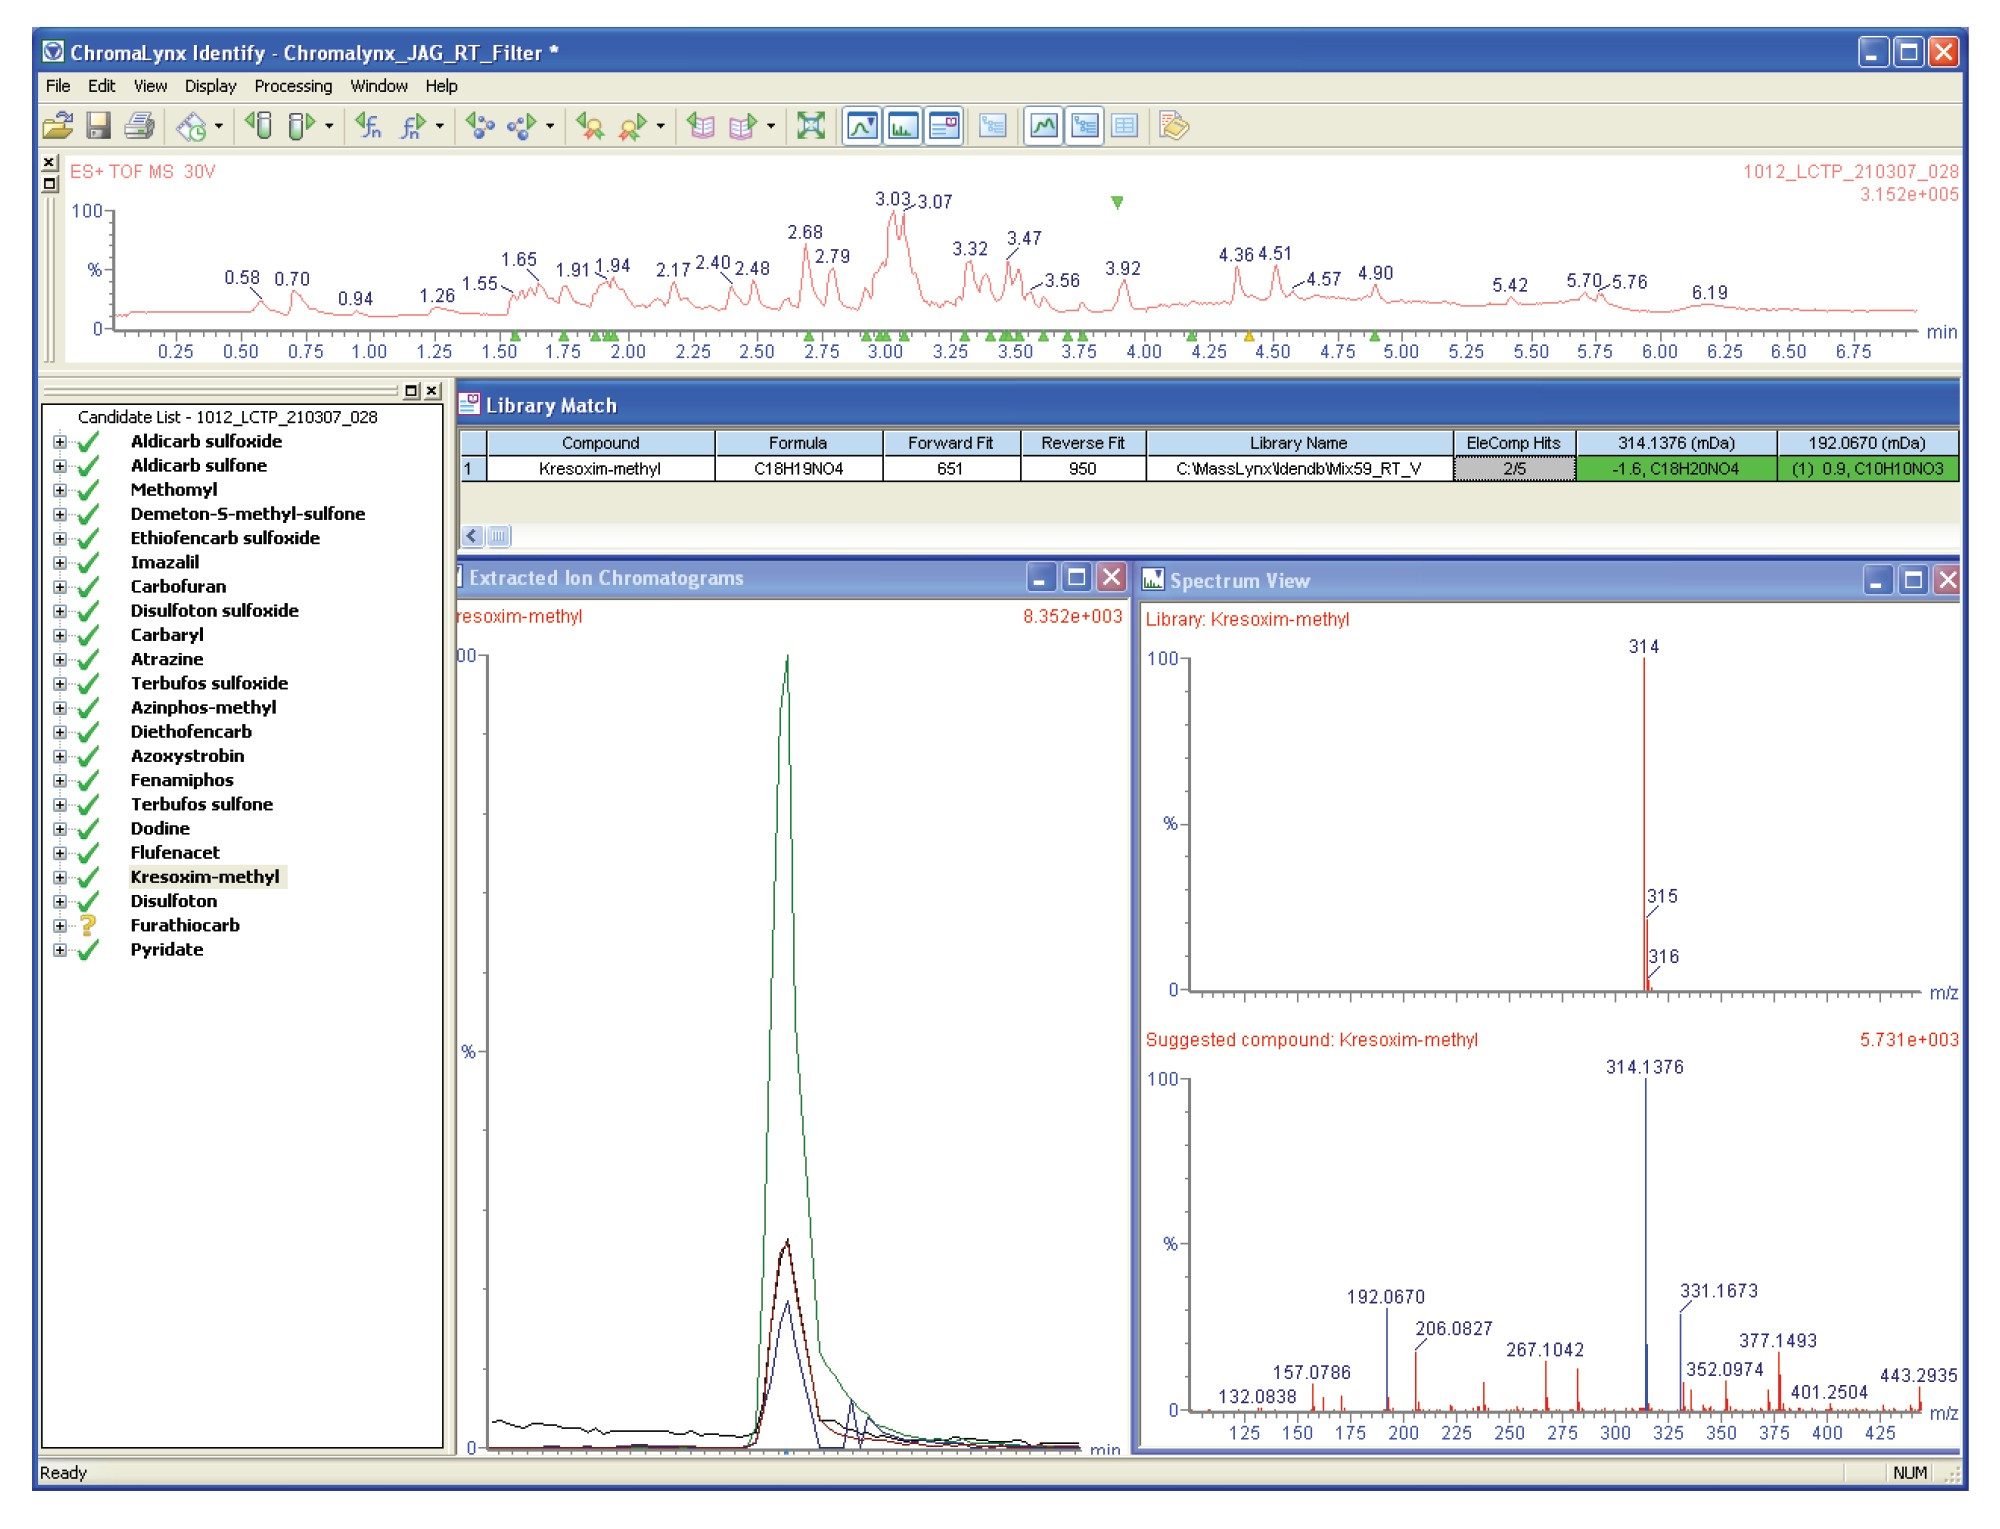
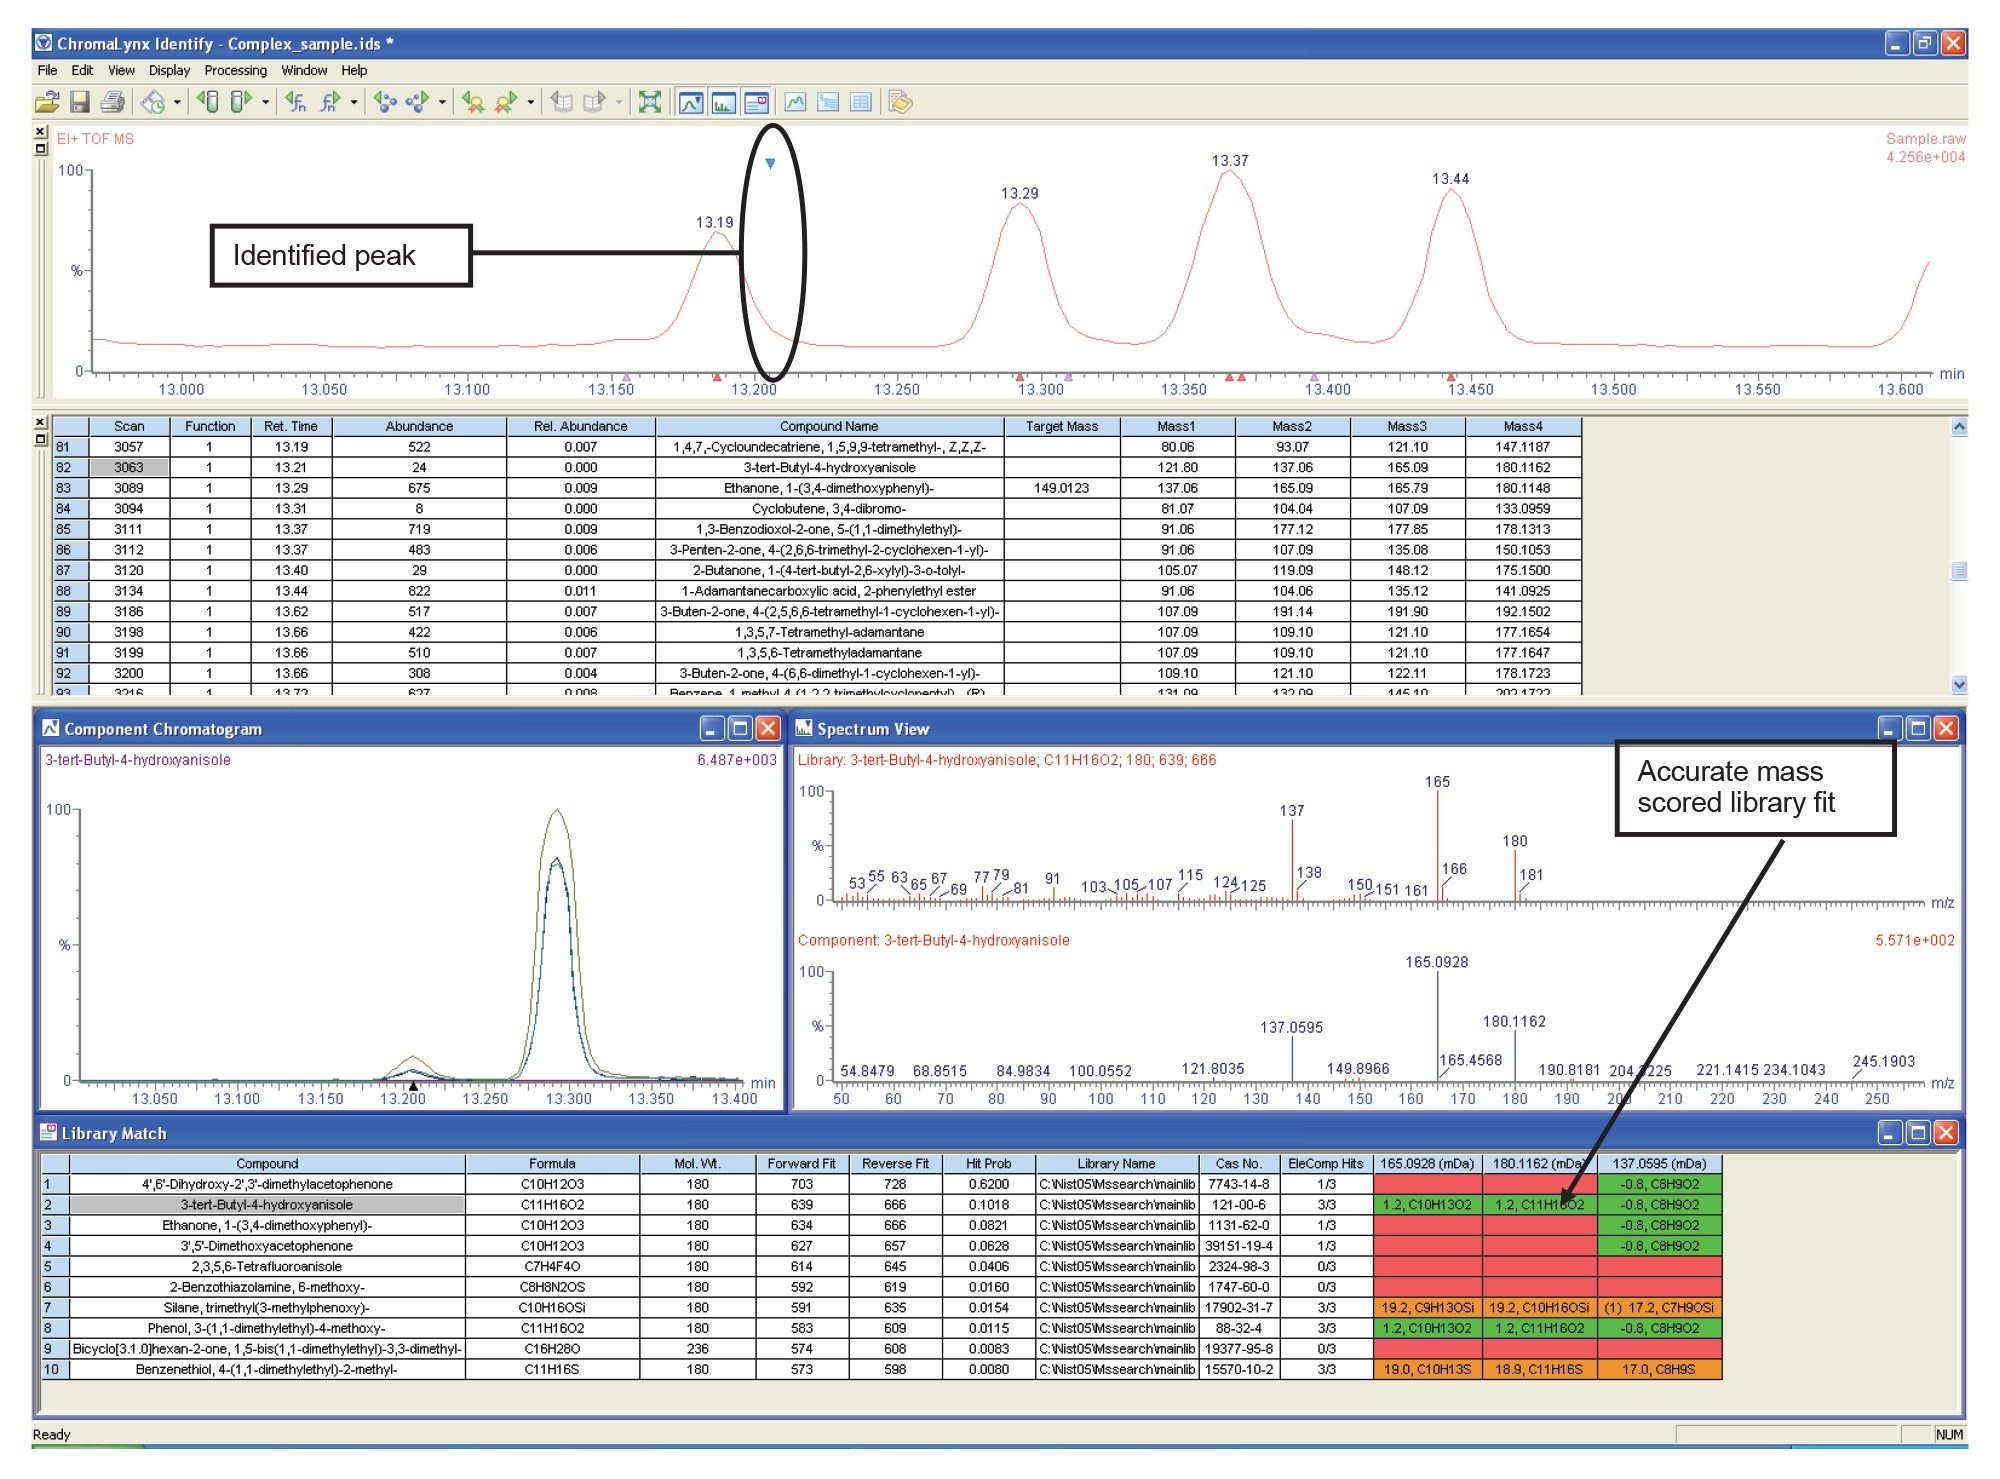
- Identifying eluting peaks, primarily using library searching
- Deconvoluting compounds where chromatographic separation is not complete
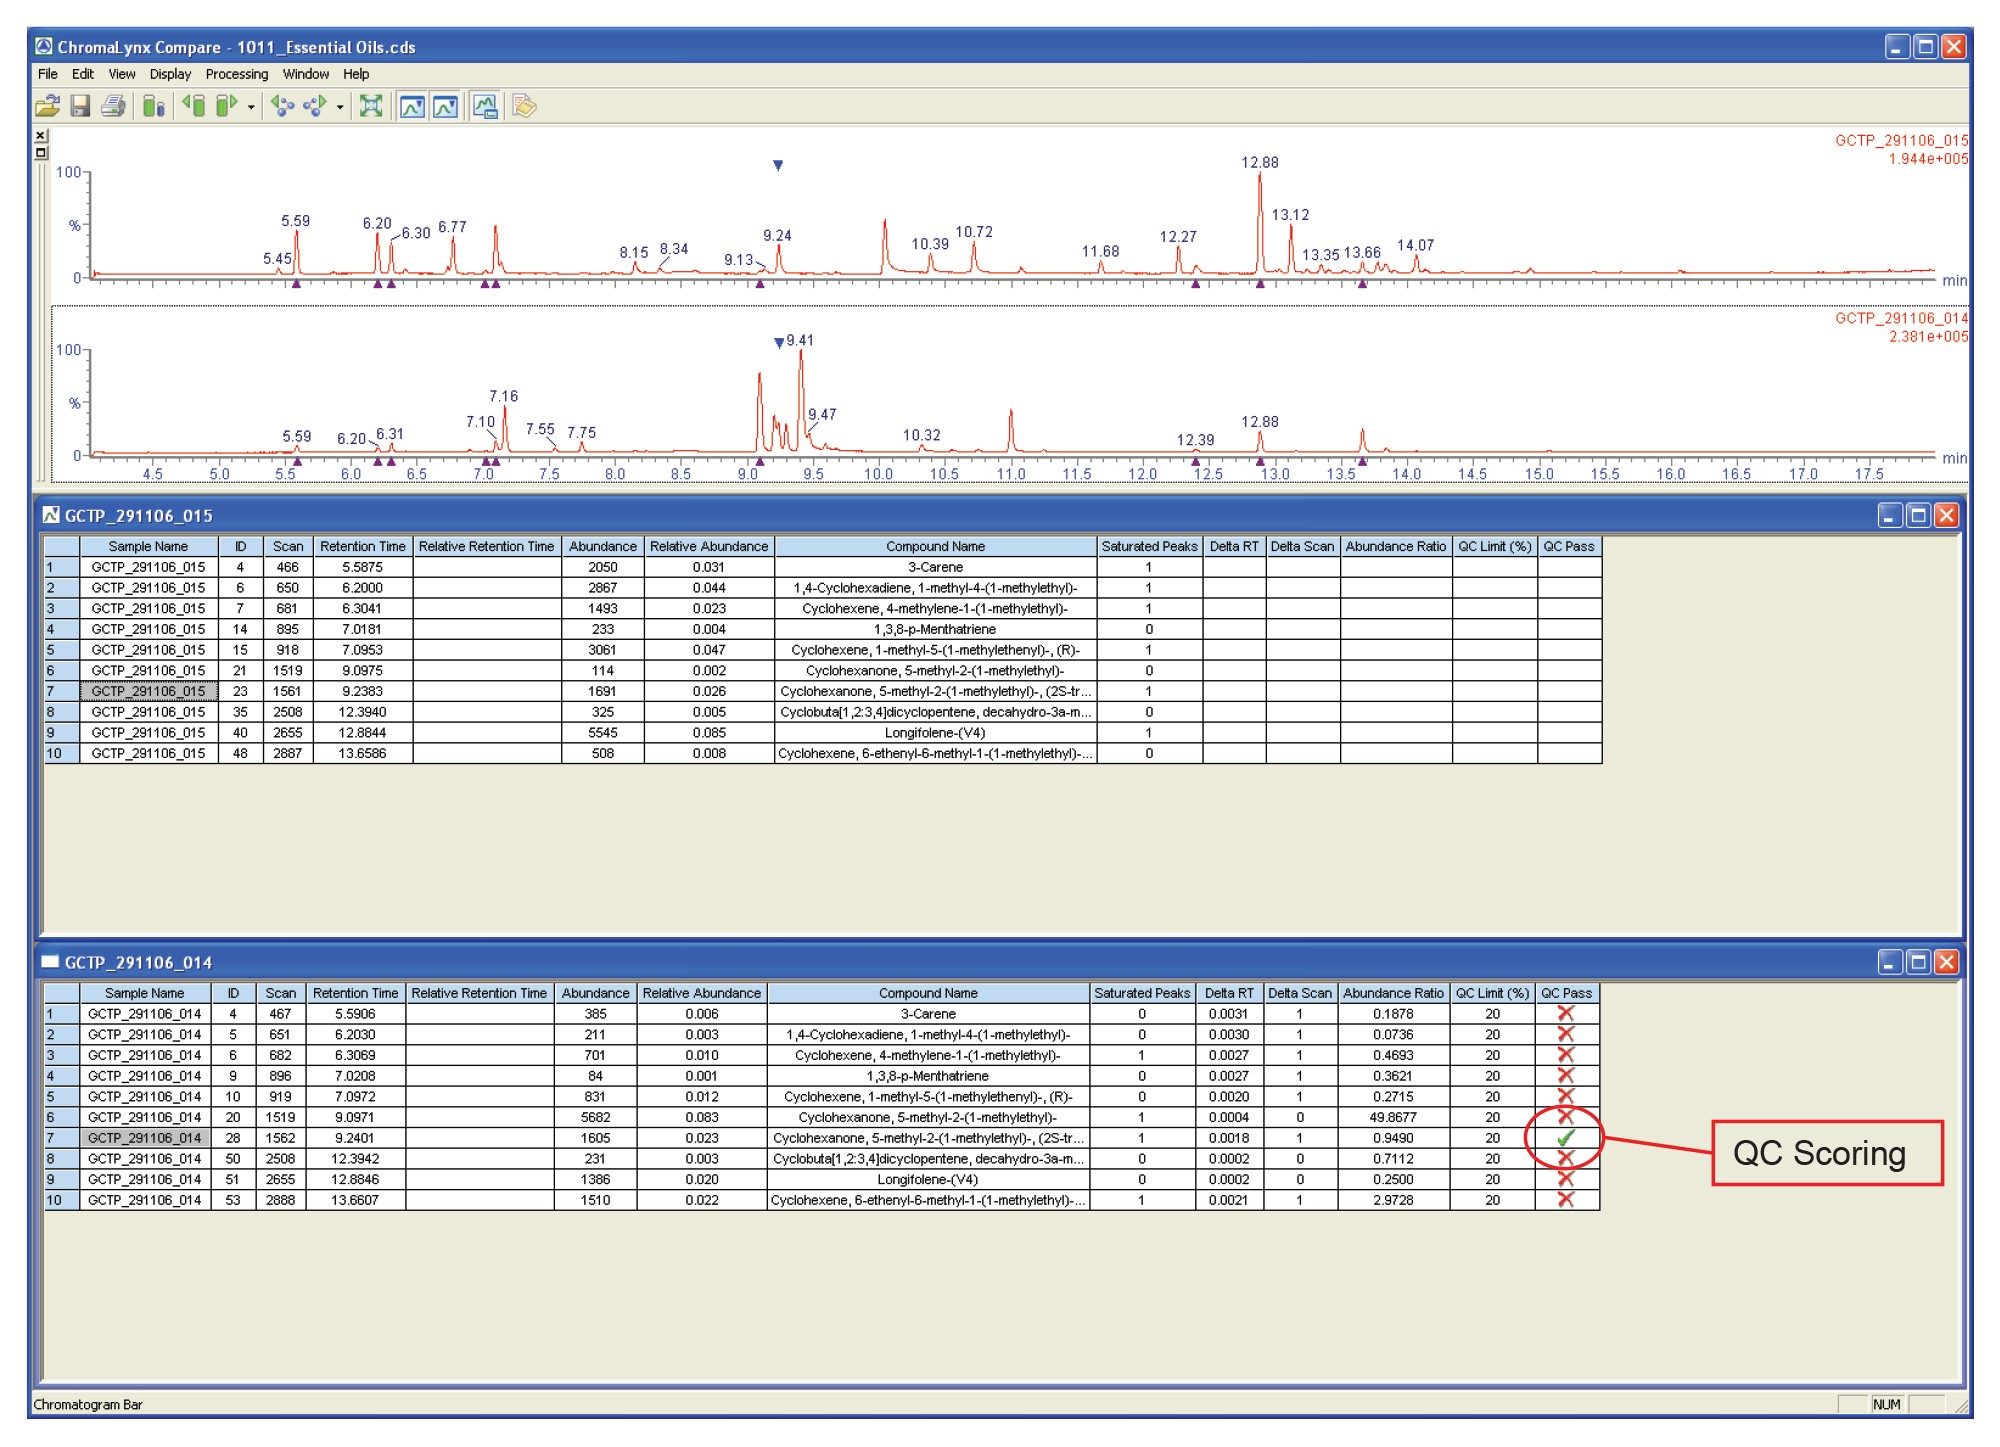
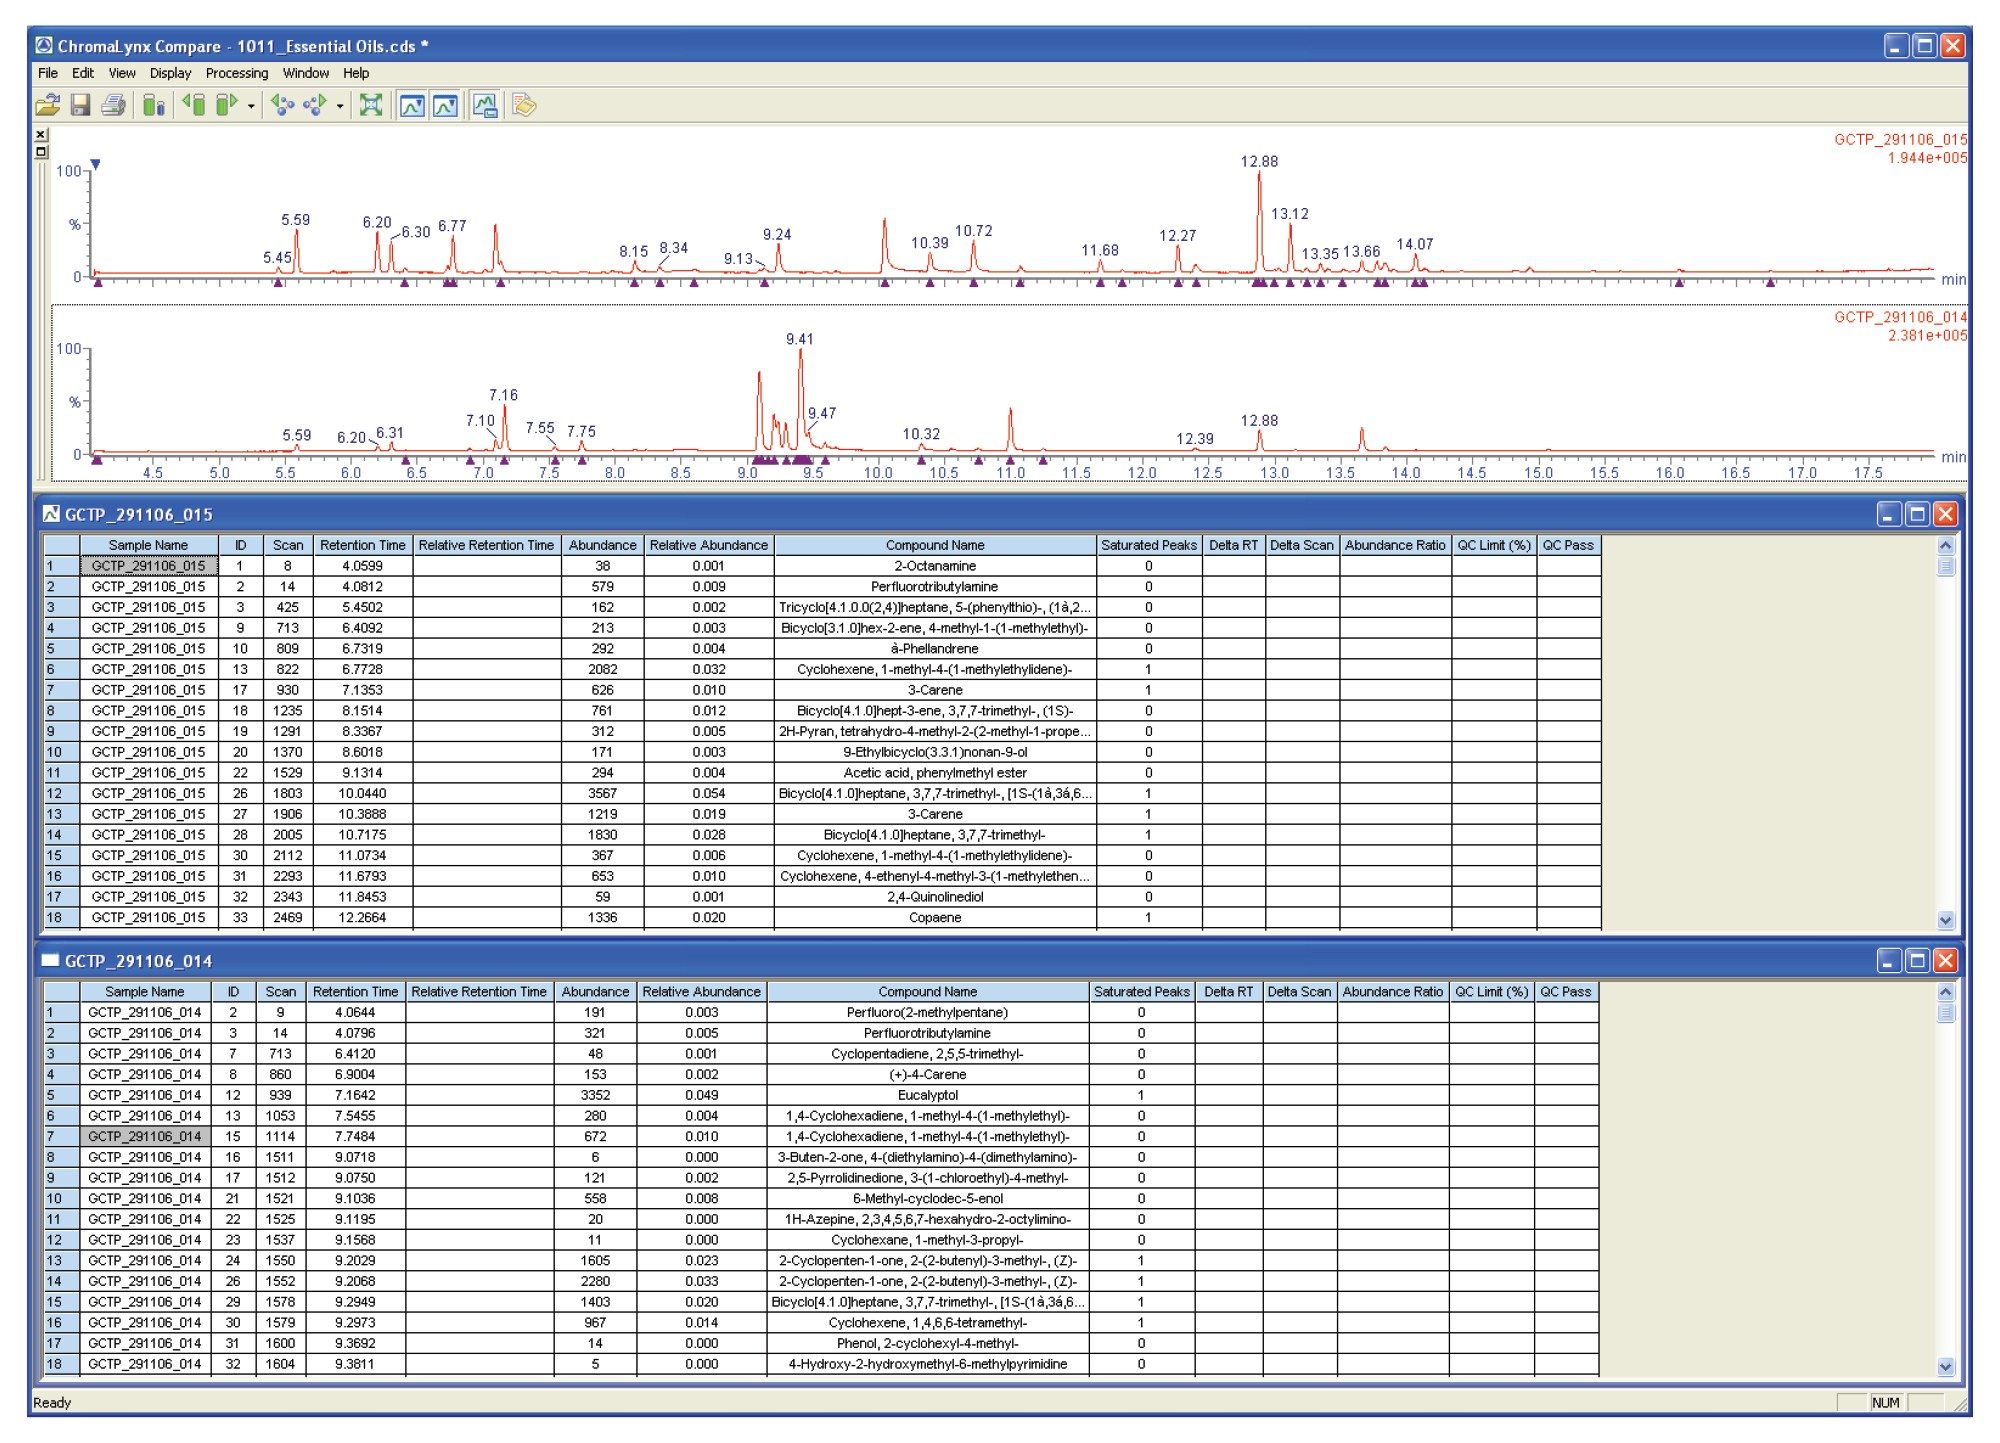
- Comparing chromatograms to identify similarities or differences between acquired mixture samples
Each of these processes is time-consuming when performed manually, often resulting in a large number of printed chromatograms, mass spectra, library search results, and compound lists. A single data file could take hours to process, having only taken a few minutes to acquire, with a high probability for error during the manual process.
This technical note shows examples of the use of ChromaLynx XS Software for complex mixture analyses including:
- Routine automated identification of peaks in complex chromatograms using deconvolution
- Comparison of acquired data files such as comparing a known sample with a ‘complaint’ or tainted sample to identify unique or common components
ChromaLynx XS offers a number of automated features to reduce the amount of time taken for these processes, and minimizes the possibility for errors compared with manual processing. Primary features include:
- Automated high resolution deconvolution generating library searchable, background subtracted mass spectra
- Automated exact mass scoring of library results
- All results data stored in one interactive browser file
- Chromatogram comparison highlights unique or common components between different acquired files