Expanding the Antibody-Oligo Conjugate (AOC) Characterization Toolbox: Part 3- Partial and Complete AOC Conjugation Site Determination
Samantha Ippoliti, Ying Qing Yu
Waters Corporation, United States
Note: This is the third application note in a three-part series on AOC characterization. The first application note (720009048EN) detailed the intact AOC species characterization and served as an orthogonal analysis to already published SEC-MALS results (Wyatt White Paper WP8010). The second application note (720009066EN) details the characterization of the siRNA components used to create the AOC.
Published on October 24, 2025
Abstract
Antibody-oligonucleotide conjugates (AOCs) are an emerging innovation in biotherapeutics, utilizing the targeting potential of monoclonal antibodies (mAbs) to deliver an oligonucleotide therapeutic payload to a cell. Characterization of these AOCs presents unique challenges due to the differences in protein vs. oligonucleotide structures and the LC-MS methodologies to analyze each of them. This is particularly apparent when trying to ascertain the sites of oligonucleotide conjugation on the antibody, which typically involves enzymatic digestion of the protein into smaller pieces for analysis. The nature of some resulting AOC-derived species is more oligonucleotide-like and less protein-like, which impedes the ordinary routes of protein modification site analysis. This application note outlines some potential avenues to assess conjugation sites: partial localization by antibody subunit digestion (native MS) and full digestion for peptide level analysis with fragmentation of the peptide to confirm the modification site.
Benefits
- Partial localization of oligonucleoside conjugation site by subunit mAb analysis via two orthogonal chromatographic methods
- Streamlined generic approach for sample pre-treatment prior to peptide mapping, which enables gold standard RPLC-MS techniques that are not possible with a fully intact oligonucleotide attached to the peptide. This workflow is the first reported method that enables successful confirmation of AOC conjugation sites
Introduction
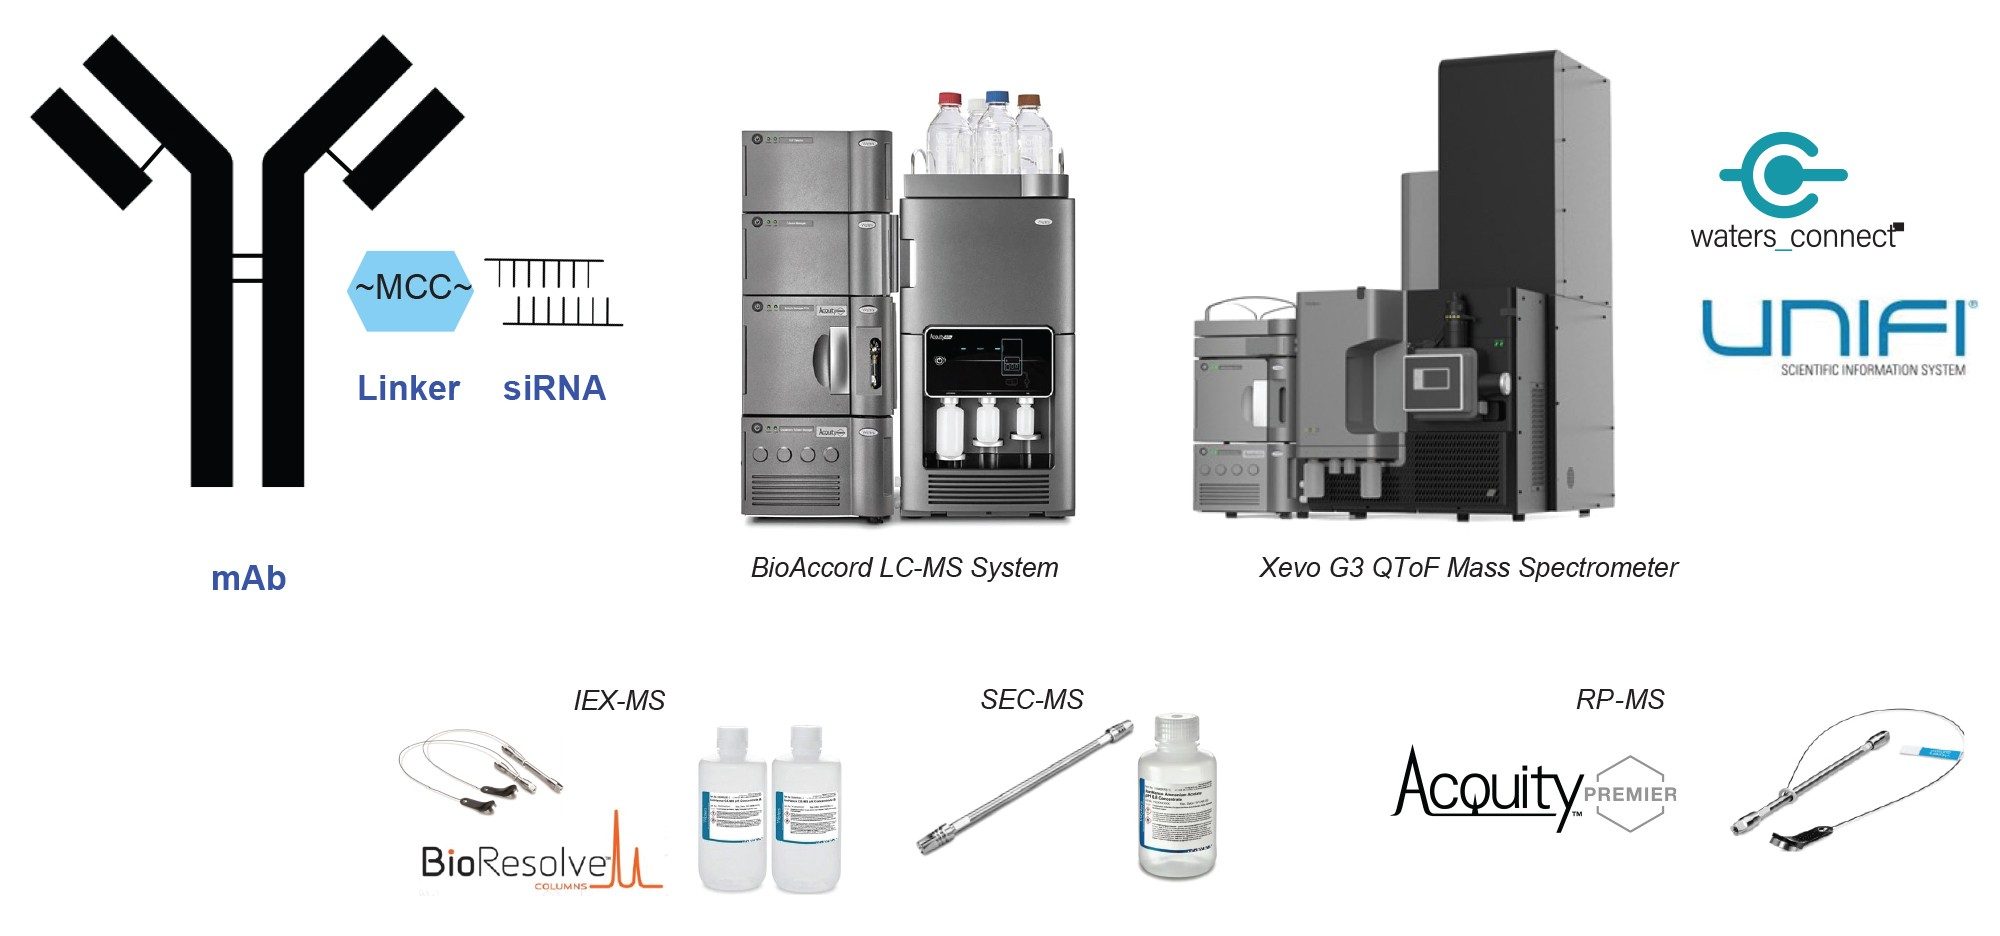
AOCs are a new class of promising biotherapeutics that combine the targeting delivery capabilities of mAbs with the therapeutic potentials of oligonucleotides. This technology will likely open new doors for immunotherapy and cancer treatments.1,2 Typically, an AOC is comprised of the mAb, a linker (cleavable or non-cleavable), and the therapeutic oligonucleotide moiety (such as siRNA).2 The AOCs used for this study consisted of IgG1 isotype control mAb conjugated via to double stranded siRNA (siCOL1a1) via maleimidomethyl cyclohexane-1-carboxylate (MCC) linker.
These conjugates present unique challenges to typical methods of protein and oligonucleotide analysis. Given the stark differences in chemistry, overall charge, and buffer compatibilities of antibodies (mAb) and oligonucleotides, the analysis of the conjugated product is unique. At an intact level, the positively charged mAb structure typically outweighs the effect of the negatively charged oligonucleotide, and the positive mode ESI mass spectrometry acquisition used in protein-based LC-MS methods is usually still successful in achieving intact mass data. At subunit level, it is still possible to achieve mass information using these protein-based LC-MS methods, depending on the size and number of oligonucleotides that are conjugated to the mAb subunits. However, as one endeavors to determine the actual site of conjugation, the oligonucleotide moiety has a much more significant effect on the ability to ionize the species in ESI positive mode. Theoretically, one may achieve a precursor mass for the oligonucleotide-peptide conjugate through negative mode acquisition, but peptide fragmentation, used to determine conjugation site, requires positive ionization. Therefore, the usual method of discerning peptide modification site would not be applicable. Here, an alternate approach with pre-treatment of the AOC sample is presented to enable typical peptide mapping workflows for site localization.
Experimental
Sample Preparation (SEC-MS & SCX-MS, Non-reduced Subunit Analysis):
The equivalent volume for 50 µg of each sample was diluted to 1 mg/mL in 50 mM Ammonium Acetate, pH 6.8 and added to a 1 µL aliquot of 50 units/µL FabRICATOR™ enzyme (Genovis) (1:1 enzyme: mAb (w/w)) and incubated at 37 °C for 4 hours. All samples were analyzed via SCX-MS and SEC-MS using the BioAccord LC-MS System.
Sample Preparation (RPLC-MS, Peptide Mapping):
The AOC samples were each digested in the presence of Nucleoside Digestion Mix (New England BioLabs, p/n: M0649S) according to manufacturer guidance (ratio of about 1 µL of digestion mix to about 1 µg of oligonucleotide in the sample). All samples (free mAb and nucleoside-digested AOCs) were subjected to a peptide mapping experiment. Each sample was denatured and reduced in the following conditions: 4M guanidine hydrochloride (GuHCl), 50 mM Tris HCl, 10 mM dithiothreitol (DTT), pH 7.5. The samples were incubated for 30 min at 37 °C. All samples were then alkylated with iodoacetamide (IAM) at a final concentration of 20 mM and incubated for 30 min at ambient temperature. The alkylation was quenched with a second addition of DTT. The samples were then diluted five-fold with 50 mM Tris HCl, pH 7.5 to reduce the concentration of GuHCl. The samples were digested with RapiZyme™ Trypsin (p/n: 186010108) at a 1:5 ratio for 2 hours, then quenched with formic acid before LC-MS analysis using an ACQUITY™ Premier System coupled to a Xevo G3 QToF Mass Spectrometer.
Samples were generously provided by Takeda Pharmaceuticals. Both AOC samples consist of an IgG1 isotype control mAb conjugated to siCOL1a1 siRNA molecules via an MCC linker. Sample 1 has an overall oligonucleotide to antibody ratio (OAR) of 1, and Sample 2 has an overall OAR of 2.
Method Conditions, Subunit Analysis
LC Conditions
|
LC system (all): |
ACQUITY Premier System |
|
Detection (all): |
ACQUITY TUV Detector (280 nm) |
|
Sample temperature (all): |
6 °C |
|
Column(s): |
SEC-MS: ACQUITY UPLC™ Protein BEH™ SEC Column, 200 Å, 1.7 µm, 4.6 x 150 mm (p/n: 186005225) SCX-MS: BioResolve™ SCX mAb Column, 3 µm, 2.1 x 100 mm (p/n: 186009056) |
|
Column temperature: |
SEC-MS & SCX-MS: 30 °C |
|
Injection volume: |
SEC-MS & SCX-MS (subunit): 5 µL of FabRICATOR enzyme-digested AOC & free mAb @ 1 mg/mL (5 µg) |
|
Flow rate: |
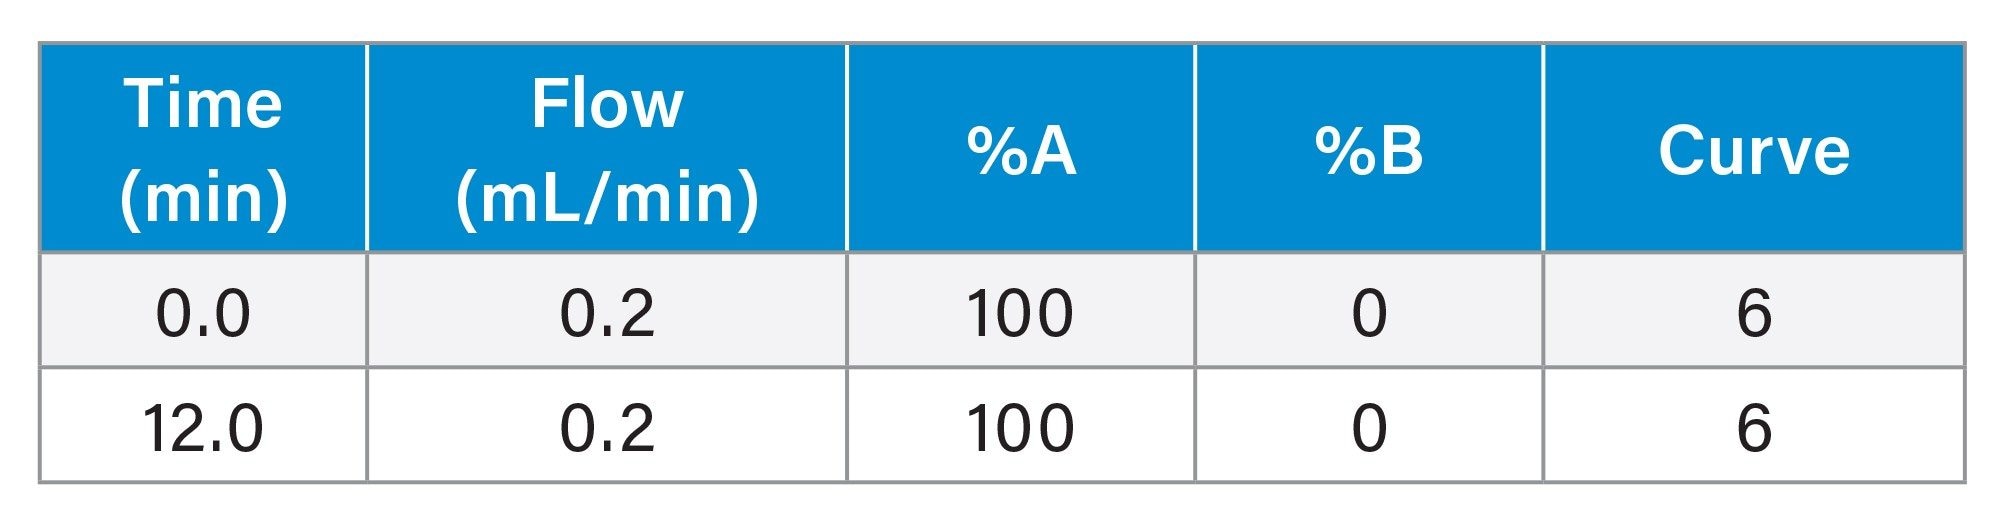
SEC-MS : 0.2 mL/min |
|
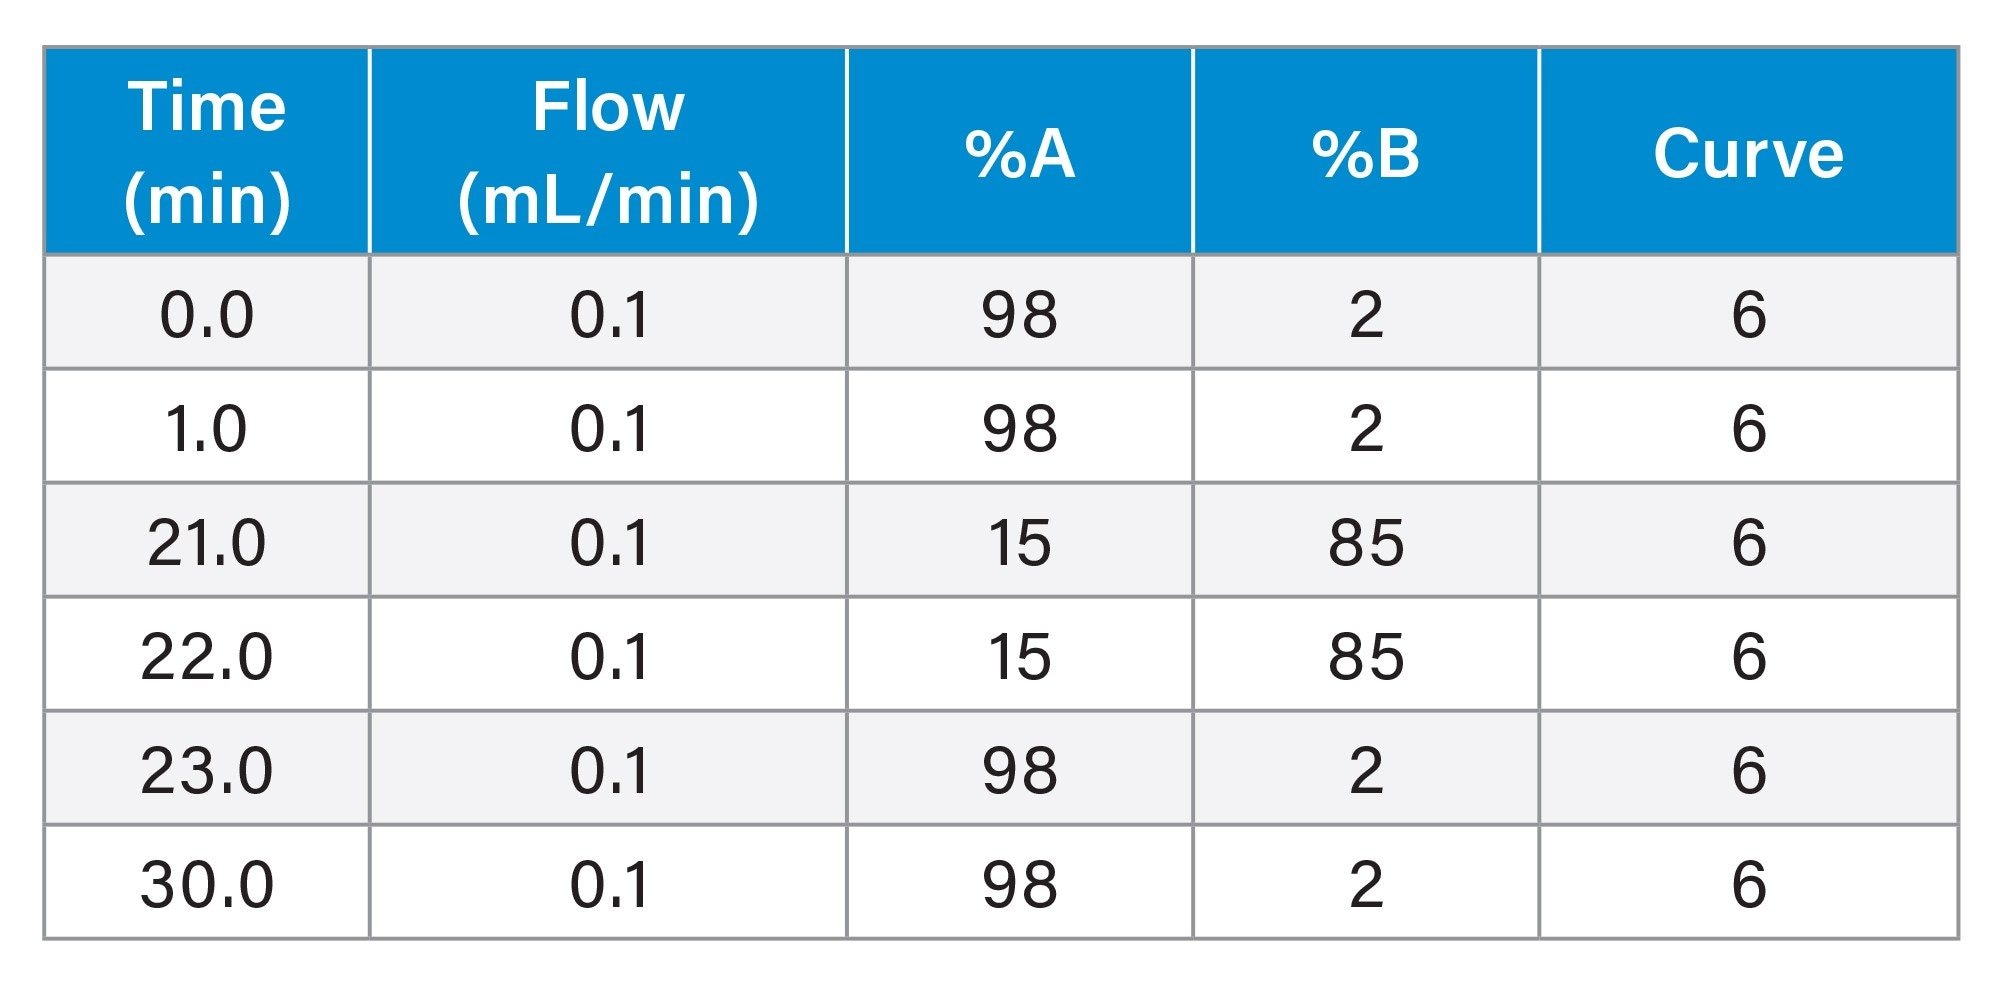
SCX-MS : 0.1 mL/min |
|
|
Mobile phases: SEC-MS |
MPA (isocratic): 50 mM Ammonium Acetate, pH 6.8 (created from IonHance™ Ammonium Acetate Concentrate, p/n: 186009705) |
|
Mobile phases: SCX-MS |
MPA: IonHance CX-MS Concentrate A (p/n: 186009280), prepared as directed (10 mM Ammonium Acetate, pH 5.0) MPB: IonHance CX-MS Concentrate B (p/n: 186009281), prepared as directed (160 mM Ammonium Acetate, pH 8.5) |
Gradient Table: SEC-MS
Gradient Table: SCX-MS (Subunit mAb)
MS Conditions: RDa Detector (SEC-MS & SCX-MS)
|
MS system: |
ACQUITY RDa™ Detector |
|
Ionization mode: |
ESI Positive, Full Scan |
|
Acquisition range: |
400–9000 m/z (Extended Mass) |
|
Scan rate: |
2 Hz |
|
Capillary voltage: |
1.5 kV |
|
Cone voltage: |
SEC-MS & SCX-MS: 150 V |
|
Desolvation temperature: |
SEC-MS 450 °C SCX-MS: 350 °C |
|
Intelligent data capture: |
On |
|
Lockmass: |
Standard |
Method Conditions, Peptide Mapping (RPLC-MS)
LC Conditions
|
LC system (all): |
ACQUITY Premier System |
|
Detection (all): |
ACQUITY TUV Detector (214 nm) |
|
Sample temperature (all): |
6 °C |
|
Column: |
ACQUITY Premier Peptide CSH™ C18 Column, 1.7 µm, 2.1 x 100 mm (p/n: 186009488) |
|
Column temperature: |
60 °C |
|
Injection volume: |
10 µL of each peptide mapping digest sample (~0.1 mg/mL) |
|
Flow rate: |
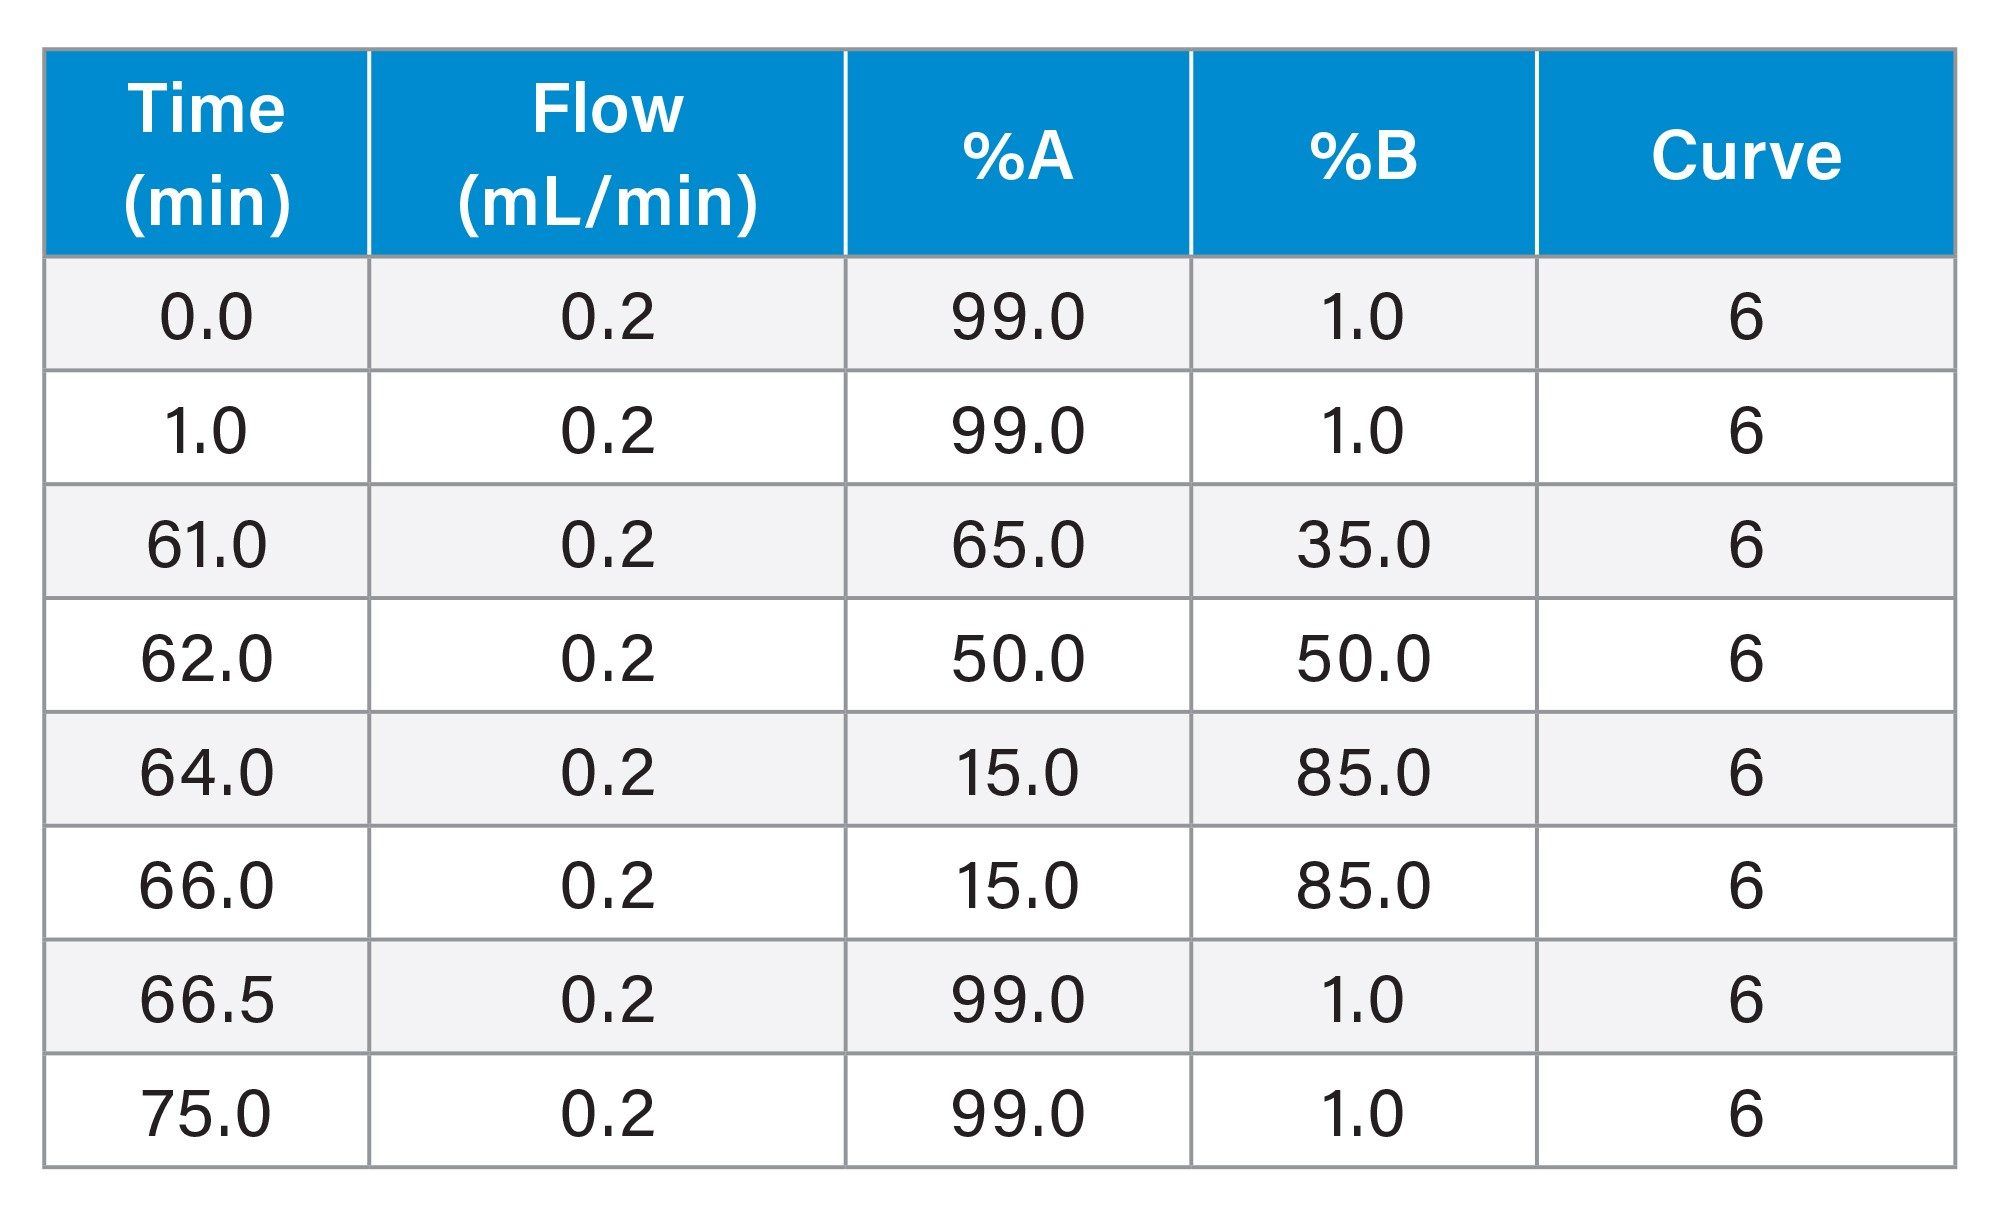
0.2 mL/min |
|
Mobile phases: RPLC-MS |
MPA: 0.1% Formic Acid in Water MPB: 0.1% Formic Acid in Acetonitrile |
Gradient Table
MS Conditions: Xevo G3 Mass Spectrometer (Peptide mapping, MSE & DDA)
|
MS system: |
Xevo G3 QToF Mass Spectrometer |
|
Ionization mode: |
ESI Positive, Sensitivity Mode |
|
Acquisition range: |
50–2000 m/z |
|
Capillary voltage: |
1.0 kV |
|
Cone voltage: |
20 V |
|
Source temperature: |
120 °C |
|
Desolvation temperature: |
450 °C |
|
Cone gas: |
50 L/hr |
|
Desolvation gas: |
800 L/hr |
|
MSE experiment settings: |
Scan Rate: 0.5 sec Low Energy: 6 V High Energy: 20–60 V |
|
DDA experiment settings: |
|
|
MS survey scan: |
Scan Time: 0.1 sec Collision Energy: 6 V |
|
MS/MS settings: |
Maximum simultaneous MS/MS acquisitions: 5 Scan Time: 0.2 sec |
|
Start MS/MS acquisition: |
When Intensity > 7500 counts/sec |
|
Stop MS/MS acquisition: |
Acquire until either condition or timeout Condition: Cumulative TIC > 5,000,000 counts Timeout: 2.0 sec |
|
Charge states: |
2+, 3+, 4+, 5+ |
|
Deisotope: |
Off |
|
Inclusion list: |
Use masses preferentially on the list Mass Tolerance: 0.3 Da RT Tolerance: 10 sec Inclusion List: Top 2 charge states for each detected species in MSE analysis |
|
Collision energy: |
Mass Dependent Ramp (Low mass 6–9V; High mass 60–70V) |
Data Management
All subunit data was acquired and processed through the UNIFI™ Application (v 3.14) within the waters_connect™ Informatics Platform (v 4.3). All peptide mapping data was acquired and processed through the UNIFI Application (v 3.6) within the waters_connect Informatics Platform (v 4.1).
Results and Discussion
Subunit Analysis by SCX-MS & SEC-MS
Part 1 of this application note series detailed how SCX-MS and SEC-MS can be used as orthogonal methods to determine OAR of intact AOCs. SCX-MS separates each conjugate species due to the difference in overall surface charge as each additional oligonucleotide is added to the mAb. SEC-MS was used as a generic high throughput LC method without significant chromatographic separation of species, with the end goal of using the MS intensity of each species to determine OAR.
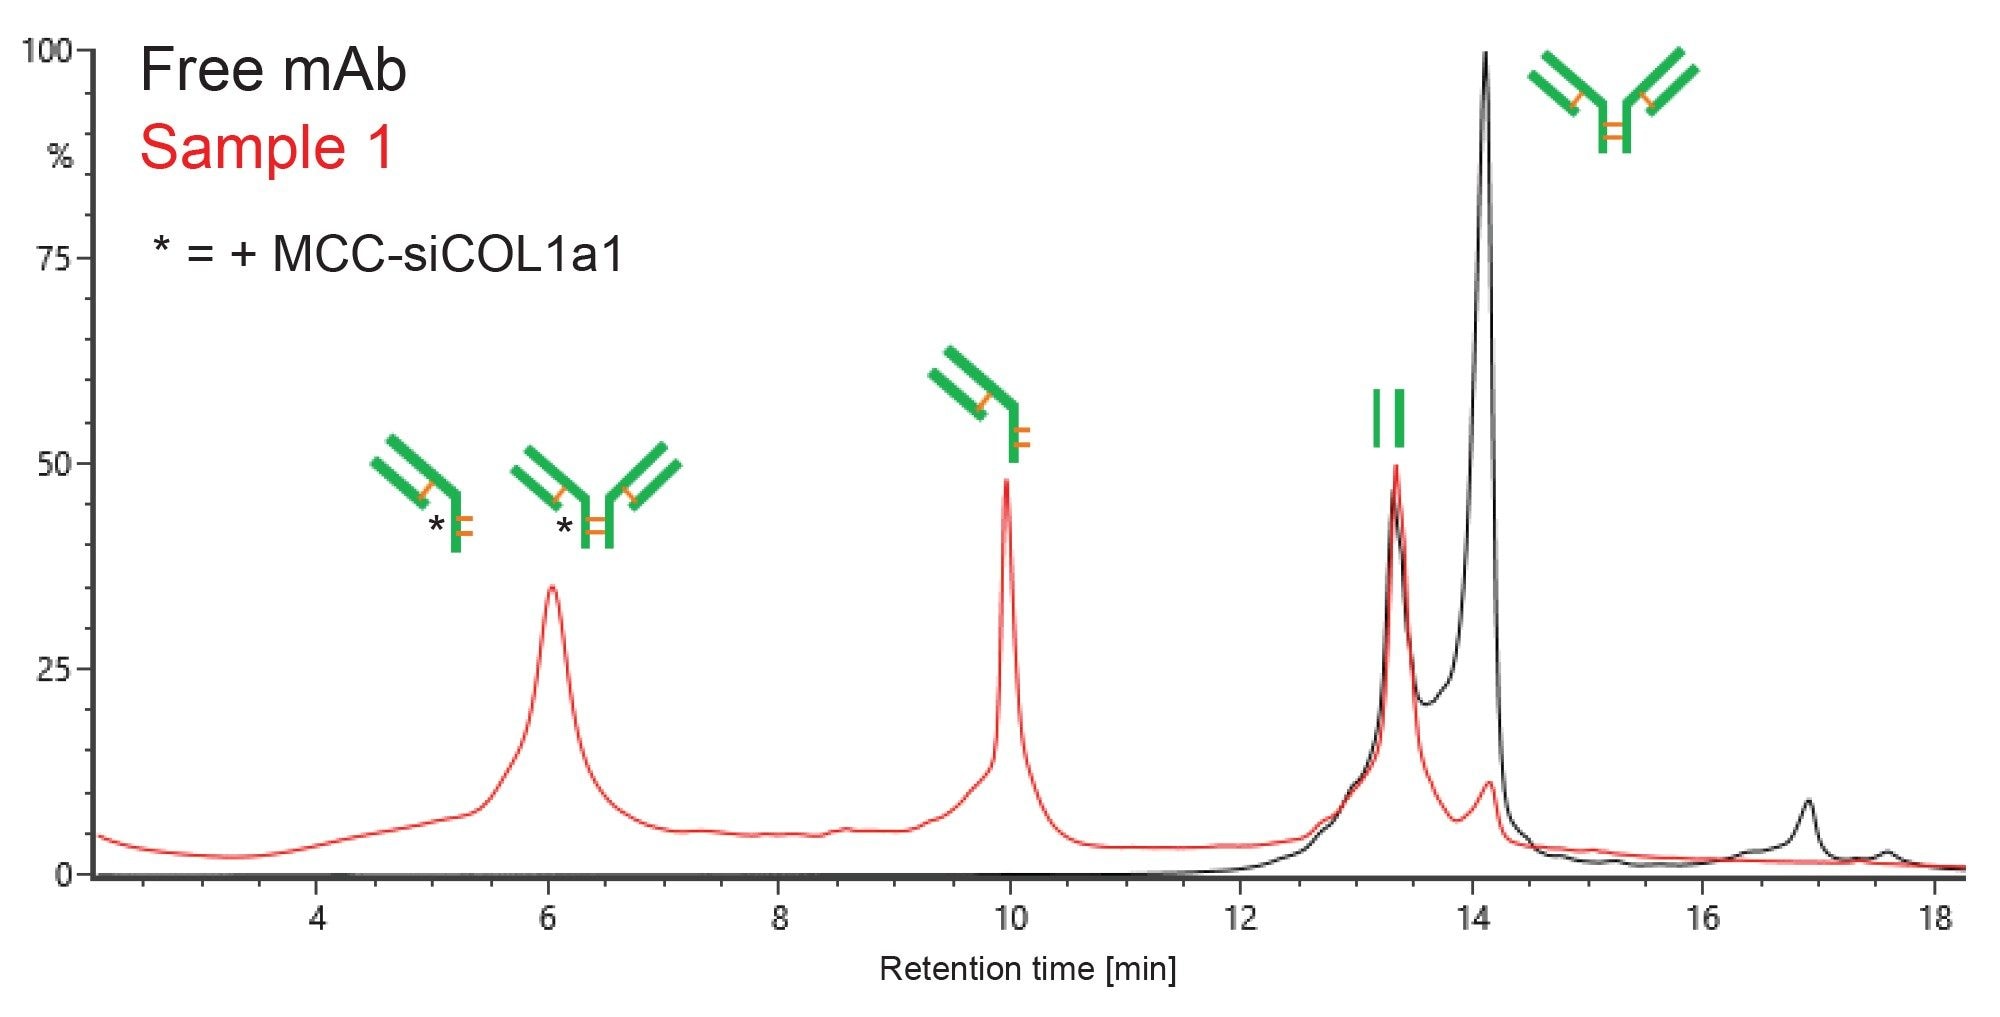
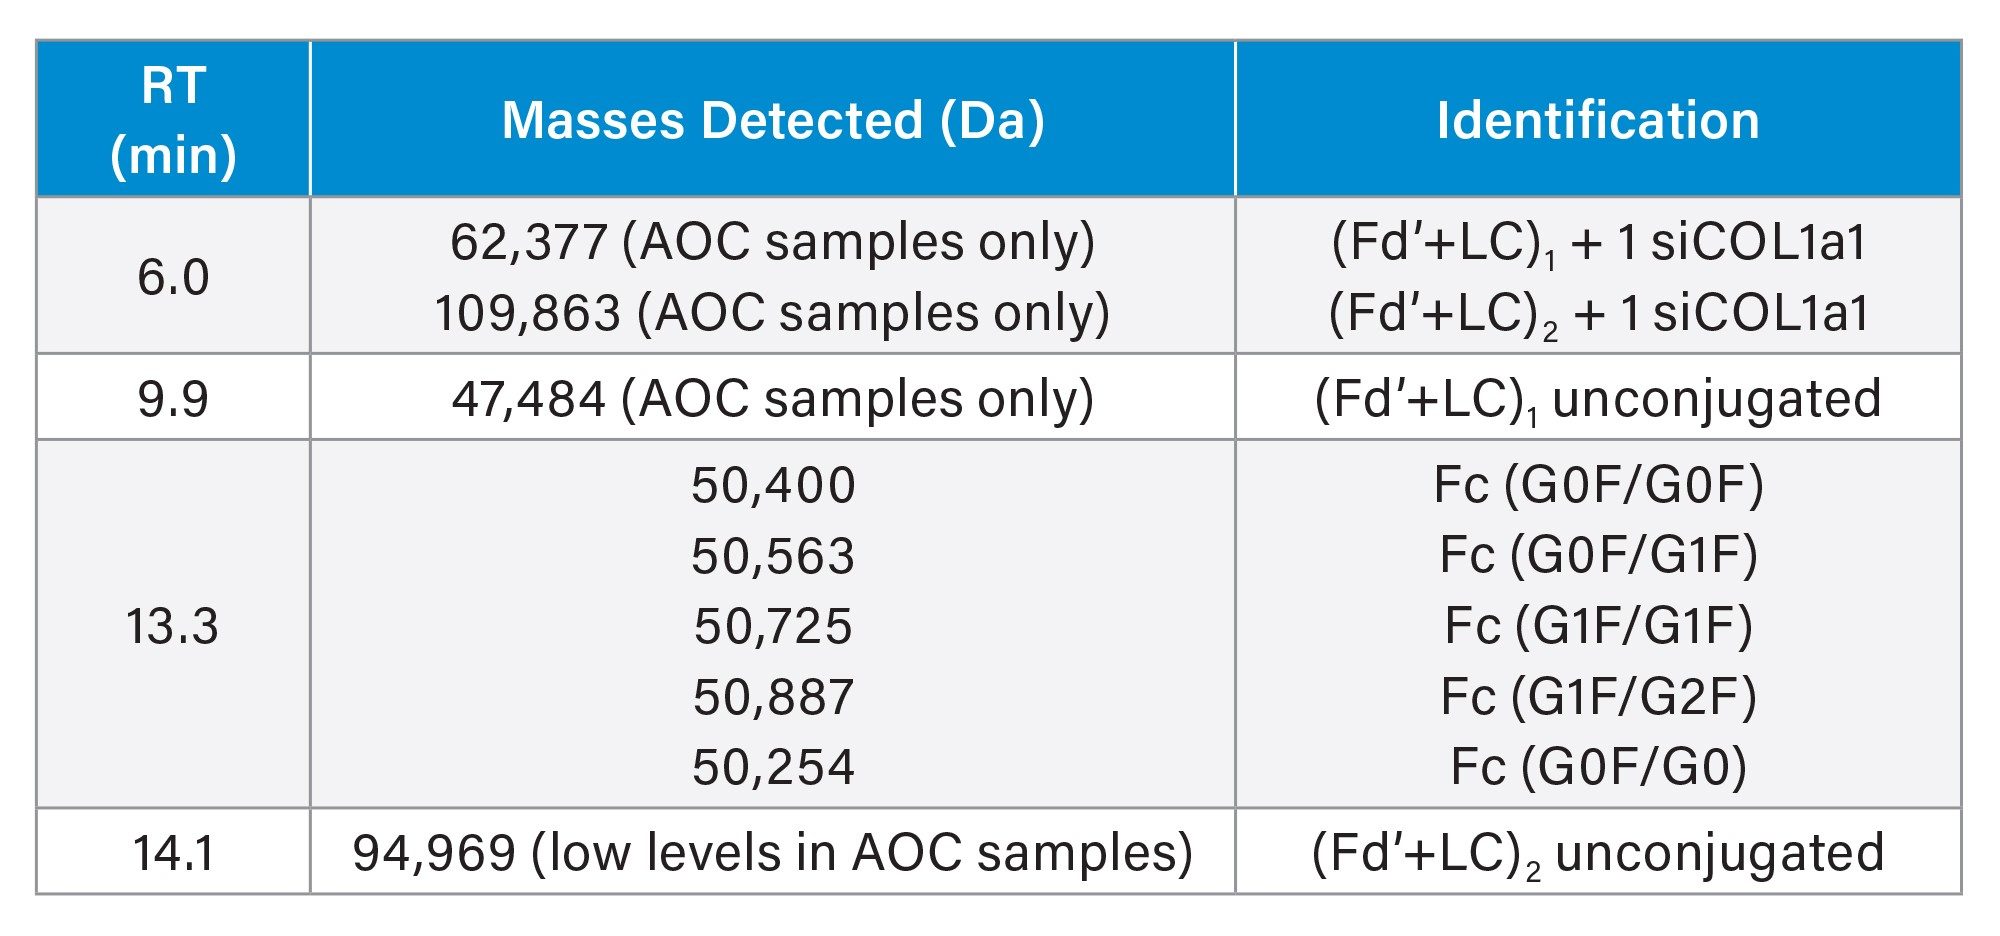
Previous analysis has demonstrated the utility of SCX-MS for mAb analysis at the FabRICATOR-generated subunit level for partial localization of charge variants.3 This application note demonstrates that SCX-MS may also be useful to partially localize the site(s) of conjugation in AOCs. The FabRICATOR enzyme used in these analyses cleaves the mAb below the hinge region, leaving two identical non-covalently linked (yet still associated) Fc chains (~50 kDa) and one covalently linked (Fd’+LC)2 species (~100 kDa). Figure 2 shows the UV overlay of FabRICATOR enzyme-digested free mAb (black) and AOC Sample 1 (red) using SCX-MS analysis. The peak correlating to the Fc species (at 13.3 min) remains constant between the free mAb and AOCs, indicating that no significant level of conjugation has occurred there. The peak corresponding to the unmodified (Fd’+LC)2 (at 14.1 min) in the free mAb significantly decreases or disappears completely in the AOC samples. The conjugated species in the AOC samples can be found eluting earliest, at around 6 minutes. Based on the deconvoluted masses from this region, species can be assigned for (Fd’+LC)2 with one and two siRNA molecules, as well as the single arm (Fd’+LC) with one siRNA molecule. The mass for the peak in the center of the chromatogram (at 9.9 min) is consistent with the single arm (Fd’+LC) unconjugated. Note, for Sample 2 (data not shown), the SCX-MS method would need further optimization for best peak resolution, but the analysis was still useful to gain MS information.
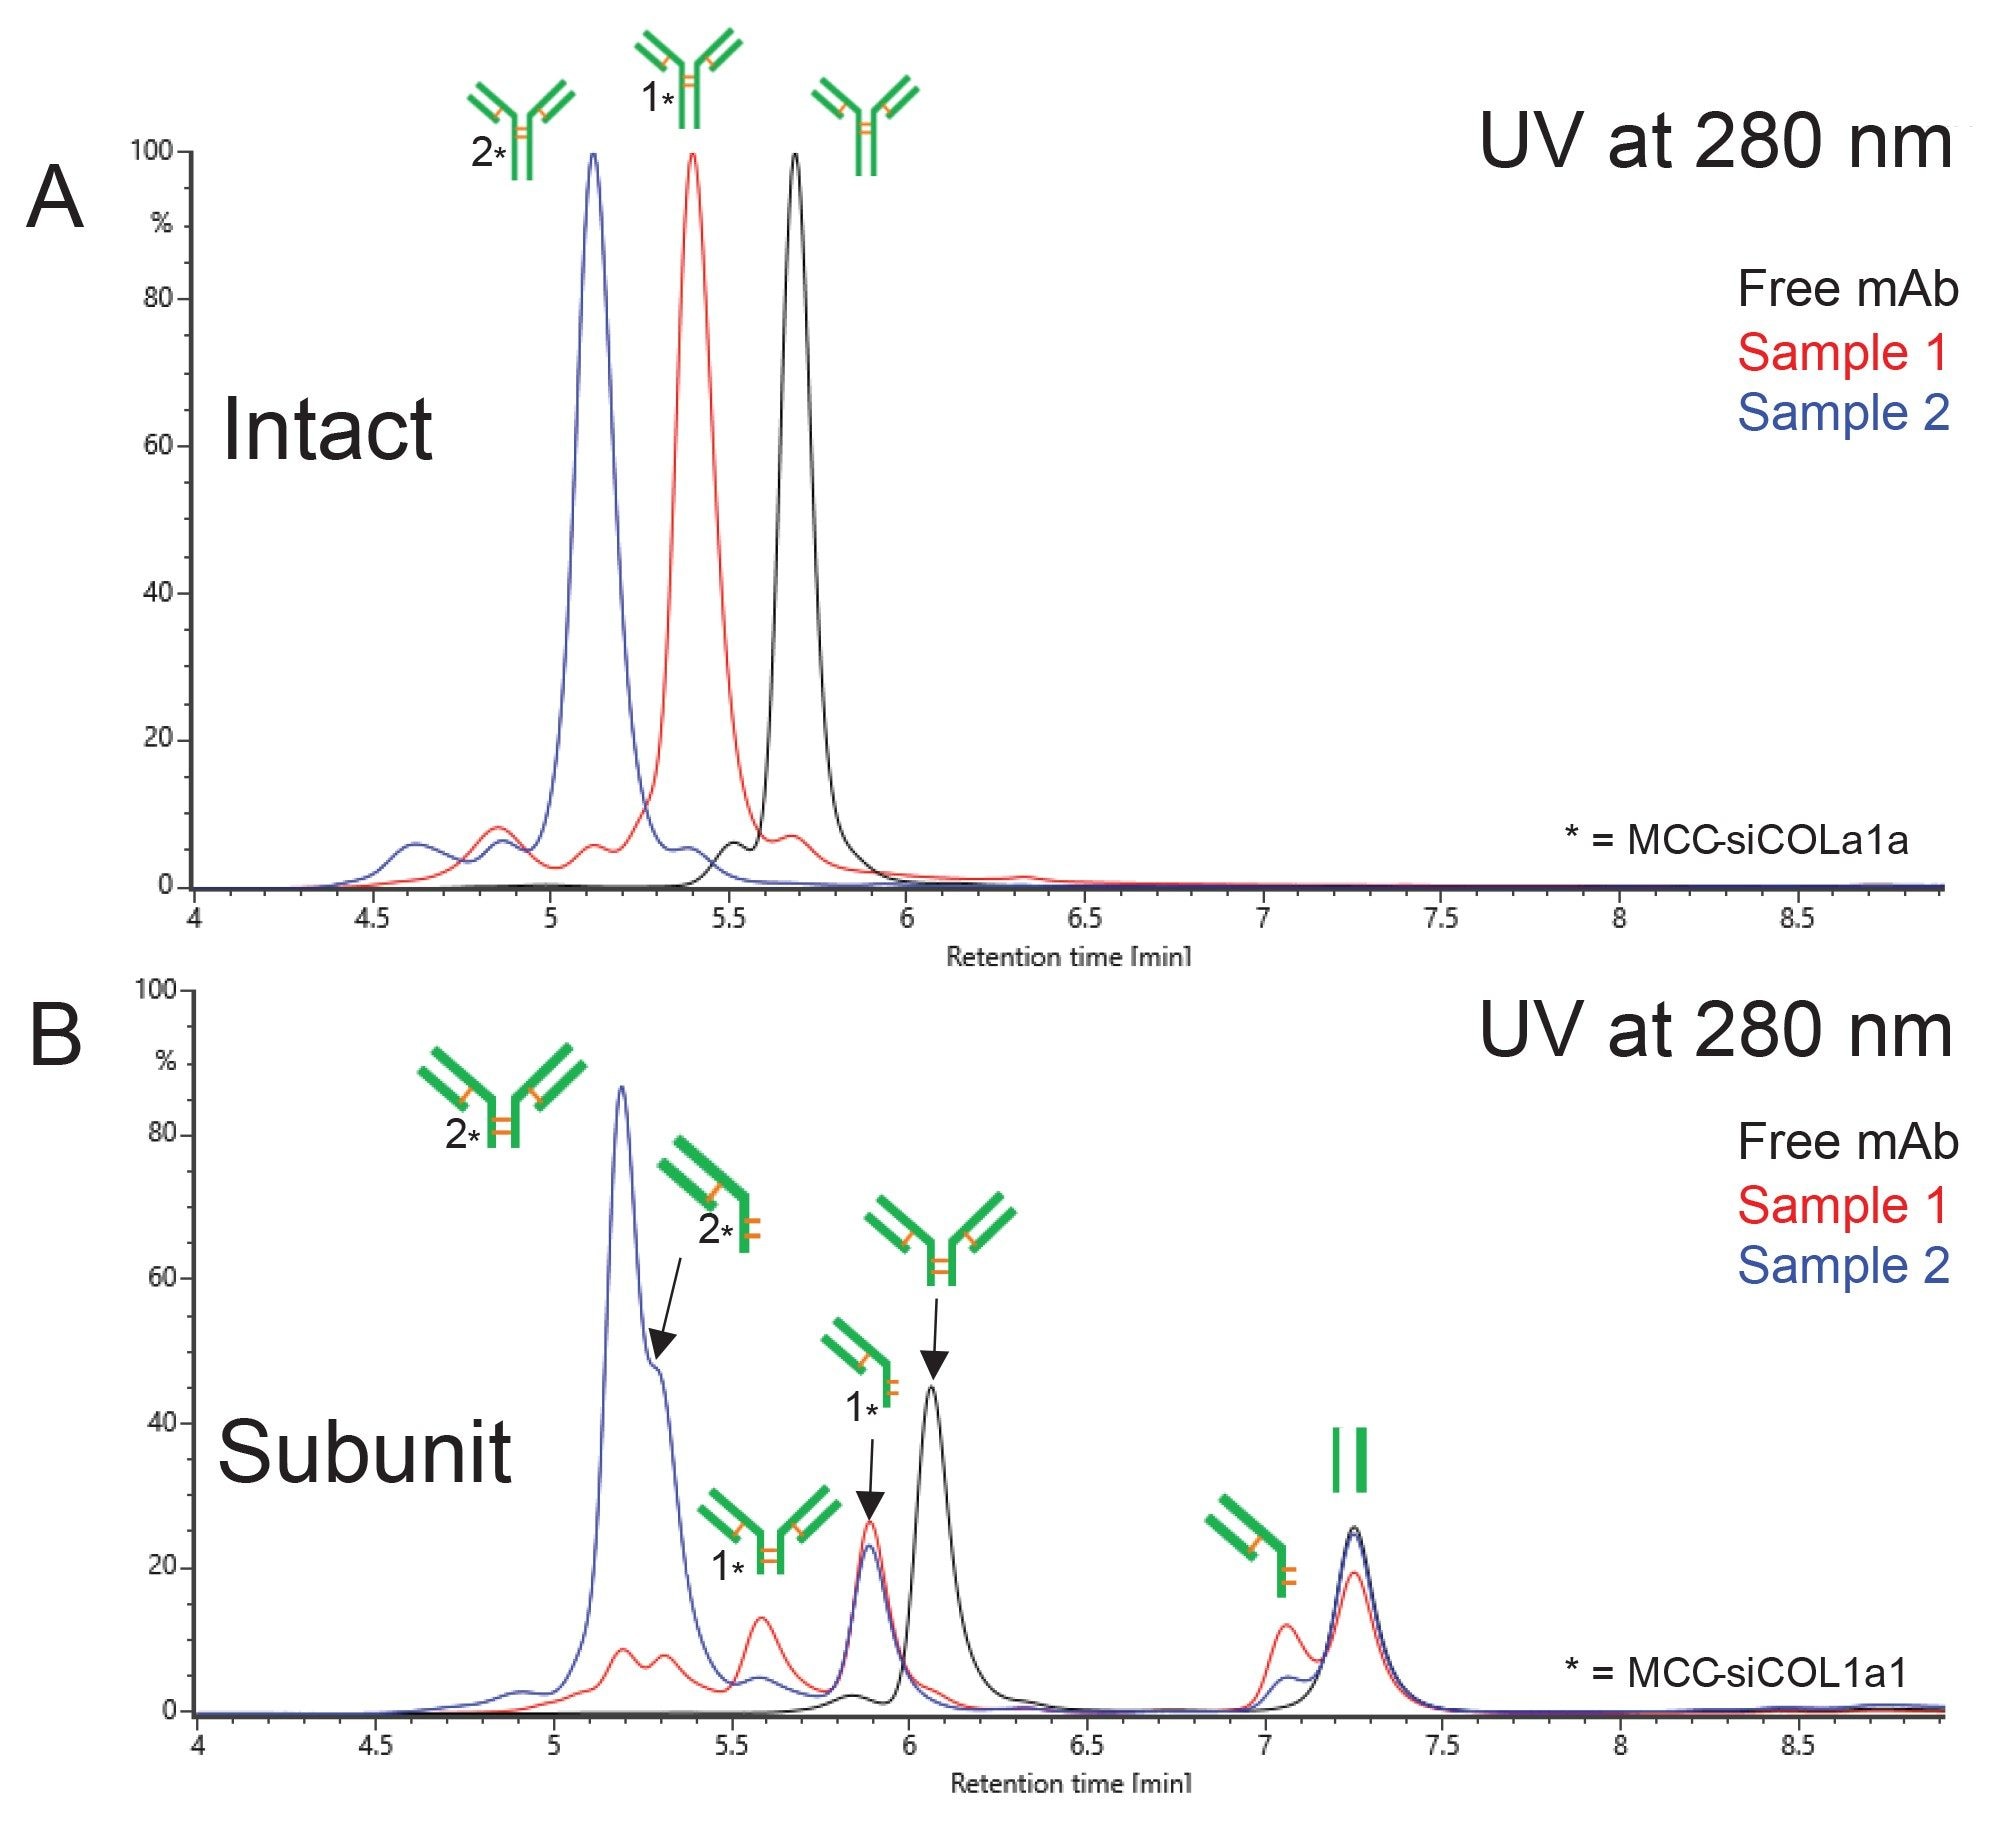
An orthogonal approach to subunit analysis of AOCs is SEC-MS. Just as SEC-MS at intact level offers a more generic approach for OAR analysis, SEC-MS at subunit level is a more generic approach to partial conjugation site localization. For this study, a further optimized SEC-MS method was utilized. Figure 3A shows the UV overlay of all three undigested samples (free mAb in black, AOC Sample 1 in red, and AOC Sample 2 in blue), for reference to the FabRICATOR enzyme-digested samples shown in Figure 3B (same color scheme). Note that the time scales for Figure 3A & 3B are the same for comparison. The species with the latest elution in subunit level analysis (3B) is the non-covalent yet still associated Fc domain, with a retention time of ~7.25 min. As in SCX-MS, this species remains constant throughout each of the three samples, suggesting that there is no significant level of conjugation occurring below the hinge region. For Sample 1 (Fig 3B, red trace), the same species that were detected via SCX-MS were also detected in SEC-MS—the (Fd’+LC)2 with one siRNA molecule, the single arm (Fd’+LC) with one siRNA molecule, and the single arm (Fd’+LC) unconjugated. For Sample 2 (Fig 3B, blue trace), the most abundant species present are the (Fd’+LC)2 and single arm (Fd’+LC), both doubly conjugated (RT 5.25 min). This is followed by the singly conjugated and unconjugated single arm (Fd’+LC) species (5.6 & 5.9 min, respectively). Note that the free mAb sample (Fig 3B, black trace) has only fully formed (Fd’+LC)2 species (RT 6.1 min).
Both the SCX-MS and SEC-MS analyses of the free mAb and AOC samples indicate that the conjugation site(s) resides above the hinge region, as expected. The presence of the single arm (Fd’+LC) species indicates that the conjugation site(s) may occur on the hinge region cysteines, or at the very least that the disulfide bonds in that region are disrupted and not reformed during the conjugation process. This can be useful information for researchers and process engineers for optimization of the conjugation reaction.
Conjugation Site Determination via Peptide Mapping
LC-MS analysis of peptide-oligonucleotide conjugates is challenging, due to the stark differences in MS analysis methods for the individual species. Peptides are generally analyzed via RPLC-MS using positive mode ESI, while oligonucleotides are commonly analyzed via IPRP-MS or HILIC-MS using negative mode ESI. In order to bridge this gap, an approach to AOC peptide mapping is presented, which enables a streamlined generalized sample preparation to yield truncated peptide-oligo species that can be analyzed using typical peptide mapping LC-MS workflows (using ESI positive mode and CID fragmentation). Figure 4 outlines the sample preparation workflow, where the sample is first digested with the nucleoside digestion mix, cleaving between each phosphate group in the oligonucleotide backbone. This leaves the remaining linker species (and any non-phosphate part of the oligonucleotide that is connected to the linker) attached to the peptide. This truncated species can be used as a “marker” to demonstrate the site of oligonucleotide conjugation. The sample is then denatured, reduced, alkylated, and proteolytically digested in a standard peptide mapping experiment. The resulting peptides are separated via reversed phase chromatography, detected using ESI positive mode mass spectrometry, and fragmented to enable peptide confirmation as well as conjugation site determination.
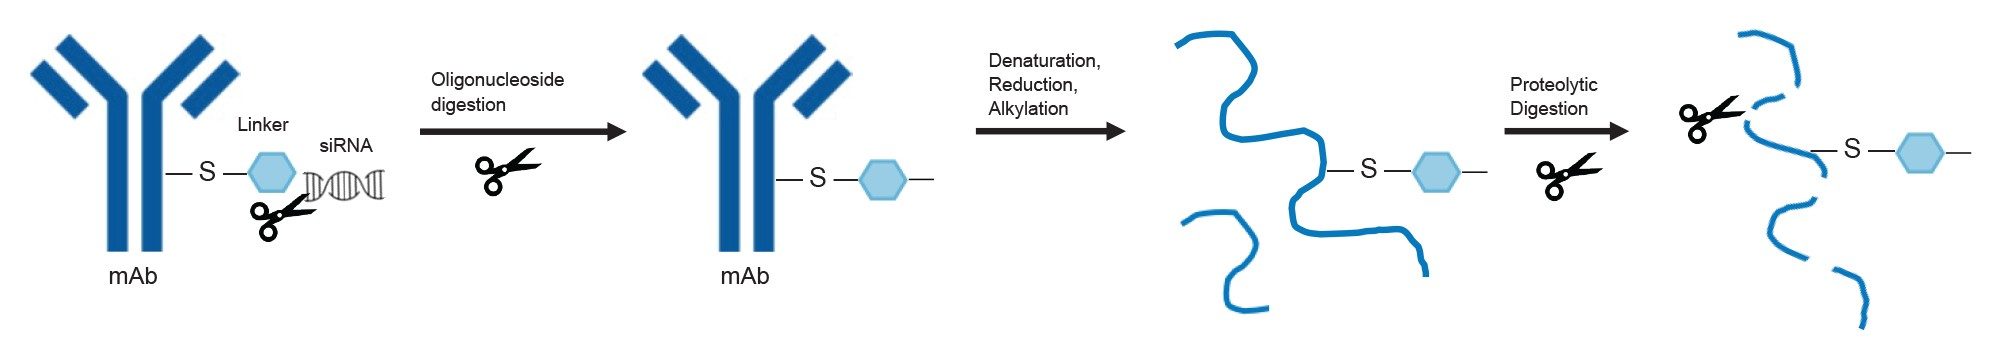
The structure of the AOCs used in this case study consisted of double stranded siRNA (siCOL1a1) conjugated via MCC linker to an IgG1 isotype control mAb. The MCC linker was joined to the siRNA through a C6-amino modification on the sense strand (more detail in Part 2 of this application note series). The linker + siRNA moiety was then reacted to the IgG1 via stochastic cysteine labeling. When this construct was prepared through the workflow described in Figure 4, the nucleoside digestion mix correctly cleaved the oligonucleotide backbone down to the last remaining phosphate group, leaving behind the MCC linker with C6 amino group still attached at the cysteine site. The nucleoside digestion reaction completion was confirmed via intact AOC analysis before proceeding to peptide mapping. (Intact analysis was performed via the SEC-MS method described in Part 1 of the application note series, data not shown).
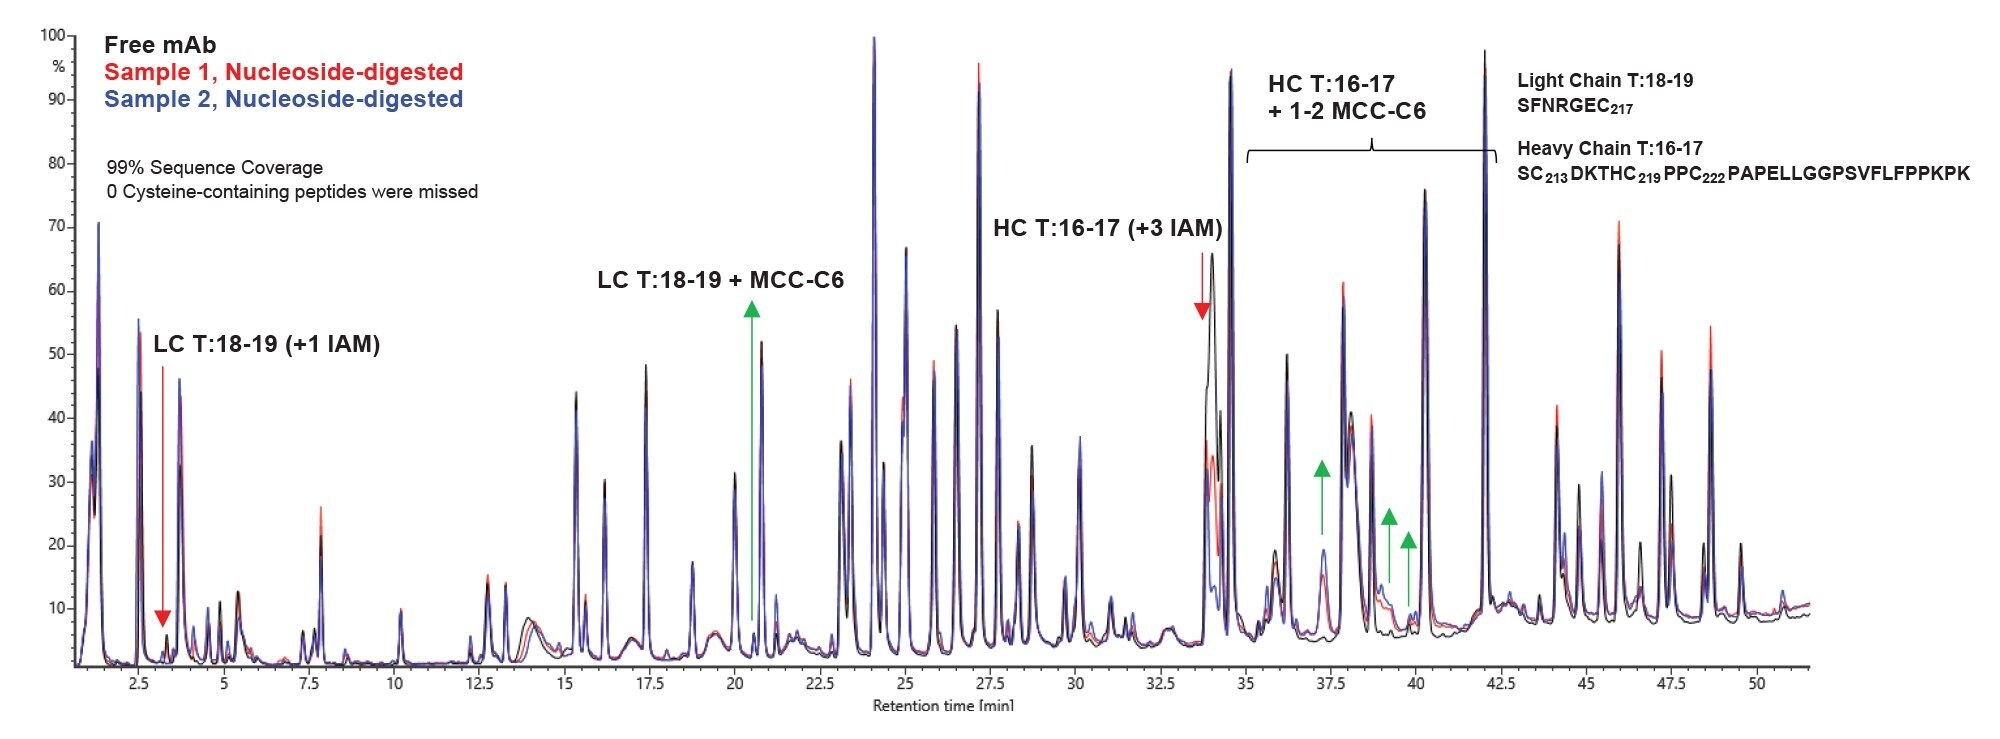
The LC-MS data from this case study of AOC samples processed with this peptide mapping workflow are shown in Figure 5. The TIC overlay shows chromatographic separation of the digested peptides from free mAb (black trace), Sample 1 (red trace), and Sample 2 (blue trace). Sample 1 and Sample 2 were pre-treated with the nucleoside digestion mix, and all three samples were denatured, reduced, & alkylated prior to proteolytic digestion with RapiZyme Trypsin. (Note, previous intact mass experiments (data not shown) confirmed no impact of incubation of free mAb with nucleoside digestion mix. For this peptide mapping experiment, no nucleoside digestion mix was added to the free mAb.) A significant decrease in peak intensity for the heavy chain (HC) T:16–17 species +3 IAM (RT 34 min, noted with a red arrow) is observed in the AOC samples, followed by the appearance of new peaks corresponding to HC T:16–17 + mass shifts for 1 or 2 linker species conjugated (noted with green arrows, HC T:16–17 + 1–2 MCC-C6). HC T:16–17 peptide refers to the peptide containing the two cysteines that make up the hinge region of the IgG1, as well as the cysteine that is involved in the disulfide bond that connects the heavy chain to the light chain. As one might expect, the corresponding peptide from the light chain that contains the connecting cysteine (LC T:18–19) was also observed in conjugated form (noted with a green arrow, labeled LC T:18–19 + MCC-C6).
In addition to the ability to use standard RPLC-MS methods, another benefit of using this approach is the ability to utilize existing software tools. We use the standard peptide mapping workflow in the UNIFI Application, using the same processing parameters one would use for an unconjugated antibody. The analyst only needs to create a custom modification for the linker tail species in the Scientific Library to be used as a modification to search during data processing. In this case, the custom modification is the MCC linker + C6 chain expected to be remaining after nucleoside digestion. The LC-MS data collected with MSE fragmentation was processed through the UNIFI Application peptide mapping workflow, and the resulting list of conjugated peptides detected for Sample 2, as an example, is shown in Figure 6. (Note: All other cysteine-containing peptides were detected in the chromatogram (total sequence coverage, 99%), and none were found with evidence of conjugation.)
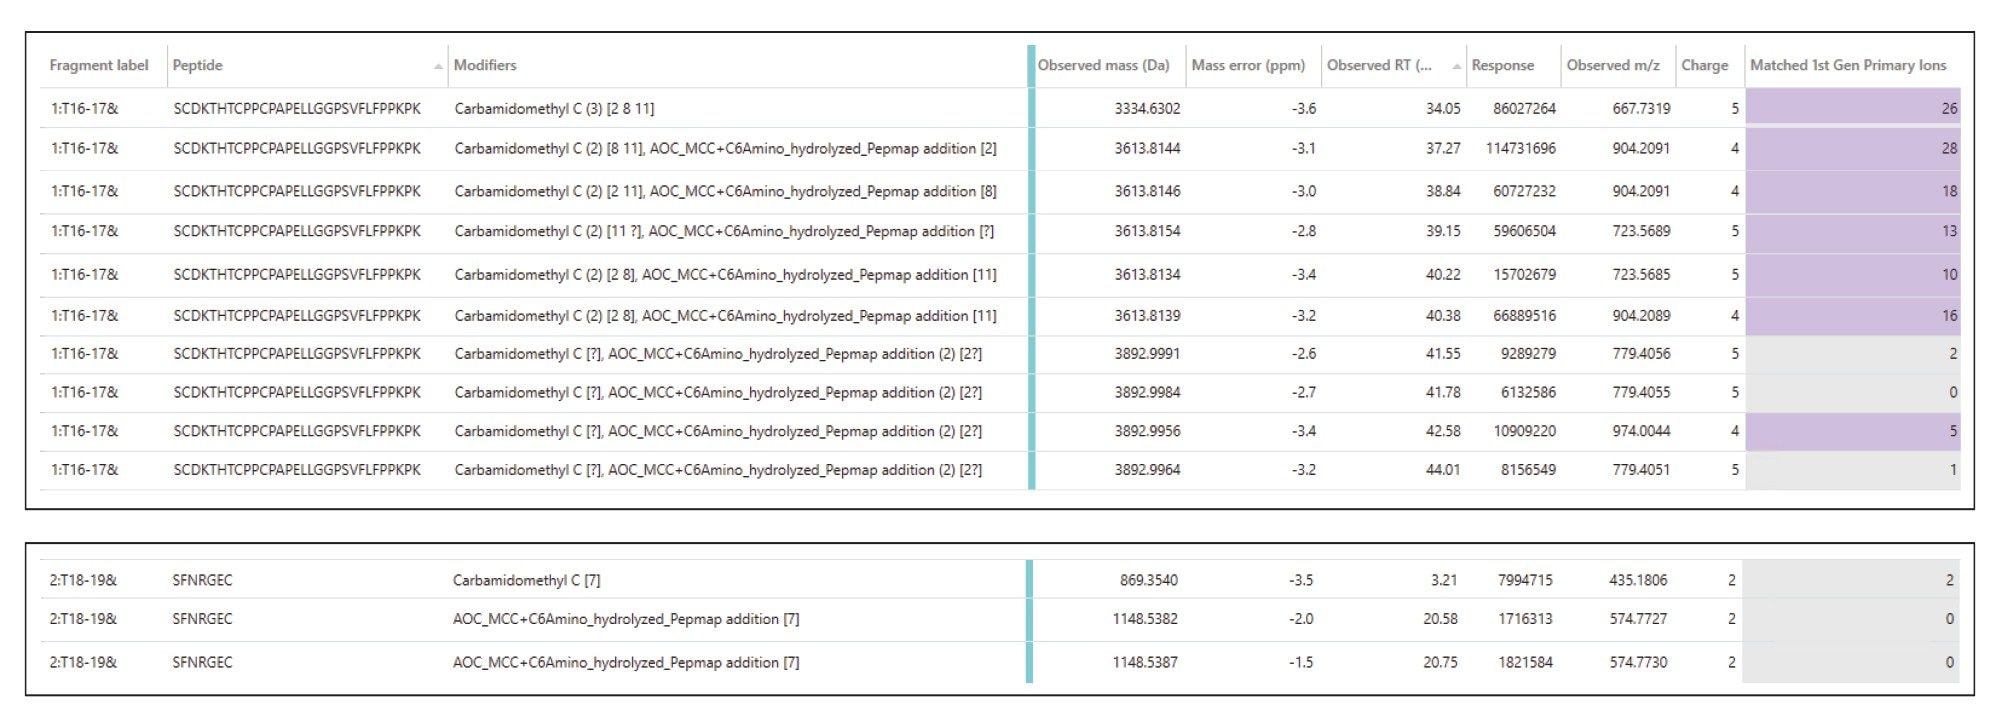
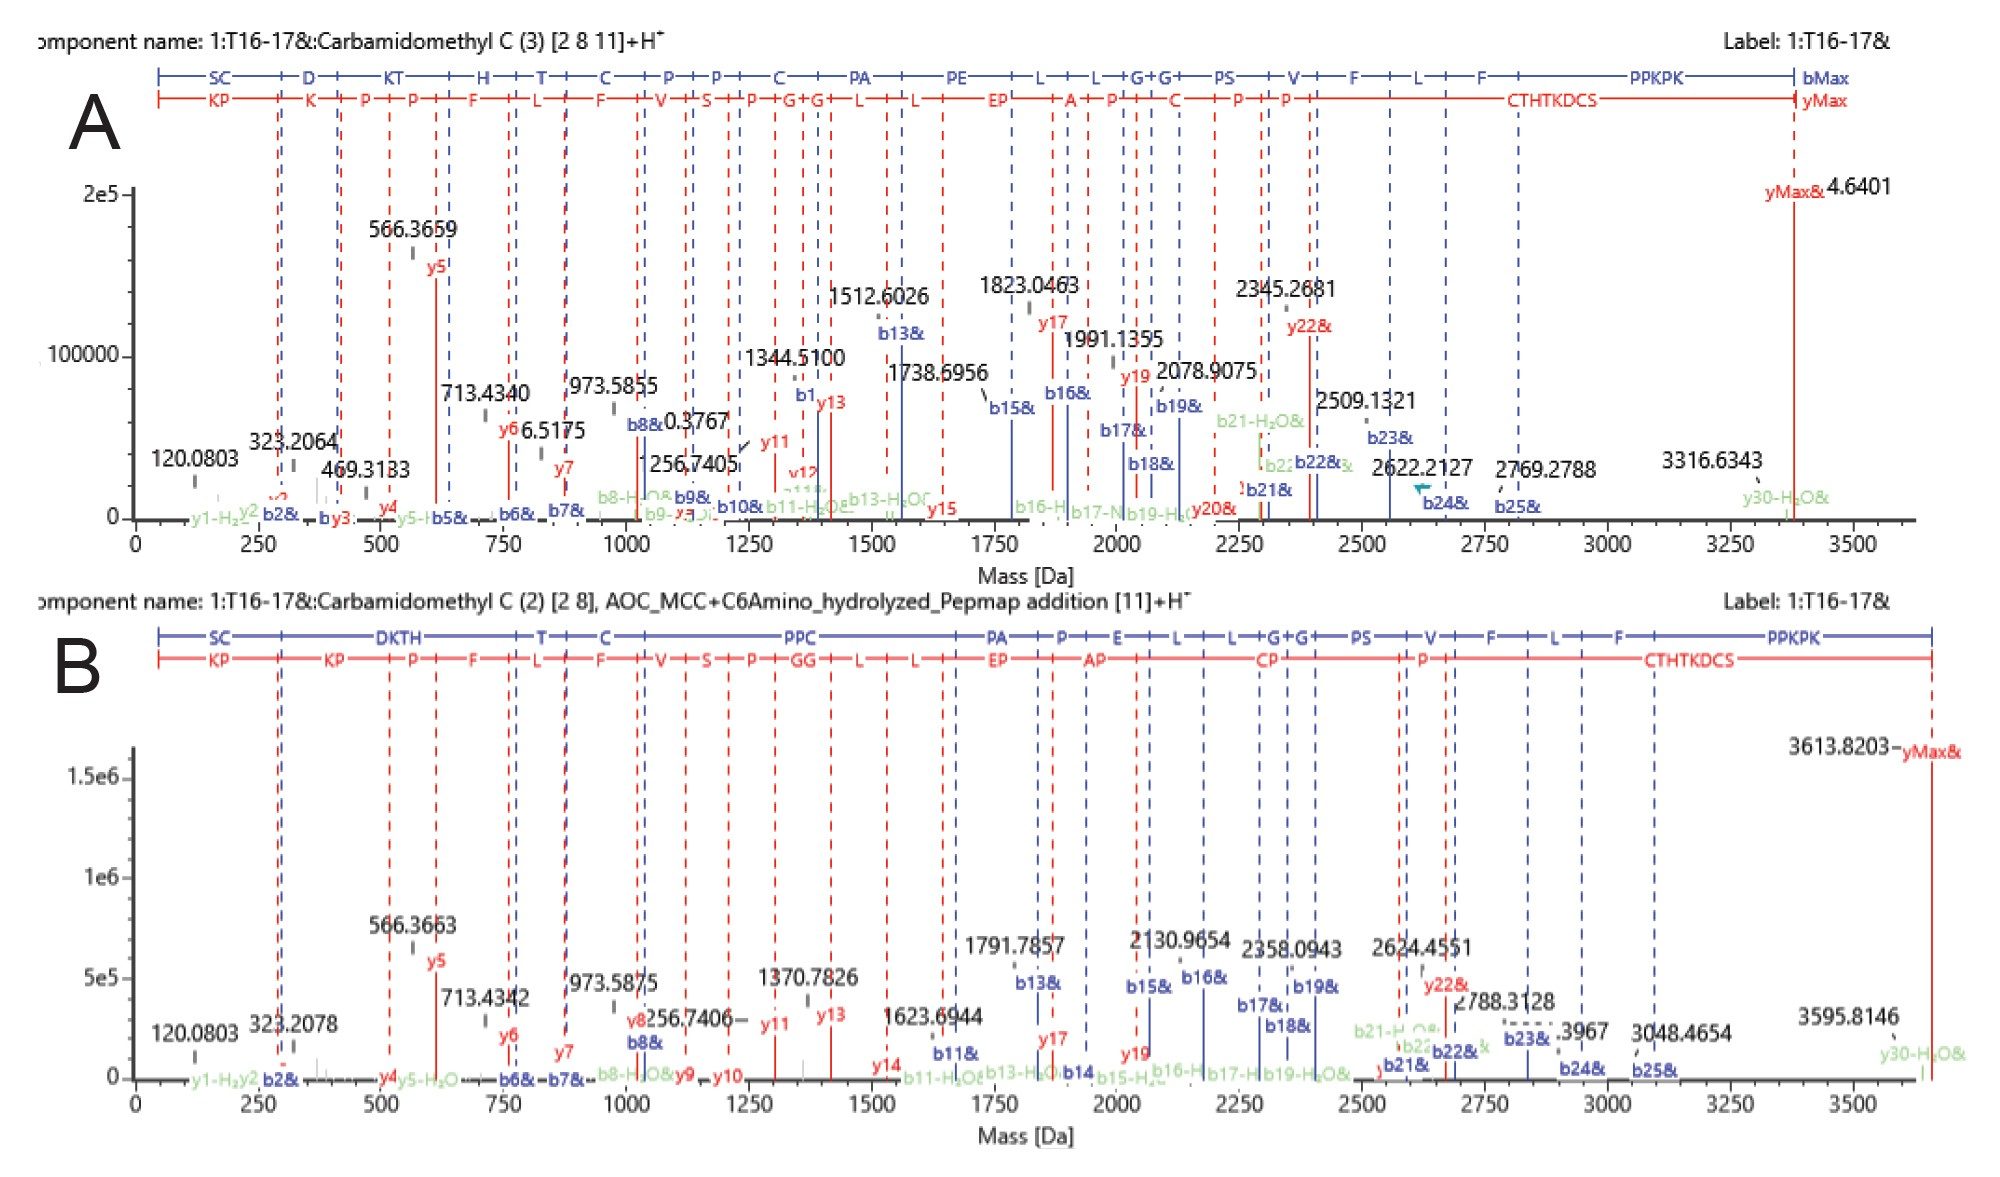
The HC T16–17 peptide (SCDKTHTCPPCPAPELLGGPSVFLPPKPK) contains three possible cysteines available for conjugation. This peptide was detected with a wide variety of +1 and +2 conjugation sites occupied, separated chromatographically. Line 1 of Figure 6 corresponds to unconjugated HC T:16–17 (+3 Carbamidomethyl sites resulting from alkylation step of sample preparation). Lines 2–6 in the list of peptides correspond to HC T16–17 + two Carbamidomethyl and one MCC-C6 linker species. Fragmentation data from MSE analysis was able to confidently identify these peptides. Example CID peptide fragmentation data is shown in Figure 7. The fragmentation pattern of the unconjugated HC T:16–17 species at RT 34 min (Fig 7A) was compared to the fragmentation of the singly conjugated HC T:16–17 species at RT 40.4 min (Fig 7B). The presence of the same b8 ion (containing HC C213 and C219) in both spectra indicates that the first two cysteines in the peptide sequence do not have any conjugation present. In the b ion series, the conjugate species begins to appear at b11, which is the site of HC C222. From the y ion series, the fragmentation pattern remains the same until y19, and the next possible cysteine-containing y ion, y22 (which only contains C222), was confirmed with conjugation. Therefore, this species at RT 40.4 min can confidently be assigned as conjugation at HC C222.
The remaining conjugated peptide species shown in Figure 6 are as follows: Lines 7–10 correspond to doubly conjugated HC T16–17 (+ one Carbamidomethyl and two MCC-C6 linker species). The last three peptide species shown in Figure 6 correspond to the light chain peptide LC T18–19 (SFNRGEC), unconjugated and singly conjugated. Note that these species were lower in abundance, or are smaller peptides, so the assignments made with the MSE data were less confident. Therefore, the analysis was repeated with DDA acquisition, which allows the use of an inclusion list to isolate and fragment the species of interest, specifically. This analysis (data not shown) provided confident site identification for all of the conjugated peptide species.
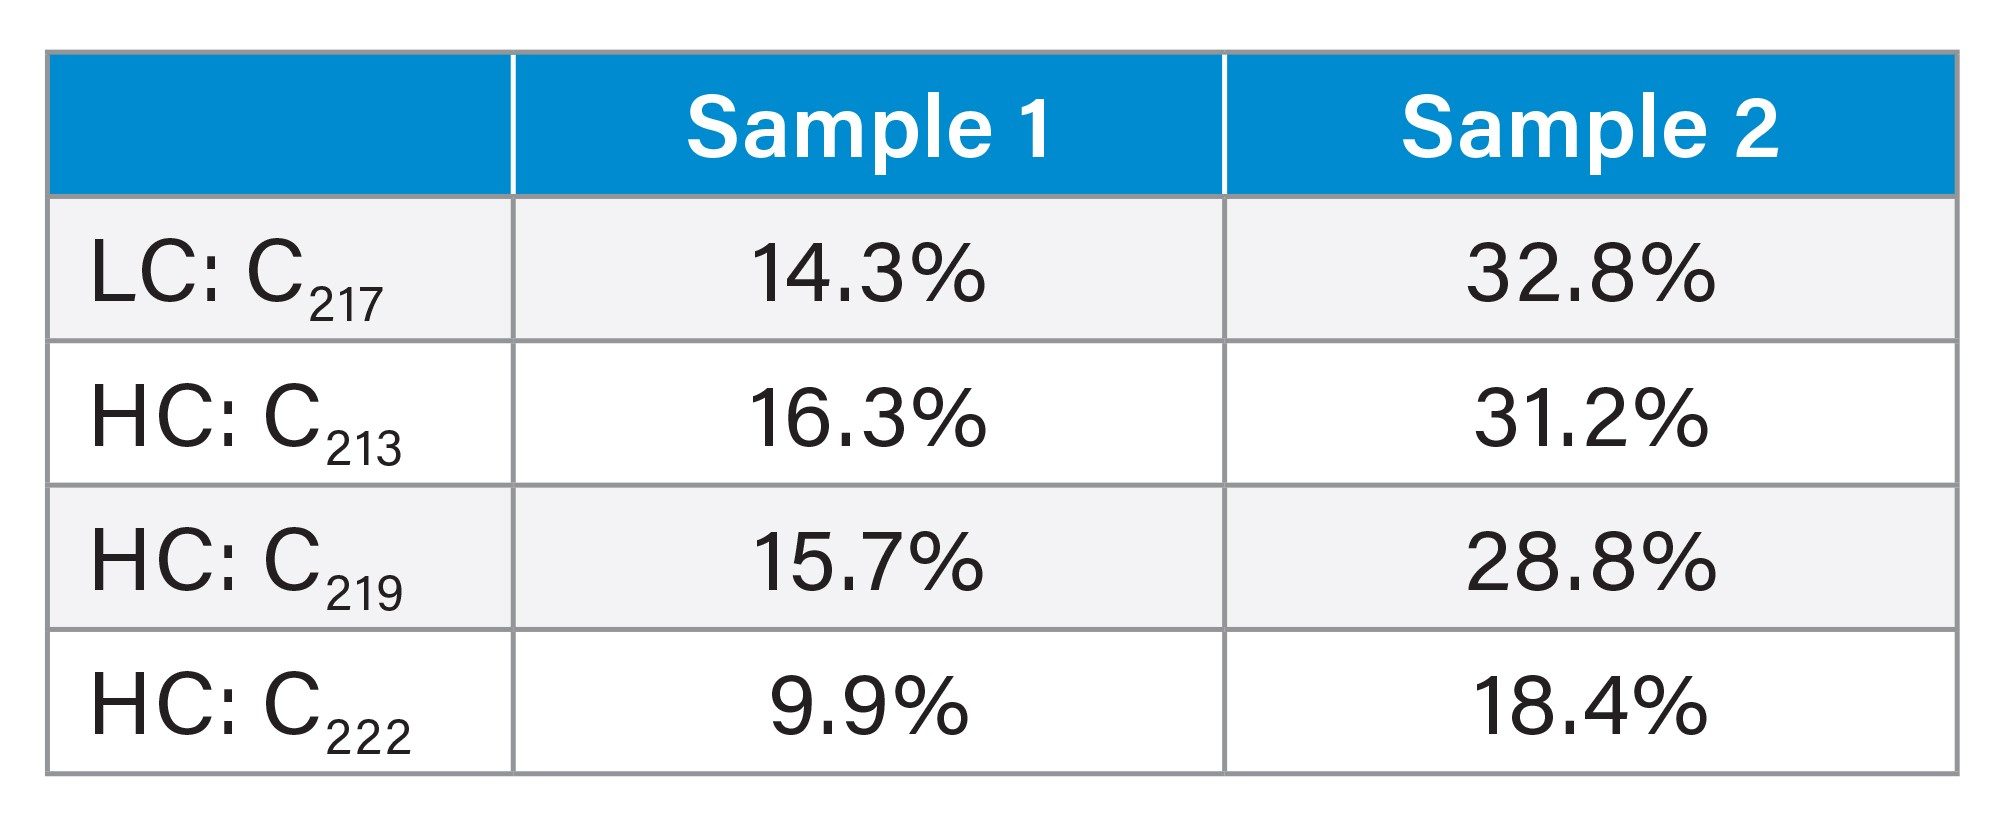
To finalize the analysis, the relative quantitation of each conjugated site was calculated via peak areas from the extracted ion chromatograms (XICs) of each species. The longer miscleaved peptides were preferred for relative quantitation, as the fully cleaved smaller peptides (HC T16 (SCDK) and LC T19 (GEC) were poorly retained on the reversed phase column. Proteolytic digestion conditions favoring these singly miscleaved peptides were chosen for the analysis. Results for each conjugation site are reported in Table 2. Overall, the four cysteine sites found with conjugation ranged from 10–17% in Sample 1 and 18–33% in Sample 2.
Conclusion
This application note first demonstrates successful partial conjugation site localization by subunit level LC-MS in native conditions, either by SCX or SEC separation. The results from these analyses not only give partial localization of the conjugation site but may also give valuable insight into the structure of the conjugated species resulting from conjugation reaction conditions. Secondly, this work presents (to the best of current knowledge) the first successful approach to determining and relatively quantifying oligonucleotide conjugation sites at the peptide level, including peptide backbone CID fragmentation to enable site confirmation experimentally. This peptide mapping workflow for AOC conjugation site determination can be easily adopted using existing peptide mapping sample preparation, analysis, and software tools.
By streamlining AOC conjugation site analysis, Waters toolbox enables researchers and biotherapeutic developers to rapidly assess and optimize conjugation strategies, improve product quality attributes, and support regulatory compliance. The ease of workflow adoption and compatibility with existing systems uniquely positions Waters solutions as essential for accelerating AOC-based drug development programs and expanding opportunities in next-generation biotherapeutic pipelines.
References
- Dovgan I, Koniev O, Kolodych S, Wagner A. Antibody–Oligonucleotide Conjugates as Therapeutic, Imaging, and Detection Agents. Bioconjugate Chem. 30, 2483–2501 (2019). (http://doi.org/10.1021/acs.bioconjchem.9b00306)
- Jiao J, Qian Y, Lv Y, Wei W, Long Y, Guo X, Buerliesi A, Ye J, Han H, Li J, Zhu Y, Zhang W. Overcoming limitations and advancing the therapeutic potential of antibody-oligonucleotide conjugates (AOCs): Current status and future perspectives. Pharmacological Research. 209, 107469 (2024). (http://doi.org/10.1016/j.phrs.2024.107469)
- Ippoliti S, Schmudlach A, Lauber MA, Yu YQ. Online IEX-MS of mAb Charge Variants Using a BioResolve SCX mAb Column, IonHance CX-MS pH Concentrates, and BioAccord System. Waters Application Note 720006672EN. 2019.
- Brandenburg C, Liu H, Kenrick S. Determination of Multiple Quality Attributes of Antibody-Oligonucleotide Conjugate with SEC-MALS and AEX-MALS. Waters-Wyatt White Paper WP8010. 2024. (White Paper referenced in introductory notes)
Acknowledgement
The authors would like to acknowledge Connor Brandenburg and Tara MacCulloch for their technical expertise in conjugation chemistry and AOC production used to create the samples used for this analytical method development.
Waters, BioAccord, UPLC, IonHance, ACQUITY, BEH, CSH, BioResolve, RapiZyme, UNIFI, waters_connect, RDa, and Xevo are trademarks of Waters Technologies Corporation. FabRICATOR is a trademark of Genovis AB.
720009079, October 2025