• Nota applicativa

A Generic Kit-Based Approach for LC-MS/MS Quantification of Urinary Albumin for Clinical Research

A Generic Kit-Based Approach for LC-MS/MS Quantification of Urinary Albumin for Clinical Research

  • Mary E. Lame
  • Caitlin Dunning
  • Erin E. Chambers
  • Waters Corporation

For research use only. Not for use in diagnostic procedures.

Abstract

LC-MS is widely accepted for protein quantification for use in clinical research. This application note describes a high sensitivity LC-MS quantification of a protein biomarker. This workflow can be complex and time consuming, often taking 24 hours to achieve analytically sensitive and accurate quantification. Using ProteinWorks eXpress Digest and ProteinWorks μElution SPE Clean-Up Kits, accurate quantification over 3.5 orders of magnitude (0.1–500 μg/mL) was readily achieved.  

Benefits

High analytical sensitivity LC-MS quantification of a protein biomarker, speed and reproducibility of a generic kit-based approach for protein quantification, Xevo TQ-XS Mass Spectrometer for protein quantification, mixed-mode SPE selectivity, high analytical sensitivity without affinity purification.

Introduction

Albumin (~ MWT 66.5 kDa) is the most abundant protein in blood, and is a common biomarker used to assess renal function.1-3 Under normal kidney function, urinary albumin levels are quite low (<30 mg/day), but following renal injury albumin levels in urine can exceed 300 mg/day.2-4 Existing affinity-based methods for urinary albumin quantification include: immunoturbidimetric, ELISA and radioimmunoassay.5-7 While these immunoassay (IA) methods are analytically sensitive and simple to execute, poor reagent reproducibility, lack of standardization, cross-reactivity, limited linear dynamic range, and other short-comings have led to increased interest in LC-MS based methods. With its many benefits (e.g., multiplexing, selectivity, dynamic range, and fast method development), LC-MS is widely accepted for protein quantification for use in clinical research. However, this workflow can be complex and time consuming, often taking 24 hours to achieve analytically sensitive and accurate quantification. Using ProteinWorks eXpress Digest and ProteinWorks µElution SPE Clean-Up Kits, accurate quantification over 3.5 orders of magnitude (0.1–500 µg/mL) was readily achieved. The digestion time in this work is only 2 hours, which is 9X faster than previously published LC-MS methodologies.3 The analytical sensitivity represents a 50X improvement over earlier LC-MS methods and accurately quantifies low endogenous levels in urine while approaching the analytical sensitivity of immunoassays.3,8

Experimental

To prepare calibration standards and quality control (QC) samples, various concentrations (0.1–500 µg/mL) of human serum albumin (HSA) were spiked into normal human urine. Calibration curve standards were prepared in duplicate using one lot of human urine, while the QC samples were prepared in triplicate and in 3 individual lots of urine. The urine samples (15 µL) were digested for 2 hours using the ProteinWorks eXpress Digestion Kit and protocol provided. Specifically, the 5-Step method, which includes reduction and alkylation, was used. Following digestion, four stable isotopically labeled (13C15N) albumin tryptic peptides: YLYEIAR,FQNALLVR, LVNEVTEFAK, and VFDEFKPLVEEPQNLIK (New England Peptide, Gardner, MA, USA) were added as internal standards. Post digestion purification of albumin signature peptides was done using the ProteinWorks µElution SPE Clean-Up Kit and included protocol. Specifically, 100 µL of the post digestion sample was processed by SPE and eluted with 50 µL of elution solution. The resulting sample was then directly injected for LC-MS analysis.

LC conditions

LC system:

ACQUITY UPLC

Detection:

Xevo TQ-XS Mass Spectrometer, ESI+

Column:

ACQUITY UPLC Peptide BEH C18, 1.7 μm, 2.1 x 150 mm

Column temp.:

55 °C

Sample temp.:

10 °C

Injection vol.:

5 μL

Mobile phases:

A: 0.1% Formic acid in H2O

B: 0.1% Formic acid in ACN

Gradient:

Time (min)

Flow rate (mL/min)

%A

%B

Curve

Initial

0.3

95

5

6

8.0

0.3

65

35

6

9.0

0.3

10

90

6

10.5

0.3

10

90

6

11.0

0.3

95

5

6

13.0

0.3

95

5

6

MS conditions

MS system:

Xevo TQ-XS

Ionization mode:

ESI+

Capillary:

3.0 kV

Cone:

30 V

Source Offset:

30 V

Source temp.:

150 °C

Desolvation temp.:

600 °C

Cone gas flow:

150 L/Hr

Desolvation gas flow:

1000 L/Hr

Collision gas flow:

0.15 mL/Min

Nebulizer gas flow:

7 Bar

Data management:

MassLynx (v4.1)

Quantification software:

TargetLynx

Results and Discussion

Albumin is a globular protein produced in the liver. In plasma it functions as a transport protein and also contributes to the stabilization of extracellular fluid volume, helping to regulate oncotic pressure.1,2 Albumin is filtered by the kidneys and is reabsorbed by the proximal tubules.9 Its presence in urine is often one of the first signs of kidney damage. Thus, it has become an important biomarker for renal disease. As a result, accurate measurement in urine is of high interest in drug discovery and clinical research.

For those with renal impairment, increase in urinary albumin levels (albuminuria) can be quite extreme. The severity of albuminuria is classified by the amount of albumin present in urine. In healthy individuals, albumin levels are relatively low, generally <30 µg/mL and is referred to as normoalbuminuria, while elevated levels between 30–300 µg/mL and >300 µg/mL are classified as microalbuminuria and macroalbuminuria, respectively.2-4 From an analytical standpoint, immunoassays have been the primary method for quantifying urine albumin. While these immunoassays are sensitive, the presence of modified or fragmented forms of albumin often leads to analytical specificity issues.3,10 Furthermore, other methods such as colorimetric or turbidimetric often lack the analytical sensitivity to detect low levels that would be anticipated in healthy individuals.10 In contrast, LC-MS based analytical methods can readily achieve a broad dynamic range, are specific and sensitive with fast method development times. In this work, accurate quantification of albumin was achieved using the bottom up approach via enzymatic digestion with trypsin and LC-MS analysis of resulting peptides.

Mass spectrometry

LC-MS/MS quantification of albumin signature peptides was performed using a Xevo TQ-XS Triple Quadrupole MS. The full amino acid sequence11 and structure of HSA12 are shown in Figures 1 and 2, respectively. A total of 11 HSA tryptic peptides (highlighted in blue, Figure 2), and 2 MRM transitions per peptide, were monitored for quantification. These peptides were chosen based on literature3 and were optimized for their signal intensity and selectivity. MS conditions for the HSA tryptic peptides are listed in Table 1. Of the 11 peptides, 4 were used for primary quantification: YLYEIAR, FQNALLVR, LVNEVTEFAK, and VFDEFKPLVEEPQNLIK (highlighted and bolded in blue, Table 1 and Figure 2).

Figure 1. Human serum albumin structure (HSA).
Figure 2. Amino acid sequence of human HSA; Tryptic peptides used for quantification are highlighted in blue.
Table 1. Final MS conditions for HSA tryptic peptides, including precursor and fragment ions; Primary tryptic peptides used for quantification are highlighted in blue.

Chromatography

Chromatographic separation of the HSA tryptic peptides was achieved using an ACQUITY UPLC Peptide BEH C18, 300 Å, 1.7 µm, 2.1 x 150 mm Column. Figure 3 highlights the chromatographic separation for the 11 HSA peptides monitored. Peak widths for all peptides were <4.5 seconds wide. The 4 primary albumin peptides used for quantification (YLYEIAR, FQNALLVR, LVNEVTEFAK, and VFDEFKPLVEEPQNLIK) are highlighted in blue. 

Figure 3. UPLC chromatographic separation of albumin tryptic peptides, digested in human urine (50 µg/mL) using an ACQUITY UPLC Peptide BEH C18, 1.7 µm, 2.1 x 150 mm Column. 

Sample Preparation

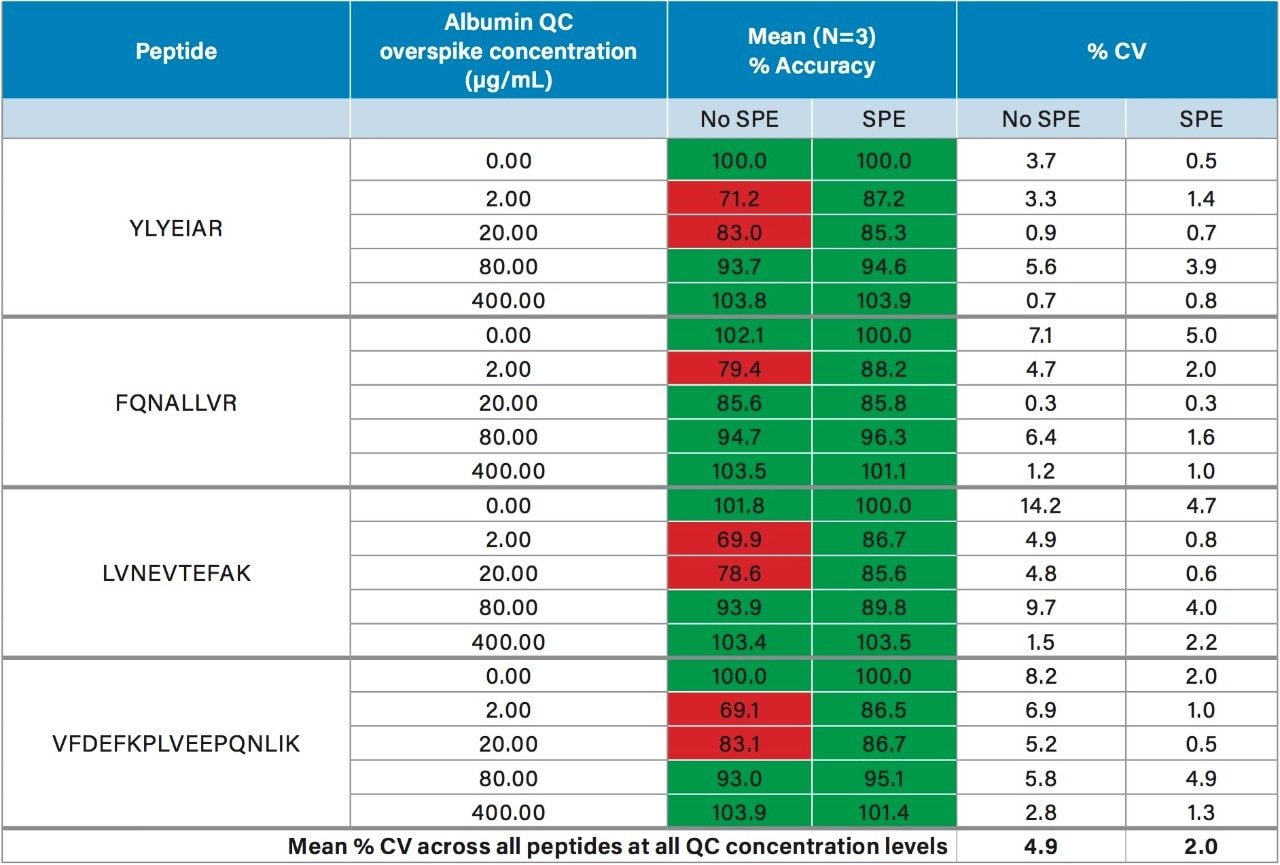
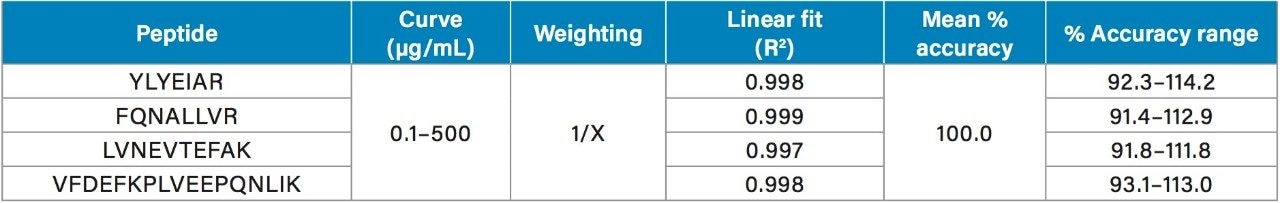
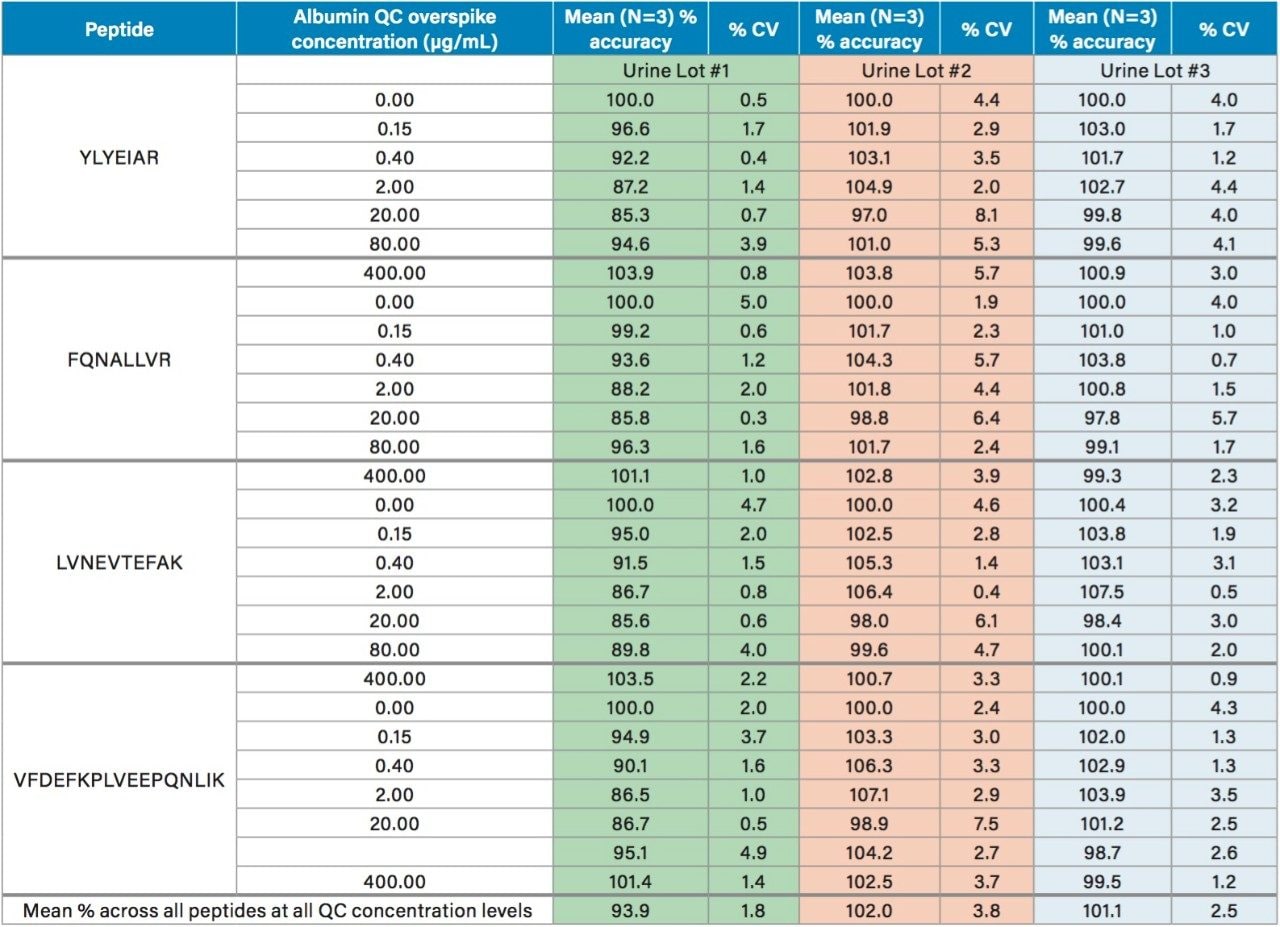
In this work, we used the ProteinWorks eXpress Digest Kit to simplify the quantification of urinary albumin using only 15 µL of sample, and a direct 2-hour digestion (no affinity purification necessary). Specifically, the 5-Step digestion protocol provided with the kit was used. This protocol employs reduction and alkylation to aid in the unfolding of the albumin protein prior to digestion, facilitating efficient enzymatic cleavage. Subsequent purification of the albumin tryptic peptides was achieved with the ProteinWorks µElution SPE Clean-Up Kit, and supplied protocol. This kit contains the mixed-mode sorbent, Oasis MCX, to improve selectivity and analytical sensitivity, effectively removing buffer salts, phospholipids, and excess digestion reagents post digestion, while also concentrating the sample. During method development, quantification of urinary albumin was assessed with and without peptide purification by SPE. While eliminating the SPE step still enabled accurate quantification for the calibration standards (meeting recommended LC-MS method development criteria for linearity, accuracy, and precision13), acceptable accuracy of all QC levels across the various lots of human urine tested could not be achieved without SPE. Comparison of the mean accuracy and precision (%CVs) in urine Lot #1, with and without SPE is highlighted in Table 2. For QC samples prepared without SPE, accuracies across the 4 primary peptides used for quantification failed to achieve the recommended criteria of 85–115% across all concentration levels. Employing a mixed-mode SPE clean-up step significantly improved accuracy and precision of the QCs across all lots of urine tested, easily meeting recommended LC-MS method development criteria. Furthermore, average %CV without SPE was 4.9%, this was improved to 2.0% with SPE. Additionally, the µElution format allowed elution in only 50 µL, providing a 2-fold concentration of the sample, thus further improving detection limits. Traditional protein quantification workflows which employ the bottom up technique are complex and time consuming, often taking >18 hours to complete. Use of the ProteinWorks digestion and SPE kits yielded a total sample preparation time of <4 hours, which allows for same day LC-MS analysis.

Table 2. Representative comparison of QC sample statistics, with and without SPE peptide level clean-up for the four primary tryptic peptides used to quantify albumin in Urine Lot #1.

Linearity, precision, and accuracy

Using the 4 primary HSA peptides for quantification (YLYEIAR, FQNALLVR, LVNEVTEFAK, and VFDEFKPLVEEPQNLIK),  detection limits of 0.1 µg/mL were readily achieved. Calibration curves for these peptides were linear with R2 values >0.99 using 1/x weighted regression. A summary of standard curve performance is shown in Table 3. Standard curves were linear over 3.5 orders of magnitude from 0.1–500 µg/mL, with mean accuracies ranging from 91.4–114.2%. In addition QC accuracy and precision performance was excellent with single digit %CVs and accuracy between 85–115%. Representative QC performance for urine lot #2, using the 4 primary quantitative HSA peptides, is highlighted in Table 4. For urine lot #2, CVs were <8.1% (average <4.0%) with accuracy ranges of 97.0–107.1%. Across all 3 urine lots, and the 4 HSA peptides, CV ranges were between 0.3–8.1% (average <4%) with QC accuracy ranges between 85.3–107.5% (Table 5). Demonstration of QC chromatographic performance for the YLYEIAR, FQNALLVR, LVNEVTEFAK, and VFDEFKPLVEEPQNLIK HSA peptides is illustrated in Figure 4, Panels A–D, respectively. 

Table 3. Linear dynamic range and standard curve statistics for the four primary albumin tryptic peptides: YLYEIAR, FQNALLVR, LVNEVTEFAK, and VFDEFKPLVEEPQNLIK used for quantification. Urine samples were digested and extracted using ProteinWorks eXpress Digest and µElution SPE Clean-Up Kits. 
Table 4. Representative QC samples for the four primary tryptic peptides used to quantify albumin in human Urine Lot #2 . 
Table 5. Summary of the QC sample statistics (precision and accuracy) in Urine Lots #1–3 for the four primary tryptic peptides used to quantify albumin.
Figure 4. Representative QC chromatograms for the four primary HSA peptides: YLYEIAR (A),FQNALLVR (B), LVNEVTEFAK (C), and VFDEFKPLVEEPQNLIK (D) used to quantify albumin in human urine. 

Endogenous urinary albumin concentrations were accurately quantified in three individual lots of urine and are summarized in Table 6. Across all 3 urine lots, and the 4 HSA peptides, single digit precision (CVs <4.0%) was achieved. Within each lot, the calculated endogenous urinary albumin concentrations derived from the YLYEIAR, FQNALLVR, LVNEVTEFAK, and VFDEFKPLVEEPQNLIK tryptic peptides were in good agreement. To assess the utility of the other 7 HSA peptides for quantification, a semi-quantitative (confirmatory) approach was employed, as stable isotopically labeled (13C15N) versions of these peptides were not used as internal standards. For this assessment, the 13C15N LVNEVTEFAK peptide was used as the internal standard. Standard curves for the remaining peptides were >0.98 with accuracies between 85–115% (data not shown). Calculated endogenous urinary albumin levels using all 11 HSA peptides, in all urine lots, are shown in Table 7. With the exception of the LVAASQAALGL peptide, the concentrations calculated from across the HSA peptides were in good agreement. Endogenous HSA concentrations calculated from the LVAASQAALGL peptide (highlighted in red) tended to be higher in all 3 urine lots, and this peptide was determined to be a statistical outlier. Difficulty in quantifying with this peptide was also reported by Beasley-Green, et al.3 In this instance, it was suggested that there was a correlation between digestion efficiency and peak area ratio. Specifically for the LVAASQAAGL peptide, which has two lysine residues that precede it, a miscleavage could result, leading to inaccurate quantification of albumin.

Table 6. Calculated endogenous urinary albumin concentrations in 3 lots of human urine using the YLYEIAR, FQNALLVR, LVNEVTEFAK, and VFDEFKPLVEEPQNLIK tryptic peptides of HSA.
* Statistically significant outlier, excluded from average albumin content calculation.
Table 7. Calculated endogenous urinary albumin levels using all 11 HSA tryptic peptides in 3 lots of human urine.

Conclusion

Endogenous urinary albumin was reliably quantified down to 0.1 µg/mL using commercially available digestion and purification kits. Through direct digestion (no affinity purification) of 15 µL of urine and subsequent peptide purification using the generic protocols provided in the kits, a quantification range of 0.1–500 µg/mL was achieved, with excellent linearity, precision and accuracy. Total sample preparation time, including SPE, was <4 hours for 96 samples. Developed for clinical research, the analytical method described here is 9X faster with 50X greater analytical sensitivity than previously published LC-MS methods.3 The broad dynamic range (3.5 orders) and selectivity of this LC-MS method reliably quantifies both low endogenous and elevated urine levels that would be expected in normal and disease populations while approaching the analytical sensitivity of immunoassays.

References

  1. Fanali G, diMasi A, Trezza V, Marino M, Fasano M, Ascenzi P, Human serum albumin: from bench to bedside, Molecular Aspects of Medicine. 2012;33: 209–290.
  2. Tesch GH, Review: Serum and urine biomarkers of kidney disease: A pathophysiological perspecitive. Neprhology. 2010; 15: 609–616.
  3. Beasley-Green A, Burris NM, Bunk DM, Phinney KW, Multiplexed LC-MS/MS Assay for Urine Albumin. J. Proteome Res. 2014; 13: 3930–3939.
  4. deJong PE, Gansevoort RT, Bakker SJ, Macroalbuminuria and microalbuminuria: Do both predict renal and cardiovascular events with similar strength? Nephrol. 2007; 20:375–380.
  5. Polkinghorne KR, Detection and measurement of urinary protein. Curr. Opin Nephrol. Hypertens. 2006;15: 625–630.
  6. Choi S, Choi EY, Kim HS, Oh SW, On-site quantification of human urine albumin by a fluorescence immunoassay. Clin Chem. 2004; 50:1052–1055.
  7. Seegmiller, JC, Sviridov D, Larson TS, Borland TM, Hortin GL, Liske JC, Comparison of urine albumin quantification by immunoturbidimetry, competitive immunoassay, and protein-cleavage liquid chromatography-tandem mass spectrometry. Clin. Chem. 2009; 55:1991–1994.
  8. Cell Biolabs, Inc. (San Diego, CA) Human Albumin ELISA Kit (STA-383) Product manual
  9. Tojo A, Kinugasa S, Mechanisms of Glomerular Albumin Filtration and Tubular Reabsorption, International Journal of Nephrology. 2012; 2012; 9 pages.
  10. Miller W G, Bruns DE, Hortin G L, Sandberg, S et. al., Current issues in measurement and reporting of urine albumin excretion. Clin. Chem. 2009; 55; 24–38.
  11. UniPro (16May2014). UniProtKB – P02768 (ALBU_Human). Primary accession number: P02768 accessed 27Feb2017 from http://www.uniprot.org/uniprot/P02768.
  12. Human Serum Albumin Structure. Accessed 27Feb2017 from http://www.sciencephoto.com/media/507795/view.
  13. FDA Guidance for Industry for Bioanalytical Method Validation, CDER.

720006034, May 2017

Torna all'inizio Torna all'inizio