Globally, the popularity of nutraceutical and functional food products continues to increase. Functional food/natural product remedies are found in foods, roots, and herbs. Legislative focus has prompted the development of more methods to analyze active compounds in such products.
The screening assay presented here explores the use of UPLC separations (ACQUITY UPLC I-Class) with ion mobility mass spectrometry (SYNAPT G2-Si) and UNIFI data processing software as an analytical approach for the characterization of the distribution and content of mono-, di-, and tetra-glycosides in the raw material or processed products. In this case, the aim is to illustrate how the quality and potency of ginseng products can be determined.
The most abundant forms of ginseng: Panax (Korean ginseng), P. japanoicus , and P. quinquefolium (American ginseng) grow in North America. The Korean and American ginseng species are most frequently used for medicinal purposes. For thousands of years, the roots of ginseng plants have been used for therapeutic purposes. However the species are believed to have different therapeutic properties. Ligor et. al. discussed CNS stimulant activity, hypogylcemic properties, and the sedative effects of American ginseng.1 For each species it is believed that the ginsenoside and polysaccharide content are responsible for the biological activity of products produced from the roots and leaves of ginseng species. Figure 1 shows the structures of the ginsenosides screened in this assay, which are a part of a diverse group of steroidal saponins with four ring structures similar to steroids.
LC system: |
ACQUITY UPLC I-Class |
Column: |
ACQUITY UPLC HSS T3, 100 mm x 2.1 mm, 1.8 μm |
Column temp.: |
40 °C |
Flow rate: |
0.6 mL/min |
Mobile phase A: |
H2O (0.1% formic acid) |
Mobile phase B: |
Acetonitrile (0.1% formic acid) |
Injection volume: |
1 μL |
Time (min) |
Flow rate |
%A |
%B |
---|---|---|---|
0.00 |
0.6 |
95.0 |
5.0 |
3.00 |
0.6 |
70.0 |
30.0 |
4.00 |
0.6 |
70.0 |
30.0 |
12.00 |
0.6 |
55.0 |
45.0 |
18.00 |
0.6 |
5.0 |
95.0 |
20.00 |
0.6 |
95.0 |
5.0 |
MS system: |
SYNAPT G2-Si |
Ionization mode: |
ESI- at 2.7 kV |
Sample cone voltage: |
20 V |
Desolvation temp.: |
600 °C |
Lockmass and LockCCS: |
Leucine enkephalin, [M-H]- =554.2620 |
Acquisition range: |
50 to 1200 m/z |
Acquisition rate: |
10 spectra/sec |
Collision energy ramp: |
35 to 75 eV |
|
Resolution = 20,000 FWHM (Res mode) |
IMS T-Wave velocity ramp: |
Start: 1000 m/s |
|
End: 300 m/s |
IMS T-Wave pulse height: |
40V |
IMS gas flow: |
90 mL |
Korean ginseng tea (extract in 20 mL of H2O), gingko biloba, red panax (undiluted), red panax (undiluted), extracts and ginsenoside standards (100 pg/μL).
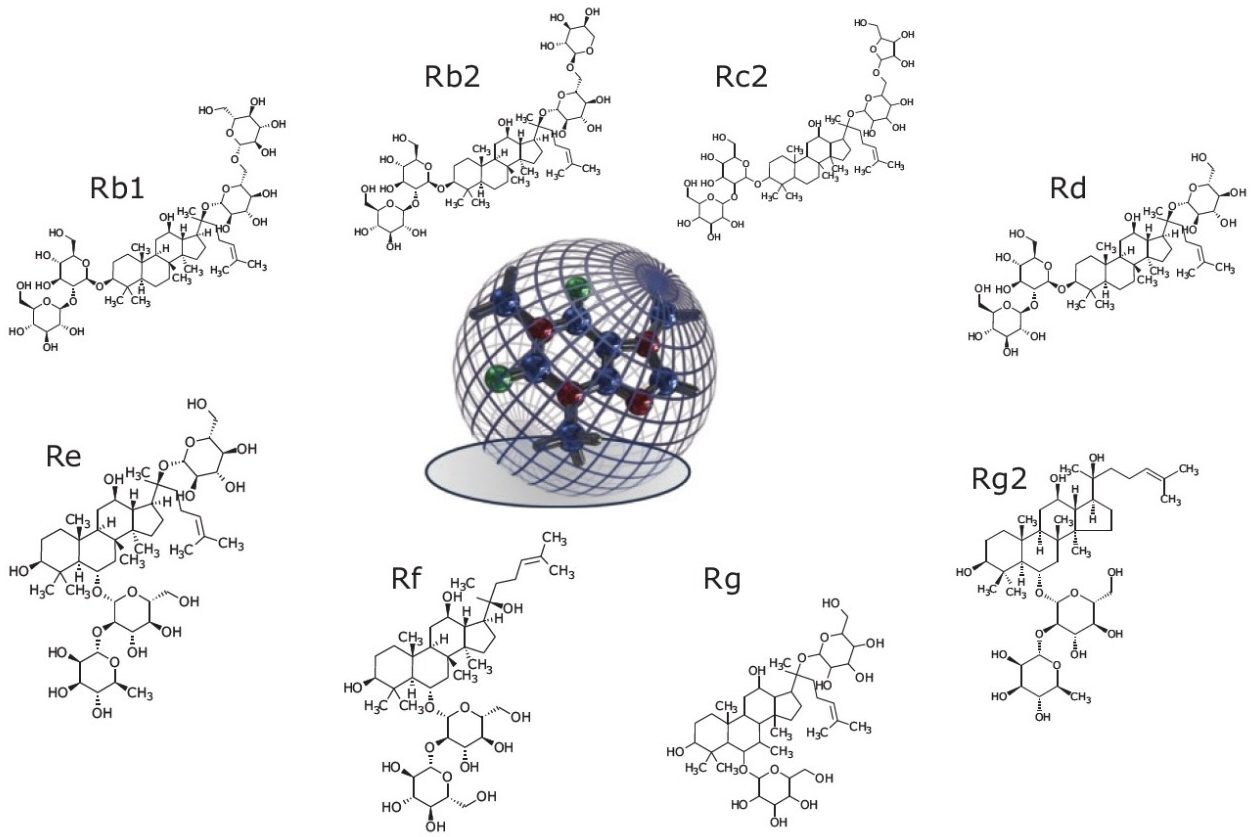
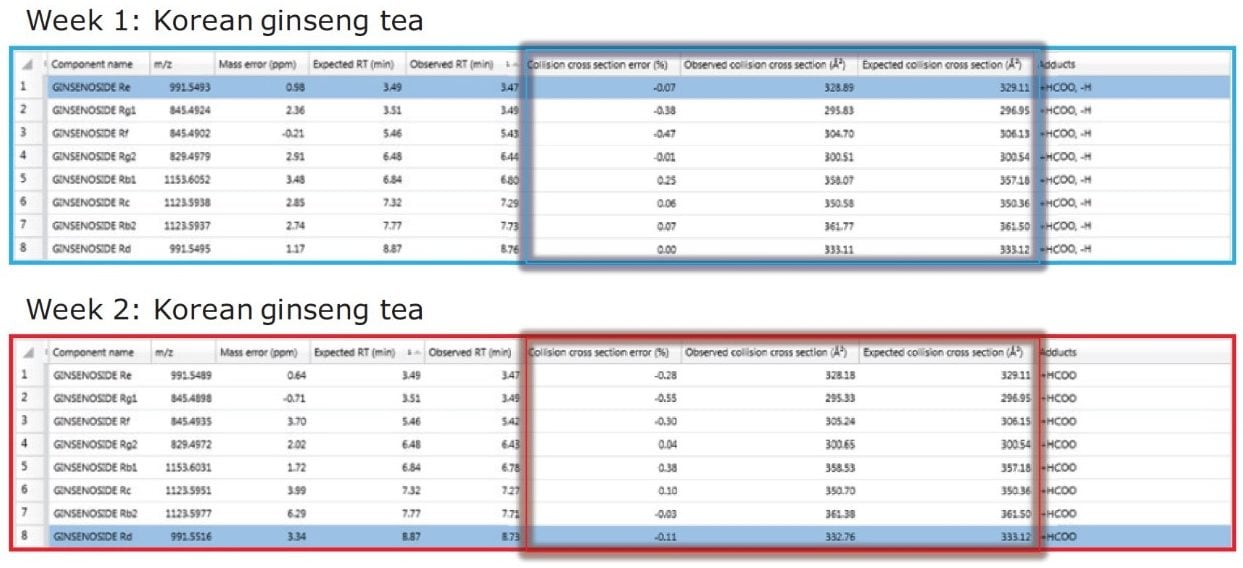
The profiles of ginsenosides in American and Korean ginseng are believed to be different. Ginsenosides are comprised of two main groups: the panaxadiol, or Rb1 group that includes Rb1, Rb2, Rc, Rd, Rg3, Rh2, and Rh3; and the panaxatriol (Rg1 group) that includes Rg1, Re, Rf, Rg2, and Rh1. American ginseng is understood to be richer in the Rb1 group, while Korean ginseng is believed to be richer in the Rg1 group. In addition to the natural differences in the phytochemical profile of the species, the phytochemical profile can also be impacted by the time of harvest, storage conditions, and production processes.
Globally the popularity of nutraceutical and functional food products continues to increase. Functional food/natural product remedies are found in foods, roots, and herbs. Legislative focus has prompted the development of more methods to analyze active compounds in such products. For example in Europe, Directive 2004/24/EC came into full effect on 30 April 2011. Hundreds of traditional herbal remedies were banned, as the EU law aims to protect consumers from possible damaging side-effects of over-the-counter herbal products. More recent regulations allow only long-established and quality-controlled medicines to be sold. Products that have been assessed by the Medicine and Healthcare Products Regulatory Agency (MHRA) may also be sold. Manufacturers have to prove that their products have been made to strict standards and contain a consistent and clearly marked dose.
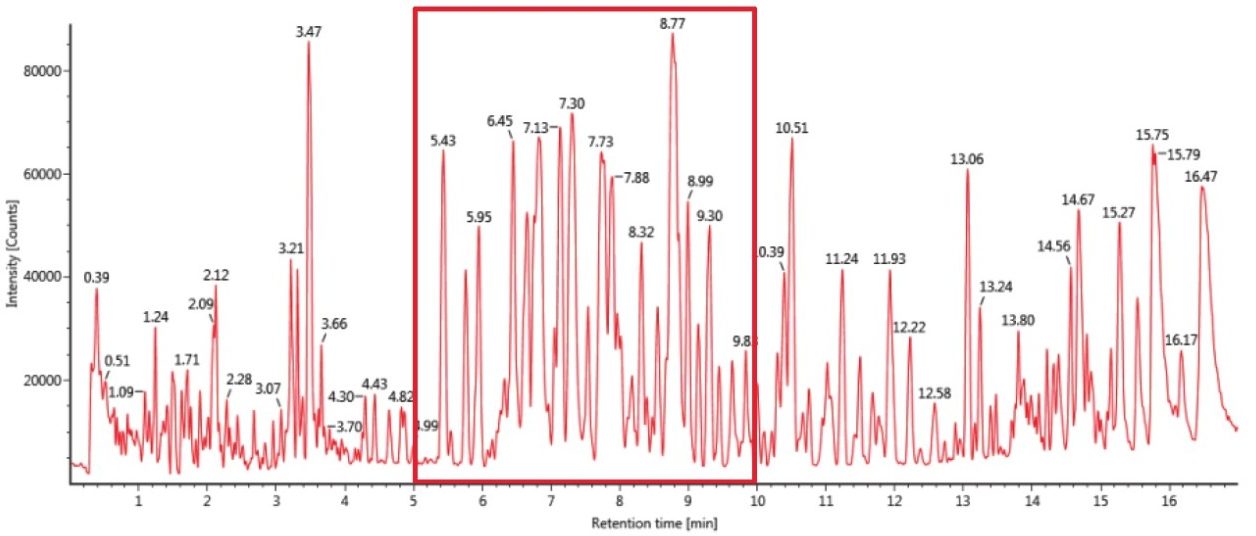
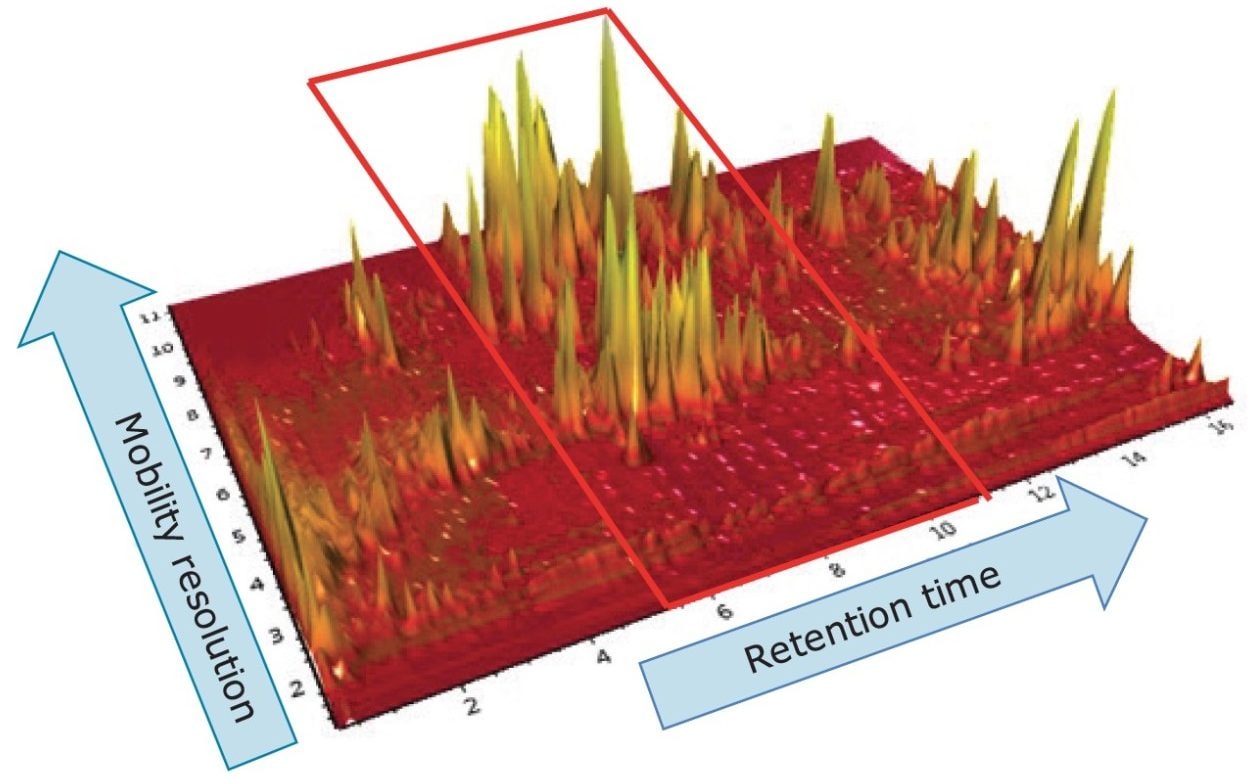
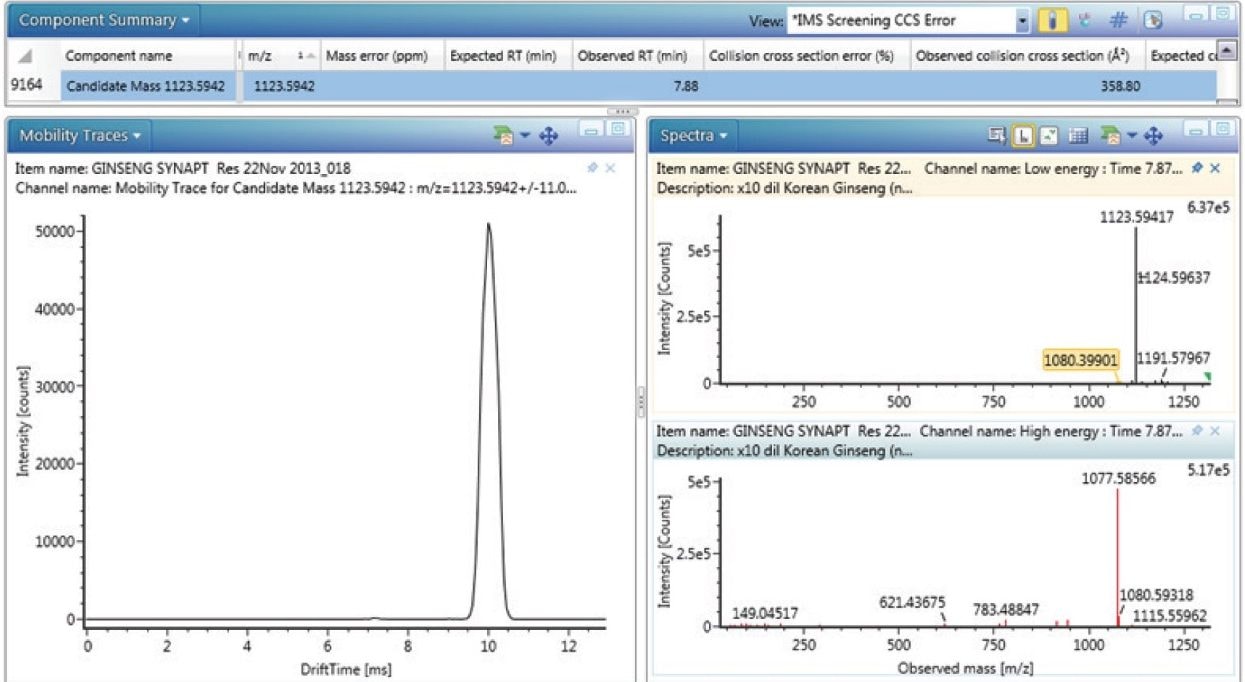
The ACQUITY UPLC I-Class System and ion mobility mass spectrometry (IM-MS) is a combination of accurate separations with high resolution mass spectrometry (HRMS) and high efficiency ion mobility based measurements that offer some unique advantages for profiling complex mixtures. IM-MS is a rapid orthogonal gas phase separation phase technique that allows another dimension of separation to be obtained within an LC timeframe. Compounds can be differentiated based on size, shape, and charge.2 The screening assay presented here explores the use of UPLC separations with ion mobility mass spectrometry and UNIFI data processing software as an analytical approach for the characterization of the distribution and content of mono- di- and tetra-glycosides in the raw material or processed products. In this case, the aim is to illustrate how the quality and potency of ginseng products can be determined.
A collision cross section (CCS) value is a robust and precise physicochemical property of an ion. It is an important distinguishing characteristic that is related to its chemical structure and three-dimensional conformation. An illustration is presented in Figure 1, where the shadow of a rotating three dimensional ion is shown. This represents the average collision cross section. Non targeted UPLC-IM-MS has been used to generate travelling wave collision cross sections using a nitrogen buffer gas (TWCCSN2), accurate mass precursor/fragment ions, and retention times to profile ginsenoside standards Rb1, (Rb2, Rc), (Rd, Re), (Rf, Rg1), and Rg2. Using TWCCSN2 measurements can increase non targeted screening specificity. CCS measurements generated have been entered into a scientific library within UNIFI. This allows the expected and determined TWCCSN2 values to be used to screen and confirm the presence of ginsenoside isomer markers. Three extracts, gingko biloba+red panax, red panaz, and Korean ginseng tea were analyzed. These were screened against the created ginsenoside TWCCSN2 library in UNIFI to determine the presence/unequivocal identification of ginsenoside isomers.
Here we present TWCCSN2 values (derived from ion mobility drift times) as a new identification parameter that can distinguish ginsenoside isomers, and also be used to profile unknowns. From Figure 2, the UPLC-IM-MS electrospray negative mode conventional base peak ion chromatogram obtained for the analysis of undiluted Korean ginseng extract is shown, and the complexity of the sample profiled is revealed. However in Figure 3, the UPLC-IM-MS electrospray negative mode plot of drift time (ion mobility resolution) versus retention time for the Korean ginseng tea extract is presented. Using the unique functionality of UNIFI Software, Figure 3 visually illustrates how ion mobility separation orthogonal to chromatographic separation, can increase peak capacity.
The retention time region between 6 and 10 minutes shows that there are a large number of compounds that are now resolved compared to the same region on the conventional base peak ion extracted mass chromatogram of Figure 2. The true complexity of the sample profiled is illustrated, when ion mobility resolution and UPLC chromatographic resolution are combined. The ion mobility Data Viewer within UNIFI enables investigative interaction with the acquired ion mobility data. UNIFI includes many easy-to-use functions, such as Zoom to Component and Bookmark, that allow the same investigative interrogation of data across many acquisitions. It is possible to select any one of these components and generate the drift plot, mass spectrum, and extracted mass chromatogram.
For marker ginsenoside isomer pairs Rb2 and Rc (Figure 4), the extracted mass chromatogram (m/z 1123) shows that the ginsenoside marker isomer Rc has a measured TWCCSN2 =350.58.77Å2 and Rb2 has a measured TWCCSN2 =361.77Å2. CCS errors <0.5% were obtained and compared to the expected CCS values that were previously generated from the ginsenoside standards and uploaded into the UNIFI scientific library. The extracted mass chromatogram shows the presence of a series of minor isomeric components between 3.0 and 4.0 mins, 8.0 and 9.0 mins, as well as an unknown isomer at retention time 7.88 min, from which a TWCCSN2 value of 358.80.77Å2 has been determined. Regardless of the chromatographic methodology used, it it now possible to distinguish the ginsenoside isomer and the unknown isomer using TWCCSN2 measurements. This could not be acheived with accurate mass measurement alone, regardless of the mass resolution capability. It is also worth noting that these acquisitions are non targeted; hence the TWCCSN2 values are generated for all knowns and unknowns. This could not be achieved with other available ion mobility technologies, such as Field Asymmetric Ion Mobility Spectrometry (FAIMS), where a knowledge of the targeted analytes is required, and it is limited to just a few target compounds, compared to unlimited number of possible TWCCSN2 measurements.
In addition to CCS measurements serving as an additional identification point, the combined peak capacity of UPLC and ion mobility brings additional benefits. This can be seen in Figure 5 where the retention time (7.73 mins) and drift time (9.93 ms), aligned precursor, and fragmentation spectra for Rc ginsenoside marker isomer is shown. The spectra presented result from only the Rc ginsenoside, because chromatographically coeluting compounds are resolved using ion mobility. The ion mobility spectral cleanup makes it clear that the unknown isomer at 7.88 mins also has the same characteristic fragment ions as ginsenoside Rc, but it can be differentiated using ion mobility. The characteristic information acquired and processed for the unknown isomer is shown in the UNIFI Component Summary in Figure 6. Illustrated are the candidate Component Summary, mobility trace, and precursor/mobility product ion spectra for the unknown isomer with TWCCSN2=358.80Å2 at retention time 7.88 mins. The TWCCSN2 for the unknown isomer can be entered into the UNIFI scientific library, along with the TWCCSN2 values generated for all of the compounds detected during the chromatographic run.
CCS measurements can increase confidence in identification. The results are summarized in Figure 7, where the results obtained for profiling of Korean ginseng over two consecutive weeks is presented. For the marker ginsenoside isomer pairs (Rb2, Rc), TWCCSN2 measurements of 361.77 Å2/350.58Å2 have been determined. For (Rd, Re), 328.89 Å2/333.11 Å2 were determined. For (Rf, Rg1), 304.7 Å2/295.83 Å2 were obtained in week 1. In week two, comparative results were obtained. When comparing the expected against the measured TWCCSN2 results determined (for the eight ginsenosides profiled in the extracts), the measurement errors were typically <0.5%. It is therefore possible to distinguish the marker isomer pairs of ginsenosides in the extracts of the specified products analysed with confidence using TWCCSN2 measurements.
This approach offers a unique selectivity for profiling complex mixtures. The results obtained clearly show the benefits of using CCS measurements and the combined peak capacity of UPLC with ion mobility. Coeluting analytes and isomers have been resolved as well as unequivocally identified in the three extracts profiled. In addition it is possible to acquire the cleaned up mobility specific product ion spectra, which are ion mobility resolved from coeluting components. In this case the reason for such a screening approach is to generate a new analysis to enable the characterization/distribution and content of mono- di- and tetra-glycosides in the raw material or processed functional food/nutraceutical products. The new assay approach would add confidence when assessing quality, potency, and consistency of a final product, incorporating ingredients such as gingko biloba, Korean ginseng and red panax. This new analytical approach changes the scope of authentication profiling.
While gaining confidence in the identifications made from the use of accurate mass measurement and CCS measurements, there is also a clear potential to reduce the amount of high purity standards required, where confirmation relies on retention time and accurate mass measurement. The costs of the standards for this assay, shown in Table 1, totalled £2483.00, a significant expense. The use of a CCS screening approach has the potential to provide significant cost savings across many application areas. For further studies to profile ginsenosides, Rb1, (Rb2, Rc), (Rd, Re), (Rf, Rg1), and Rg2, the consumption and costs of high purity standards has been significantly reduced within the laboratory where the study was performed.
720005422, June 2015