• Nota applicativa

Determination of Protein Binding by UPLC-MS/MS

Determination of Protein Binding by UPLC-MS/MS

  • Darcy Shave
  • Peter G. Alden
  • Waters Corporation

Abstract

In this application note, plasma protein binding was determined which helps in characterizing a drug’s behavior and proper dosing in the discovery process.

Benefits

Using ProfileLynx and QuanOptimize Application Managers provided:

  • Automated MS method development and data acquisition
  • Single approach for data processing and report generation from multiple assays
  • Complete automated analysis, processing, and reporting
  • Increased laboratory throughput

Introduction

Plasma protein binding (PPB) can significantly affect the therapeutic action of a drug. PPB determines the extent and duration of action, as only unbound drug is thought to be available for passive diffusion to extravascular or tissue sites where therapeutic effects occur.

Since data show an increasing importance of PPB in characterizing a drug’s behavior and proper dosing, PPB measurement needs to be made as early as possible in the discovery process. In vivo dose levels can be estimated from the determined fraction of unbound drug (fu); a drug that demonstrates high plasma protein binding indicates that an increase in dose might be necessary.

The classical method used to measure the level of protein binding is equilibrium dialysis. In equilibrium dialysis, a dialysis membrane with small pores allows molecules to diffuse through it. Once equilibrium has been reached, one can measure the amount of free analyte in the donor and receptor samples, and then determine the amount of bound analyte.

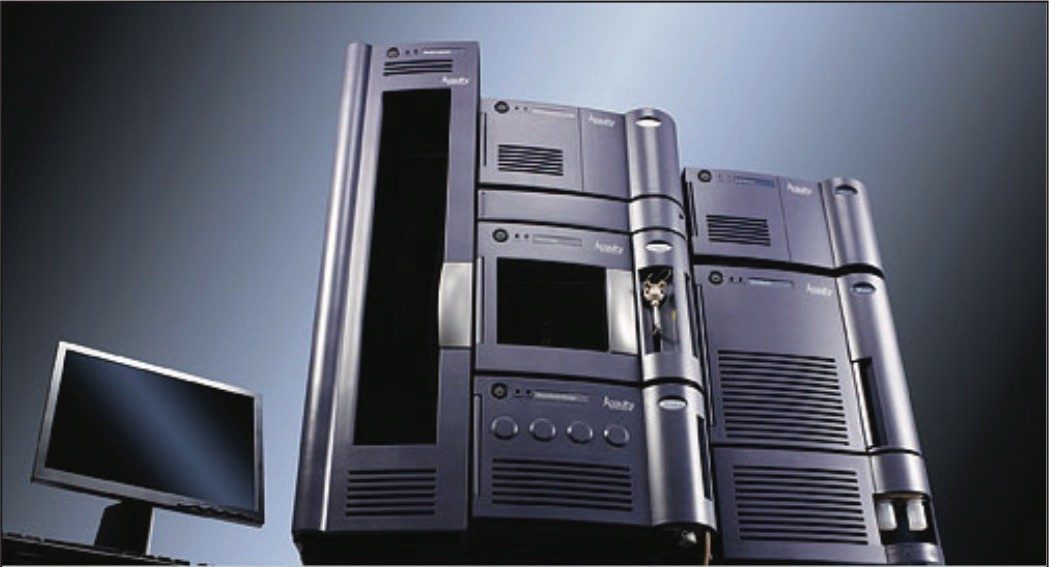
This process is laborious and time-consuming with the need to perform additional analytical steps, including radiolabeling. Given the detection speed and sensitivity of UPLC-MS/MS, the ACQUITY TQD System (Figure 1), used with specialized software, ProfileLynx and QuanOptimize Application Managers, is the ideal choice for analysis of PPB.

Figure 1. ACQUITY TQD System.

Experimental

A set of 22 commercially available drug compounds were randomly chosen to demonstrate the ProfileLynx Application Manager.

Rat samples were prepared at 5 μM in rat plasma. 500 μL of each sample was placed into the donor wells of the RED Device Inserts (Pierce) in the base plate. 750 μL of dialysis buffer was placed in each receptor well. The plate was gently shaken for 4 hours at 37 °C. 100 μL of plasma and 100 μL of phosphate buffer saline were added to each well of a 2 mL 96-well plate. For each compound, 100 μL of incubated donor and 100 μL of incubated receptor were added to separate wells. 700 μL of 90:10 acetonitrile/water was added to each well. The plate was shaken for 30 minutes, and then centrifuged for 20 minutes at 3000 RPM. The same process was repeated for human plasma.

These samples were analyzed by UPLC-MS/MS. The QuanOptimize Application Manager was used to automate the optimization of the MS multiple reaction monitoring (MRM) conditions for each compound.

LC Conditions

LC system:

ACQUITY TQD System

Column:

ACQUITY UPLC BEH C18 Column 2.1 x 50 mm, 1.7 μm

Column temp.:

40 °C

Flow rate:

600 μL/min

Mobile phase A:

0.1% Formic acid in water

Mobile phase B:

0.1% Formic acid in acetonitrile

Gradient:

5 to 95% B/1.3 min

MS Conditions

MS system:

TQ Detector

Ionization mode:

ESI positive

Capillary voltage:

3200 V

Source temp.:

150 °C

Desolvation temp.:

450 °C

Desolvation gas:

900 L/hr

Cone gas flow:

50 L/hr

Inter-scan delay:

20 ms

Inter-channel delay:

5 ms

Dwell:

200 ms

Acquisition range:

100 to 1000 m/z

Results and Discussion

Protein binding is calculated from the amount of a compound bound to protein substrate in a well, and is determined from the start and finish concentrations in a specified plate or plates. This is achieved by determining the ratio of the peak area of the analyte (receptor plate) to the peak area of the standard (donor plate). Compounds are designated as a standard or an analyte in the SampleType column. The standard and analyte are linked in the sample list with the Compound A column.

In the ProfileLynx browser, PPB is reported as a ratio of the peak area of the standard. Any PPB values outside of a specified minimum and maximum range were automatically flagged. For this experiment, the minimum was set at 50 and the maximum at 100. The interactive browser also allowed for the editing of peak integration. Peak assignments were easily changed and peak integrations were quickly optimized. Results were then exported in a format amenable to the corporate database.

The example in Figure 2 demonstrates how protein binding results are displayed for Verapamil. The result column labeled PB(WELL) contains the fraction of free (unbound) compound. The percent of the bound compound is calculated by (1-PB(WELL))* 100%. The results for the entire set of compounds indicate a lower protein binding for compounds in human plasma than for the same compounds in rat plasma. Overall, the protein binding results are highly reproducible from injection to injection.

Figure 2. ProfileLynx browser showing protein binding results for Verapamil.

Table 1 lists the average experimental values for protein binding of the sample compounds in rat plasma, and the literature values for protein binding of these compounds (www.DrugBank.ca). Experimental values agree closely for the majority of the compounds analyzed, particularly for compounds with a high degree of binding.

Table 1. Protein binding results in rat plasma.

Table 2 lists the average experimental values for protein binding of the sample compounds in human plasma and the literature values for protein binding of these compounds (www.DrugBank.ca). Experimental protein binding data from rat plasma is not quite as close to literature values as those from rat plasma, but are still in the same general range.

Table 2. Protein binding results in human plasma.

The protein binding results for all compounds in both rat plasma and human plasma are displayed in Figure 3. Data show good correlation between experimental data and published values.

Figure 3. Comparison of experimental rat and human plasma binding values versus published binding values.

Conclusion

The 22 compounds were analyzed with an LC-MS/MS protocol including MS MRM parameter optimization, MS acquisition method creation, data acquisition, data processing, and report generation. The data generated from the variety of assays were all processed with the same software automatically. A single report created for 18 compounds contained the partitioning results, enabling the researcher to analyze results quickly thus increasing laboratory throughput. Results were displayed in an interactive, graphical summary format based on sample or experiment.

Equilibrium dialysis separates molecules across a semi-permeable membrane according to molecular size (weight) by utilizing the driving force of concentration differential between solutions on each side of the membrane. Traditionally, this method suffers from long analysis times because of the need to radiolabel each compound and to perform an additional analytical step (such as GC or LC) to determine the actual final free drug concentration.

With instrument run time taking only 3.5 hours and data analysis only minutes, using the UPLC-MS/MS system with ProfileLynx significantly reduced the amount of time required to determine protein binding.

Using ProfileLynx and QuanOptimize Application Managers provided:

  • Automated MS method development and data acquisition
  • Single approach for data processing and report generation from multiple assays
  • Complete automated analysis, processing, and reporting
  • Increased laboratory throughput

720002610, May 2008

Torna all'inizio Torna all'inizio