For research use only. Not for use in diagnostic procedures.
In this application note, we will implement a UPLC-MS (Tof)-based metabonomics strategy to probe the regional differences of roasted coffee beans.
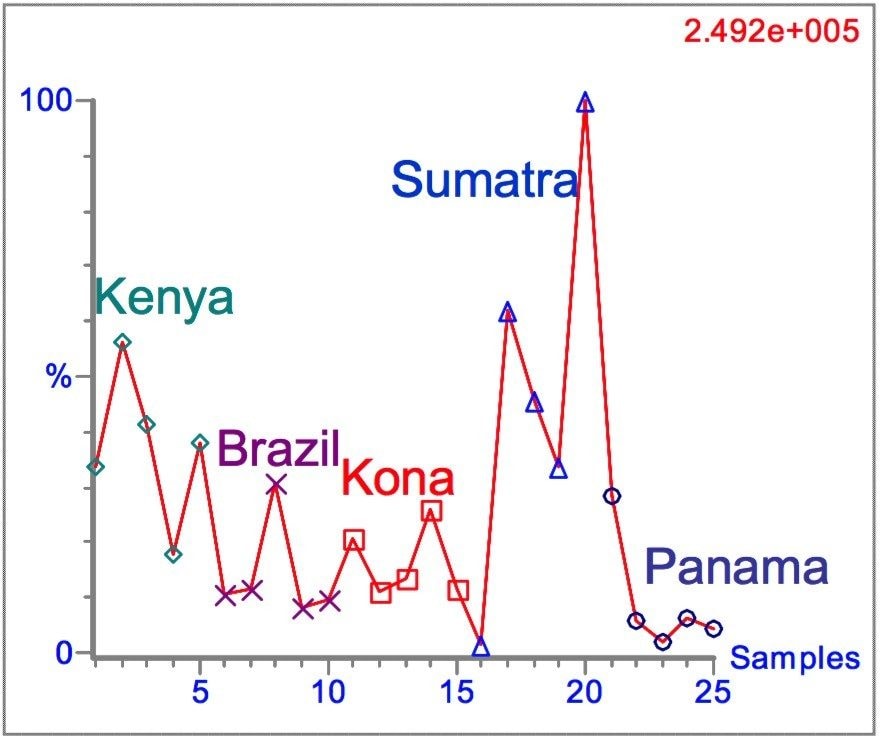
The science of metabonomics has evolved into a useful strategy to facilitate the differentiation of small molecule profiles in complicated biological matrices such as plasma and urine. This methodology consists of four basic steps: 1) an information-rich analysis, such as LC-MS (Tof), 2) data reduction and alignment to convert acquired spectra into a “statistics-friendly”format, 3) multivariate statistical analysis (e.g., principal components analysis (PCA) or partial least squares (PLS)), and 4) user review and interpretation of chemometric results. However, the utility of this approach is not limited to the biological arena. In fact, the pattern recognition algorithms that are at the heart of metabonomics can be applied to several areas including industrial batch syntheses, cosmetics and food sciences. Additionally, the superior chromatographic and mass spectrometric resolution and sensitivity achievable with UltraPerformance LC (UPLC) coupled with the Waters Micromass LCT Premier orthogonal time-of-flight Mass Spectrometer ensures that the maximum amount of information contained in a sample is extracted. In this example, we will implement a UPLC-MS (Tof) based metabonomics strategy to probe the regional differences of roasted coffee beans.
Coffee beans from five geographic regions (Africa, Indonesia, and Central, South and North America) were selected for analysis. Five beans from each region were individually extracted with acetonitrile for twelve hours. The resulting extracts were diluted 1:4 with deionized water prior to analysis by UPLC-MS (Tof).
LC system: |
Waters ACQUITY UPLC System |
|
Column: |
2.1 x 100 mm, 1.7 μm ACQUITY UPLC BEH C18 Column |
|
Flow rate: |
0.600 mL/min. (split to ~0.150 mL/min. into mass spectrometer) |
|
Gradient: |
50–95% B in 30 min., where A:0.1% formic acid in water; B: 0.1% formic acid in acetonitrile) |
|
Injection volume: |
10 μL |
MS system: |
Waters Micromass LCT Premier Mass Spectrometer |
Ionization mode: |
Positive ion Acquisition Range: 100–950 m/z with Woptics resolution |
Cone voltage: |
60 V |
Capillary voltage: |
3000 V |
Scan time: |
0.3 s |
Scan time: |
0.05 s |
LockSpray: |
Leucine Enkephalin 25 fmol/μL at 30 μL/min |
All UPLC-MS (Tof) data were processed using Waters MarkerLynx Application Manager for MassLynx Software. Partial least squares (PLS) analysis was performed using Pirouette Software (InfoMetrix) and an exported peak list from MarkerLynx.
Representative total ion current chromatograms for an extract of sumatran coffee beans is presented in Figure 1.
Although differences between each of the chromatograms in Figure 1 can be ascertained via visual inspection, a more complete comparison can be made through the use of a pattern recognition algorithm such as PLS. The resulting scores and loadings plots are presented in Figures 2a and 2b.
One of the key ions contributing to the observed clustering in that of caffeine, m/z = 195.08. The abundances of this ion in each of the coffee bean extracts can be visualized from the trends plot for caffeine in Figure 3.
From this trend line, it can be noted that coffee beans from Sumatra and Kenya appear to have the highest caffeine content. The mass spectrum of caffeine from a Kenyan coffee bean extract is given in Figure 4. Both the calculated and observed exact mass value for caffeine (MH+ C8H11N4O2, m/z= 195.0882) are identical resulting in a mass error of zero.
Although caffeine is one of the more dominant compounds, it is but a small fraction of the other classes of compounds found in coffee bean extracts. Using this metabonomic approach we have been able detect many other markers of geographic origin including plant sterols, an example of which is m/z = 535.40. The trend line for this marker (Figure 5) indicates that, like caffeine, it is present at higher levels in sumatran coffee.
The application of metabonomics to non-mammalian samples has been successfully illustrated by the analysis of whole, roasted coffee bean extracts from different areas of the world. We have demonstrated that the UPLC-MS (Tof) based approach allows for a rapid and sensitive analysis. The high mass accuracy of the LCT Premier coupled with the superior chromatographic resolution afforded by the ACQUITY UPLC System has facilitated the identification of several markers of interest, such as caffeine and sterol derivatives, which has been successfully confirmed by exact mass.
720001058, November 2004