• Nota applicativa

The Advantages of Multiple Reaction Monitoring (MRM) Over Single Ion Recording (SIR) for the Analysis of 81 Pesticide Residues in Fruit and Vegetables

The Advantages of Multiple Reaction Monitoring (MRM) Over Single Ion Recording (SIR) for the Analysis of 81 Pesticide Residues in Fruit and Vegetables

  • Gordon Kearney
  • Lutz Alder
  • Anthony Newton
  • Jeannette Klein
  • Waters Corporation
  • Federal Institute for Risk Assessment

Abstract

This application note details on the advantages of Multiple Reaction Monitoring (MRM) over Single Ion Recording (SIR) for the analysis of 81 pesticide residues in fruit and vegetables.

Introduction

The inappropriate or unlawful use of pesticides on agricultural crops can result in unacceptably high levels of these compounds, and their metabolites, in produce destined for human consumption. To protect the health of consumers, many countries stipulate Maximum Residue Levels (MRLs) for each pesticide compound in a range of fruit and vegetables. Worldwide, there are over 800 compounds currently in use to control pests such as insects, weeds, rodents and fungi. The legal enforcement of regulations governing pesticide use requires the regular monitoring of agricultural produce. Given the large number of pesticide residues that may be found, it is advantageous to determine as many of them as possible during a single analysis multi-residue methods have been developed that target more than one analyte compound. As the number and diversity of target analytes is increased, the selectivity of the clean-up stage of sample preparation is necessarily compromised, resulting in a more complex sample matrix.

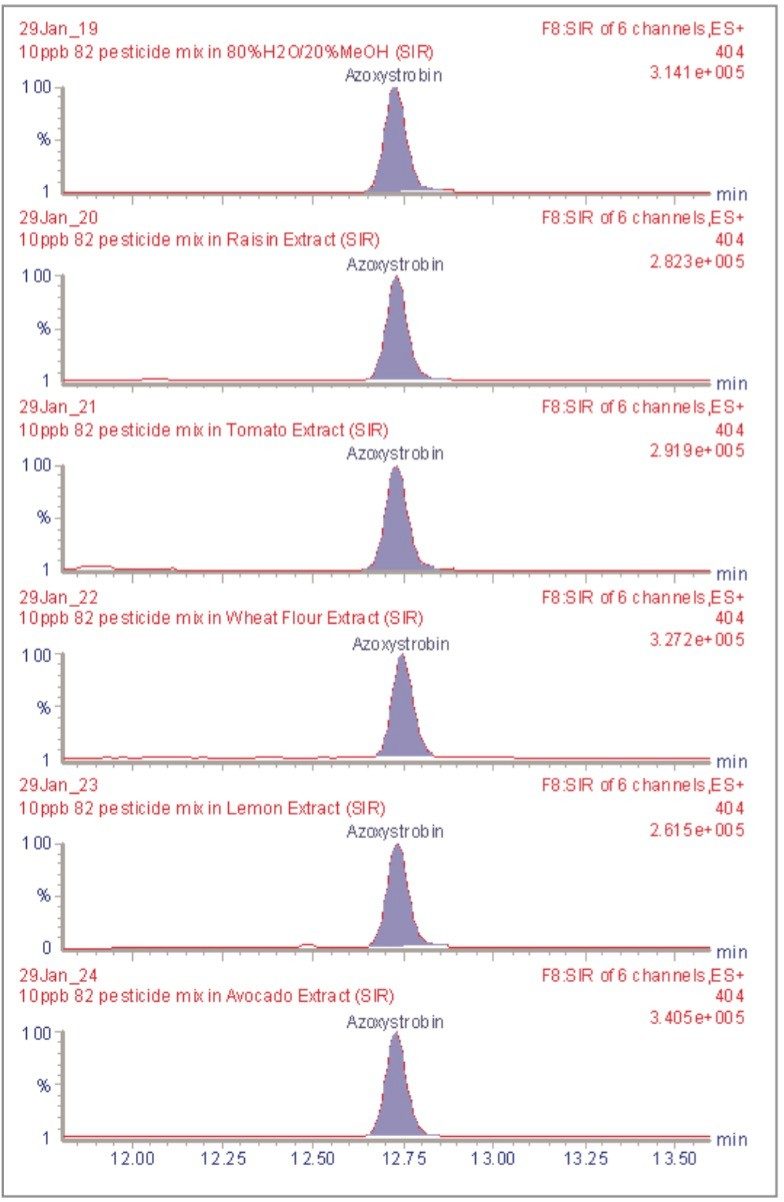
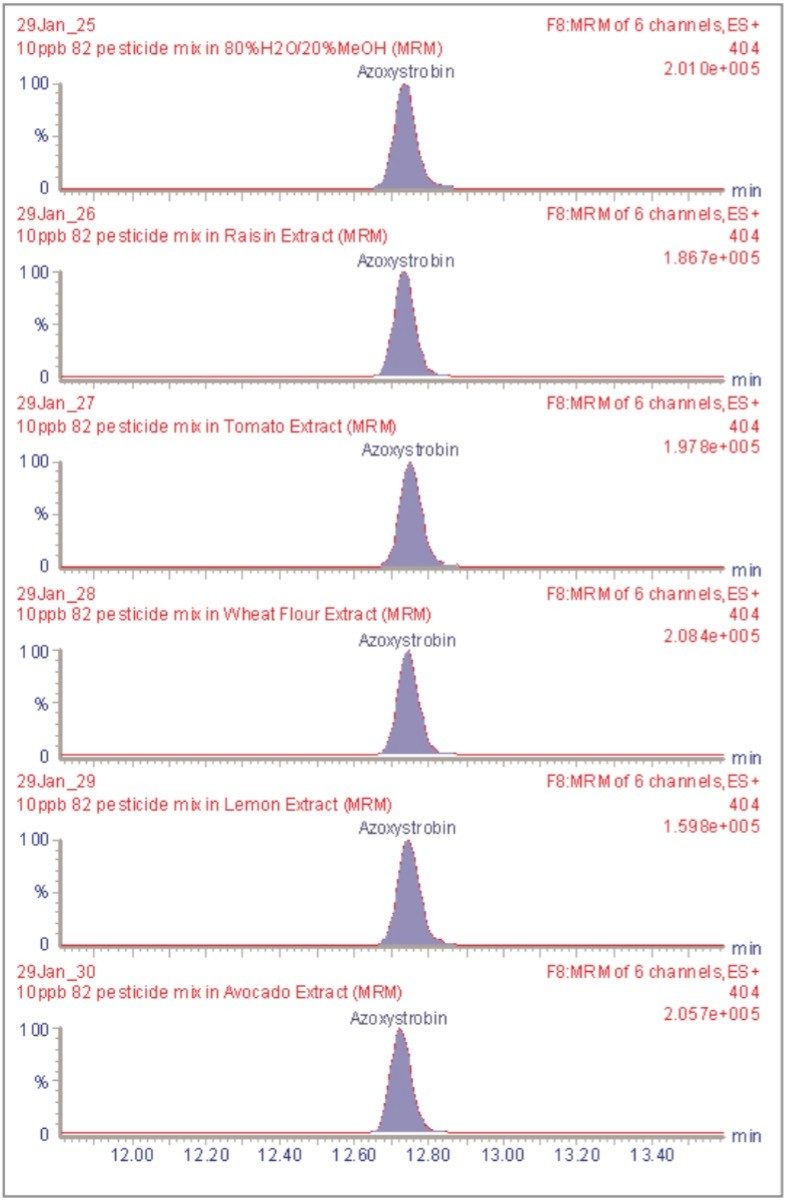
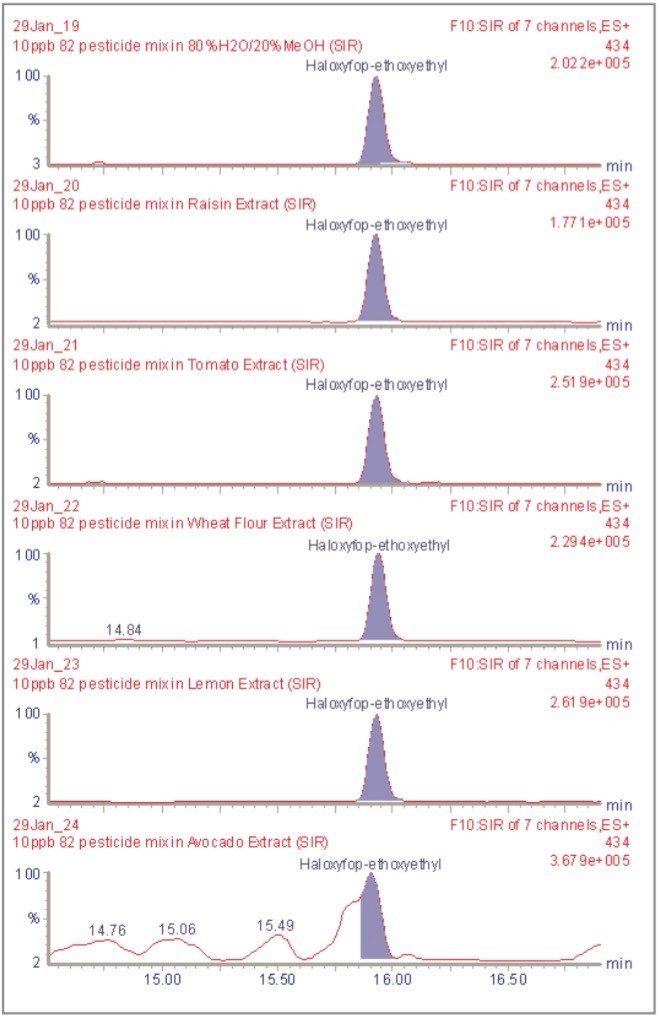
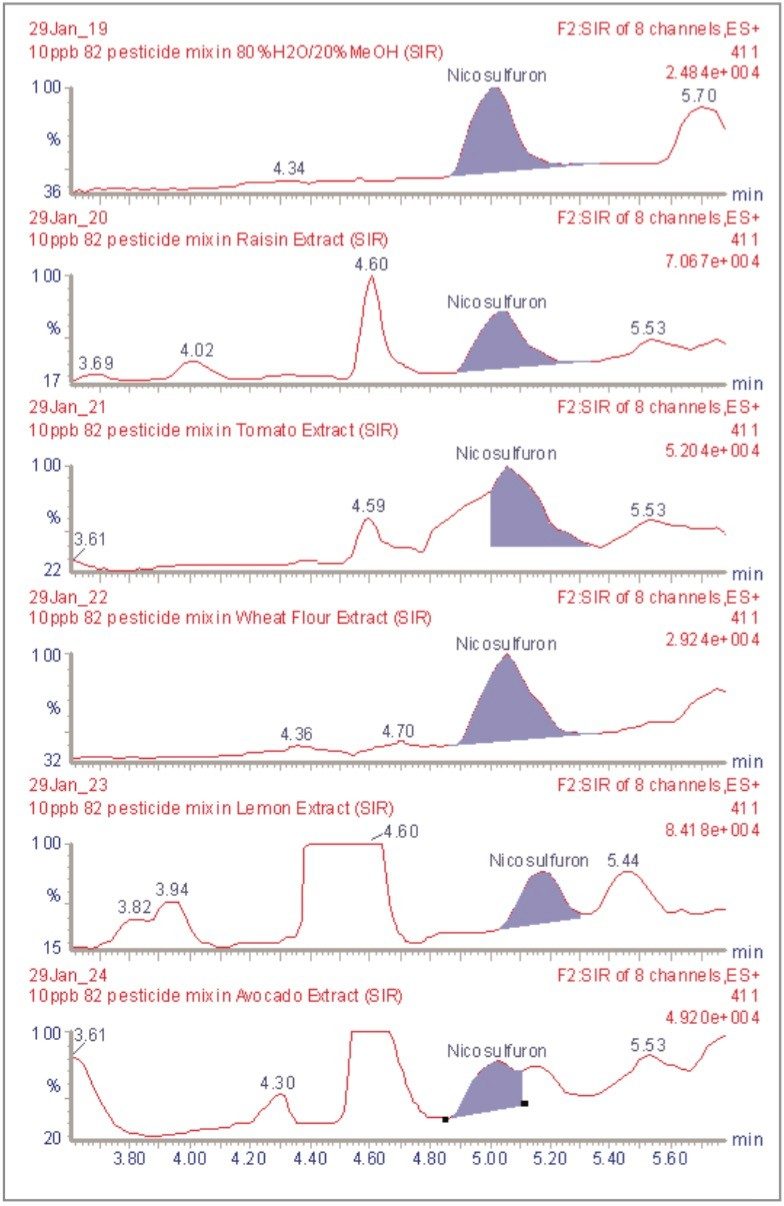
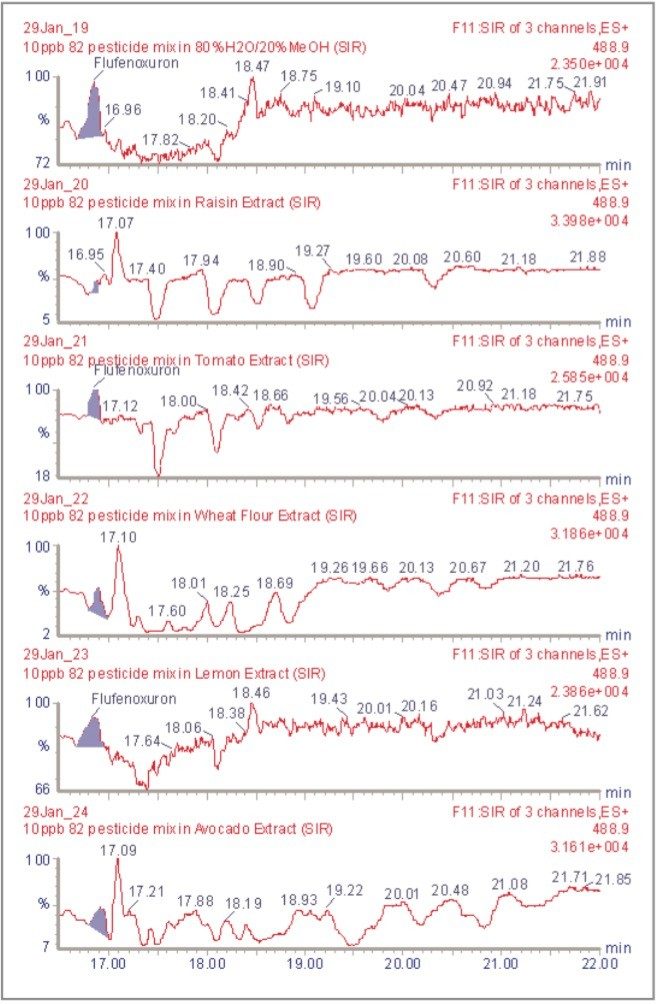
To maximise the efficient use of analytical resource it is also advantageous to have a general sample preparation method that is applicable to a variety of produce. Such a method will produce sample matrices of various compositions, depending on the type of produce under investigation. The potential for analytical interference from co-extracted substances is high, and the analytical selectivity of such a multiresidue, multi-produce method must, therefore, be provided by the determinative step. Mass spectrometry is a highly selective analytical technique that can be used to monitor specific ions generated from the analytes of interest. The use of the Selected Ion Recording (SIR) method provides a greater level of selectivity than other detection methods such as UV/Vis spectrometry. However, when the analysis of 81 pesticide residues is required, the low selectivity of the clean-up stage means that the SIR method does not eliminate the potential for interference from matrix components.

Multiple Reaction Monitoring (MRM) is a tandem mass spectrometric technique that allows the monitoring of specific Collision Induced Dissociation (CID) reactions. The nature of CID reactions depends on molecular structure as well as mass. As a result, significant improvements in analytical selectivity may be achieved using the MRM method.

Experimental

Extraction Procedure

The test sample is chopped avoiding loss of juice. An aliquot of 10 g is transferred into a blender cup. For dry sample materials like cereal grains, instant infant food or flour, a homogenised portion of 5 g is weighed into the cup. Water is added to all samples to obtain 10 mL as a sum of natural and added water. To 10 g tomato (water content 95%), lemon (water content 90%) or avocado (water content 70%) 0.5 mL, 1 mL and 3 mL of water is added, respectively. To 5 g of raisins (water content 20%) and wheat flour (water content 10%) 9 mL and 9.5 mL of water is added respectively. In the case of dry sample materials, it is necessary to wait 10 minutes after the addition of water. After a further addition of 20 mL, methanol the sample is blended for 2 minutes. The total volume of supernatant extract (taking into account the natural water content of the sample) is 30 mL. In the case of very turbid extracts an aliquot is centrifuged at about 3000 g.

Partition on an Extraction Cartridge

Six mL of the extract is mixed with 2 mL of a solution of sodium chloride (20 g in 100 mL water). An aliquot of 5 mL (which contains the pesticides residues of 1.25 g normal or 0.625 g dry sample material, respectively) is transferred to an cartridge containing 5 mL of diatomaceous earth. After a 5 minute waiting period the extraction cartridge is eluted with 16 mL of dichloromethane. The solvent of the collected eluate is gently evaporated. The dry residue is redissolved in 250 μL methanol with the help of an ultrasonic bath, and further diluted with 1000 μL water. The resulting final extract contains the residues of 1 g normal or 0.5 g dry sample per milliliter. It is filtered through a 0.45 μm teflon filter into a glass sample vial.

HPLC Method

Mobile phase A:

MeOH/H2O (1:4 v/v) + 5 mM CH3CO2NH4

Mobile phase B:

MeOH/H2O (9:1 v/v) + 5 mM CH3CO2NH4

Column:

Waters Atlantis C18 4.6 mm id x 100 mm with 3 mm particle size

Flow:

1.0 mL/min

Injection volume:

20 mL

Instrumentation:

Alliance 2795 HPLC

Approx 2;1 split of eluent system before MS source

Gradient

Time 0

0% B

Time 15 mins

100% B

Time 29 mins

100% B

Time 29.1 mins

0% B

Time 40 mins

0% B

MS Method

A Waters Micromass Quattro micro API triple quadrupole mass spectrometer was operated in the positive ion electrospray mode. Nitrogen gas, at a flow rate of 850 L/hr, and a temperature of 450 °C was used for spray desolvation. The source block was maintained at 120 °C and the electrospray capillary voltage was 0.6 kV. Two LC-MS methods were used to determine 81 pesticide residues in 5 commodities: raisin, avocado, tomato, wheat flour and lemon. These commodities represent high sugar (raisin), high fat (avocado), high water (tomato), dry (wheat flour), and low pH (lemon) matrices. Target analytes included a number of compound classes such as carbamates, organophosphorous compounds, oximes and sulfonylureas. The 81 analytes were spiked into matrix extracts at a concentration of 10 pg/μL, corresponding to the 0.01 mg/kg level for tomato, avocado, and lemon and the 0.02 mg/kg level for raisin and wheat flour. A solvent standard at the same concentration was also analysed. The first method contained 81 SIR channels; the second method was set to monitor 81 MRM transitions. Dwell, inter channel and inter scan times were unchanged between the two methods.

Results and Discussion

Figure 1 shows a set of chromatographic peaks, generated by the monitoring of an SIR channel at m/z 404, corresponding to azoxystrobin. For this compound, there are no significant interferences from any of the five sample matrices studied.

Figure 1. SIR analysis of Azoxystrobin (m/z 404).

Figure 2 shows equivalent chromatograms for the MRM transition of m/z 404 to m/z 372. Although the MRM chromatographic peaks show greater signal to noise ratios than their SIR equivalents, there is no significant advantage in the use of the MRM over the SIR technique.

Figure 2. MRM analysis of azoxystrobin (m/z 404 >372).

Figure 3 shows a set of SIR chromatograms at m/z 434, corresponding to haloxyfop-ethoxyethyl. No problems with co-extracted interferences are encountered for this compound except when the analysis is carried out in avocado extract. A matrix component, with the ability to form an ion at the same mass as that formed by the analyte, co-elutes with it and forms a shoulder on the peak of interest. This shoulder makes accurate peak integration problematical.

Figure 3. SIR analysis of haloxyfop-ethoxyethyl (m/z 434).

The chromatograms shown in Figure 4 demonstrate that this shoulder is not observed in avocado extract during the MRM monitoring of haloxyfop-ethoxyethyl at m/z 434 to m/z 316.

Figure 4. MRM analysis of haloxyfop-ethoxyethyl (m/z 434 >316).

The chromatograms shown in Figure 5, corresponding to the SIR analysis of nicosulfuron at m/z 411, are complex and, certainly in the case of tomato and avocado matrices, show co-extracted components partially obscuring the peak of interest. Because of the co-elution of chromatographic peaks, in the analysis of avocado matrix, the peak detection and integration algorithm has integrated a peak at the wrong retention time. The presence of unresolved chromatographic peaks will increase the potential for erroneous automated peak integration, resulting in the need for greater levels of manual intervention when processing data.

Figure 5. SIR analysis of nicosulfuron (m/z 411).

The corresponding chromatograms, generated by MRM analysis of the transition m/z 411 to m/z 182.1 and shown in Figure 6, are extremely simple, unambiguously showing only the peak of the target analyte.

Figure 6. MRM analysis of nicosulfuron (m/z 411 >182.1).

Finally, the SIR monitoring of m/z 488.9, corresponding to the compound flufenoxuron, generates the chromatograms shown in Figure 7. These chromatograms are extremely complex and the peak at 16.8 minutes is either partially or completely obscured in all of them.

Figure 7. IR analysis of flufenoxuron (m/z 488.9).

By comparison, the MRM monitoring of transition m/z 488.9 to m/z 158.1 clearly shows only the peak corresponding to the analyte of interest.

Figure 8. MRM analysis of flufenoxuron (m/z 488.9 >158.1).

Conclusion

Mass spectrometry in the SIR mode provides greatly increased selectivity over other methods of chromatographic detection. However, when analysing a large number of target analytes in complex matrices of varying compositions, SIR experiments do not have the selectivity required to detect all of them at the levels required for surveillance monitoring in the European Union and other western countries. In order to use the SIR method, it would be necessary to develop separate clean up techniques for each produce type. Such method development is time consuming and would result in decreased laboratory productivity. The SIR method would also require high levels of manual intervention during data processing and report generation. Because there is the potential for interference from co-extracted matrix components, the accuracy and precision of quantitative measurements may be compromised. The selectivity that is provided by MRM mass spectrometry overcomes these problems and allows Limits of Determination well below what is required for surveillance monitoring studies. This being the case, the method could clearly be extended to include a greater number of pesticide targets.

References

  1. A Multi-Residue HPLC-MS/MS Method for the Determination of 81 Pesticide Residues in Fruit and Vegetables: Part 1, Method Overview. Gordon Kearney, Lutz Alder, Anthony Newton, Jeannette Klein. Waters Application Note, 2003.

Featured Products

720000693, July 2003

Torna all'inizio Torna all'inizio