Sequence Mapping of mRNA Digests Using the Xevo™ MRT Mass Spectrometer and waters_connect™ MAP Sequence 2.0 Application
Catalin Doneanu, Alexandre F. Gomes, Chris Preston, Matt Gorton, Tatiana Johnston, Bala Addepalli, Ying Qing Yu
Waters Corporation, United States
Published on December 10, 2025
Abstract
Recent advances in liquid chromatography-mass spectrometry (LC-MS) and informatics technologies are supporting scientists in their efforts to design innovative strategies for mRNA critical attribute analysis. This application note describes a workflow for mRNA sequence mapping, from sample preparation using RNase T2 enzymes to automated LC-MS sequence mapping using ultra performance liquid chromatography – quadrupole time of flight mass spectrometry (UPLC™-QTOf MS) and novel informatics for data analysis. The combined use of innovative RNA digestion enzymes and automated data software processing for oligo sequencing of Firefly luciferase mRNA (Fluc) is discussed in detail. mRNA sequence coverage based on unique accurate masses of oligonucleotide digest products augmented by data-independent fragmentation is demonstrated.
Benefits
- A novel informatics workflow featuring the waters_connect MAP Sequence App v2.0 streamlines oligonucleotide sequence mapping of mRNA via enzymatic digestion and UPLC-QTOF Mass Spectrometer map data acquisition
- Novel RNase T2 enzymes (MC1 and Cusativin) offering unique cleavage specificity with the opportunity to generate overlapping digestion products, achieve higher sequence coverage, compared to conventional RNase T1 digestion
Introduction
The development and regulatory approval of several COVID mRNA-based vaccines and emerging opportunities for mRNA-based therapeutics have brought mRNA molecules to the forefront of the biopharma industry.1-3 The resulting need for rapid product development has necessitated the development of analytics for the precise characterization of mRNA critical quality attributes (CQAs), including sequence integrity. Two workflows were previously developed by Waters for directly assessing mRNA CQAs,4,5 namely 5’ capping efficiency measurement and poly(A) tail heterogeneity analysis, utilizing the waters_connect INTACT Mass App. A complimentary oligo sequence mapping workflow utilizing the newly launched MAP Sequence App v2.0, recently demonstrated for oligo sequencing of 100-mer single guide RNAs,6 can supplement the terminal CQA workflows for characterization and monitoring of mRNA sequence and modifications.
Conventional oligonucleotide sequencing techniques, like Sanger sequencing, next-generation sequencing (NGS), and nanopore mRNA sequencing, have been applied for sequence analysis of mRNAs, due to their cost-effectiveness and throughput, but are limited by their inability to assess the sequence modifications that can arise during production and degradation of mRNA molecules. Alternatively, LC-MS based approaches, known for their exceptional specificity, sensitivity, and quantification performance are becoming more popular7-10 and readily address base and backbone modifications. Overall, for the characterization of complex biologics, orthogonal techniques are desired to obtain a holistic view of product quality.
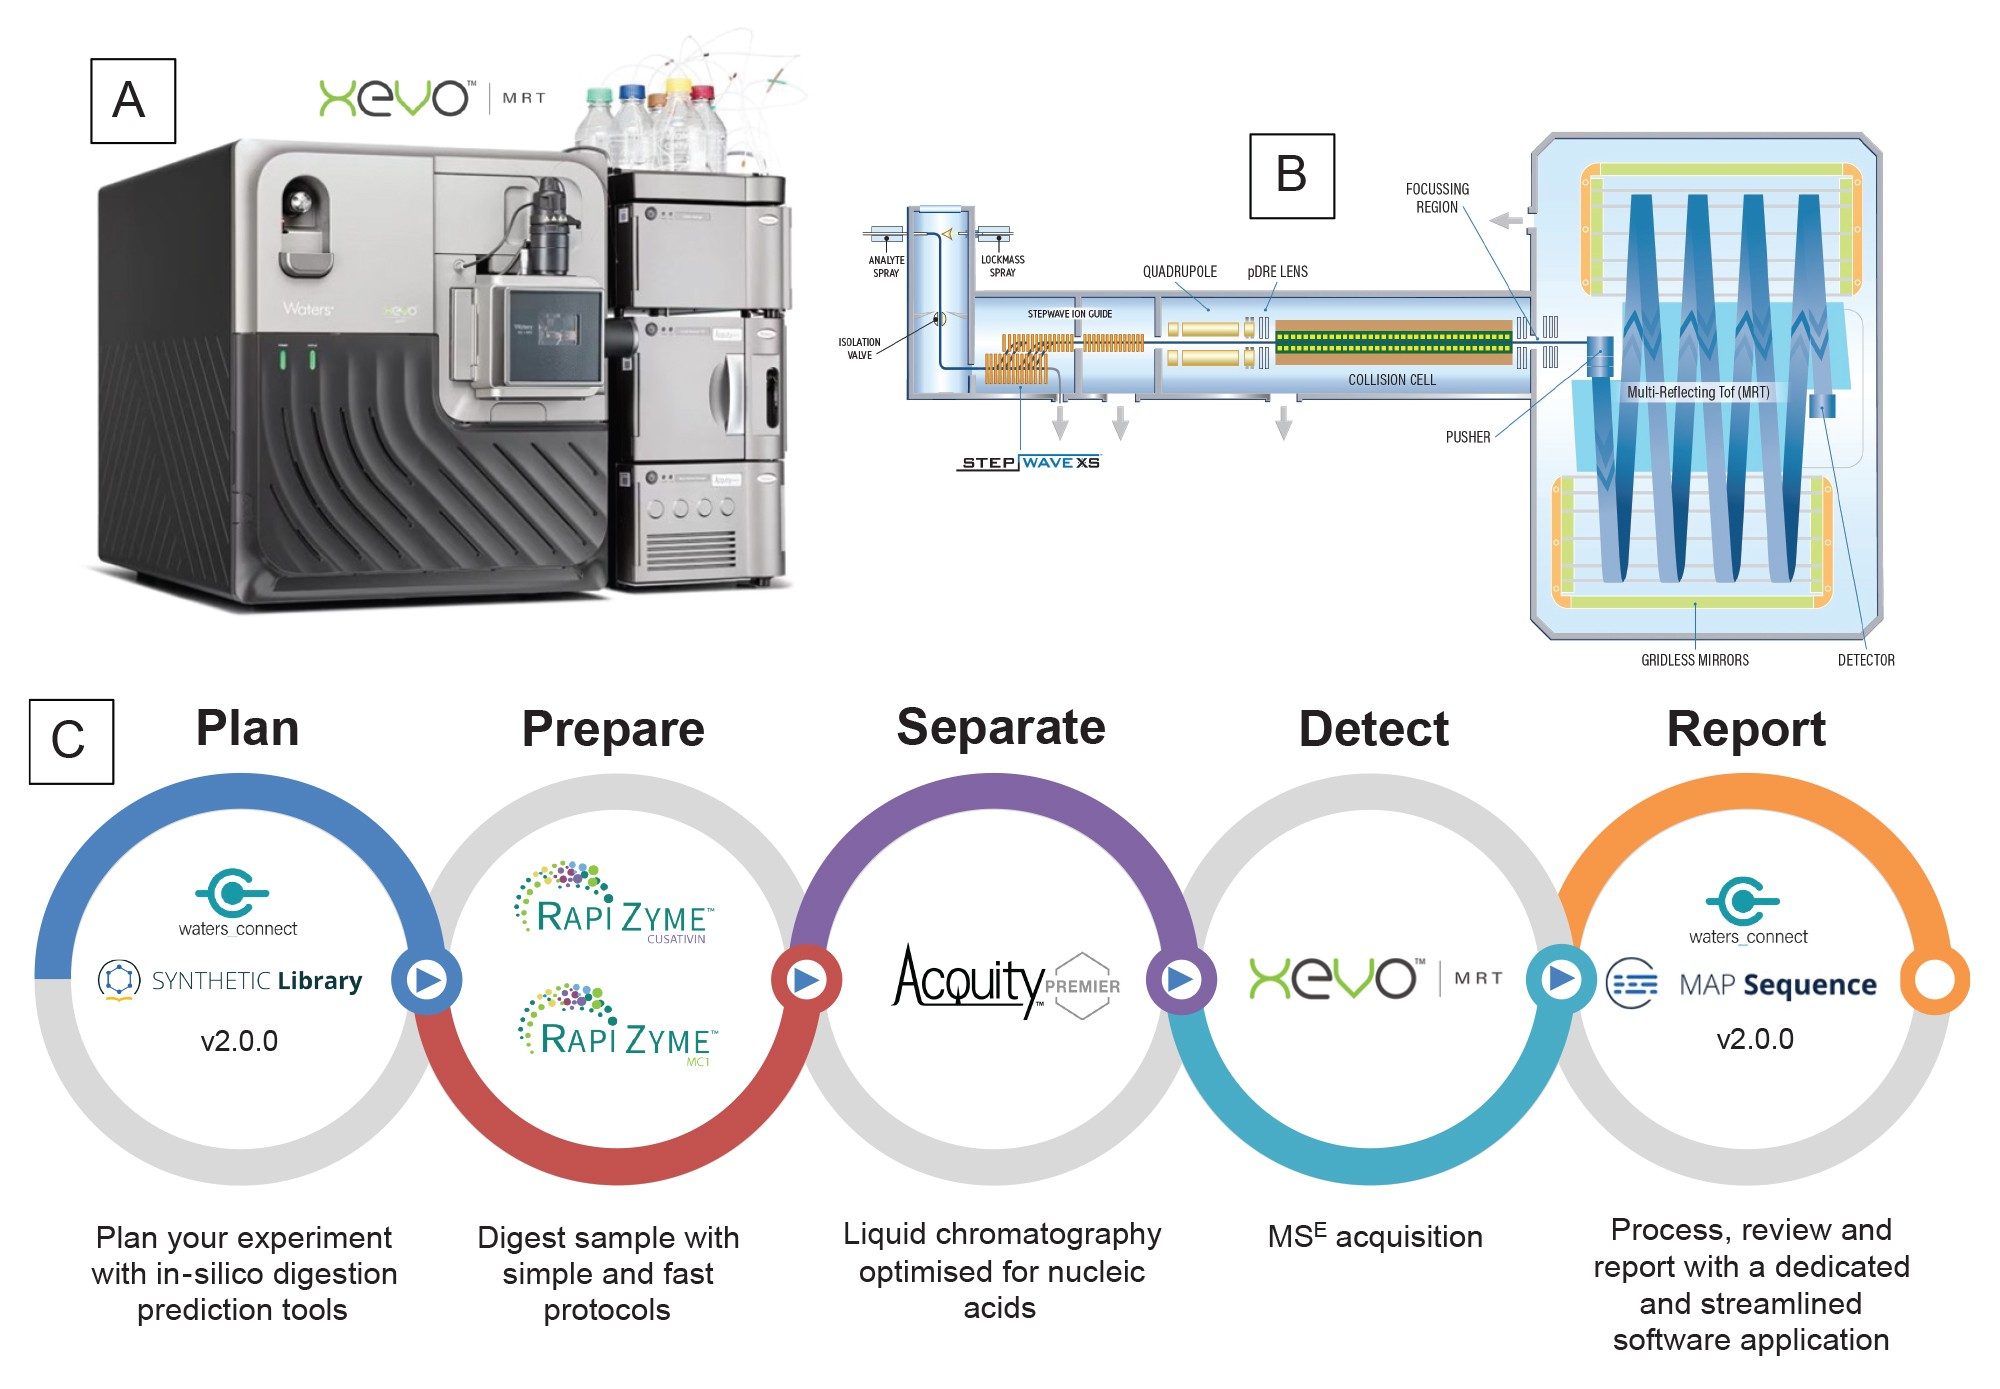
LC-MS/MS workflows for RNA digest oligo mapping have historically been laborious and time-consuming, involving significant manual interventions during data analysis and result curation. In a recent application note,6 an automated and streamlined UPLC-MSE data independent acquisition (DIA) workflow and informatics workflow sequence mapping of sgRNAs was presented, utilizing digestion by a panel of enzymes, including RNase T1 and RNase T2 enzymes (RapiZyme™ MC1 and Cusativin) and consolidation of the individual mapping results. This application note extends the utility of the workflow (Figure 1) to larger mRNA molecules digested with multiple ribonucleases, including two recently launched RNase T2 enzymes (RapiZyme MC1 and RapiZyme Cusativin), that have unique cleavage patterns that promote higher sequence coverage.6-11 The workflow introduced for automated sequencing of sgRNAs, relying on a streamlined interface for data processing and review, should provide even greater efficiencies for the more complex task of mRNA characterization.
Experimental
Reagents and Sample Preparation
N,N-diisopropylethylamine (DIPEA, 99.5% purity, catalog number 387649-100 ML) was purchased from Millipore Sigma (St Louis, MO) and 1,1,1,3,3,3-hexafluoro-2-propanol (IonHance HFIP, p/n:186010781) was obtained from Waters (Milford, MA).
Methanol (LC-MS grade, catalog number 34966-1 L) and acetonitrile (LC-MS grade, catalog number 34967-6XL) were obtained from Honeywell (Charlotte, NC). HPLC grade Type I deionized (DI) water was purified using a Milli-Q system (Millipore, Bedford, MA). Mobile phases were prepared fresh daily. Ultrapure nuclease-free water (catalog number J71786.AE) for mRNA digestions was purchased from Thermo Fisher Scientific (Waltham, MA).
An mRNA construct based on the firefly luciferase (Fluc) sequence was custom-made via in vitro transcription (IVT synthesis) by GenScript (Piscataway, NJ). The mRNA molecule was synthesized with a Cap1 structure (with the sequence: 7MeGpppA(2’-OMe) with elemental composition: C32H42N15O26P5), followed by 1813 nucleotides and a Poly(A) Tail sequence with an average length of 126 nt.
Fungus-derived animal free purified ribonuclease T1 (catalogue number IFGRNASET1AFLY500KU) was ordered from Innovative Research (Novi, MI), and the lyophilized enzyme was dissolved in 5 mL of 100 mM ammonium bicarbonate (catalogue number 5.33005-50G, Millipore Sigma) to prepare a solution containing 100 units/µL. For mRNA digestion with RNase T1, 5 µL of 5 µM Fluc mRNA were mixed with 5 µL of nuclease-free water in an Eppendorf PCR vial and denatured for 2 minutes at 90 oC. 10 µL of RNase T1 enzyme (1000 units) were added to the vial, and the digestion was allowed to proceed at 37 oC for 15 minutes. The digestion mixture was transferred to a QuanRecovery™ with MaxPeak™ 300 µL vial for LC-MS analysis. The digest was analyzed immediately by LC-MS using 5 µL injections.
The digestion protocols used for RapiZyme MC1 (Waters p/n: 186011190, 10000 units/tube) and RapiZyme Cusativin (p/n: 186011192, 10000 units/tube) are very similar. For RapiZyme MC1, the Fluc mRNA (10µL, 5 µM solution) was denatured at 90 oC for 2 minutes in a buffer containing 200 mM ammonium acetate (catalog number AM9071-500ML, Thermo Fisher, Waltham, MA), pH 8.0. For RapiZyme Cusativin, the Fluc mRNA (10 µL, 5 µM solution) was denatured at 90 oC for 2 minutes in a buffer containing 200 mM ammonium acetate, pH 9.0. Both samples were cooled on ice and spun in a microcentrifuge to collect the sample droplets. After adding 50 units of digestion enzyme (1 µL of either RapiZyme MC1 or Cusativin) and 9 µL of nuclease-free water to obtain a final volume of ~ 20 µL, the sgRNA was digested at 30 oC for 30 minutes in an Eppendorf thermomixer. The digestion enzymes were inactivated by exposure to 70 ºC for 15 minutes for MC1, and 75 ºC (15 minutes) for Cusativin, and digested samples were analyzed immediately by LC-MS using 5 µL sample injections.
All UPLC-MSE datasets were acquired with waters_connect (v4.1.0.17) and subsequently processed using the waters_connect SYNTHETIC Library App (v 2.0) and the MAP Sequence App (v2.0).
LC-MS System: Xevo MRT (multi-reflecting time-of-flight) Q-Tof Mass Spectrometer coupled with ACQUITY™ Premier UPLC (Binary) System
LC Conditions
|
Column: |
ACQUITY Premier Oligonucleotide BEH C18 Column 300 Å, 1.7 µm, 2.1 x 150 mm, ( p/n: 186010541) |
|
Column temperature: |
70 °C |
|
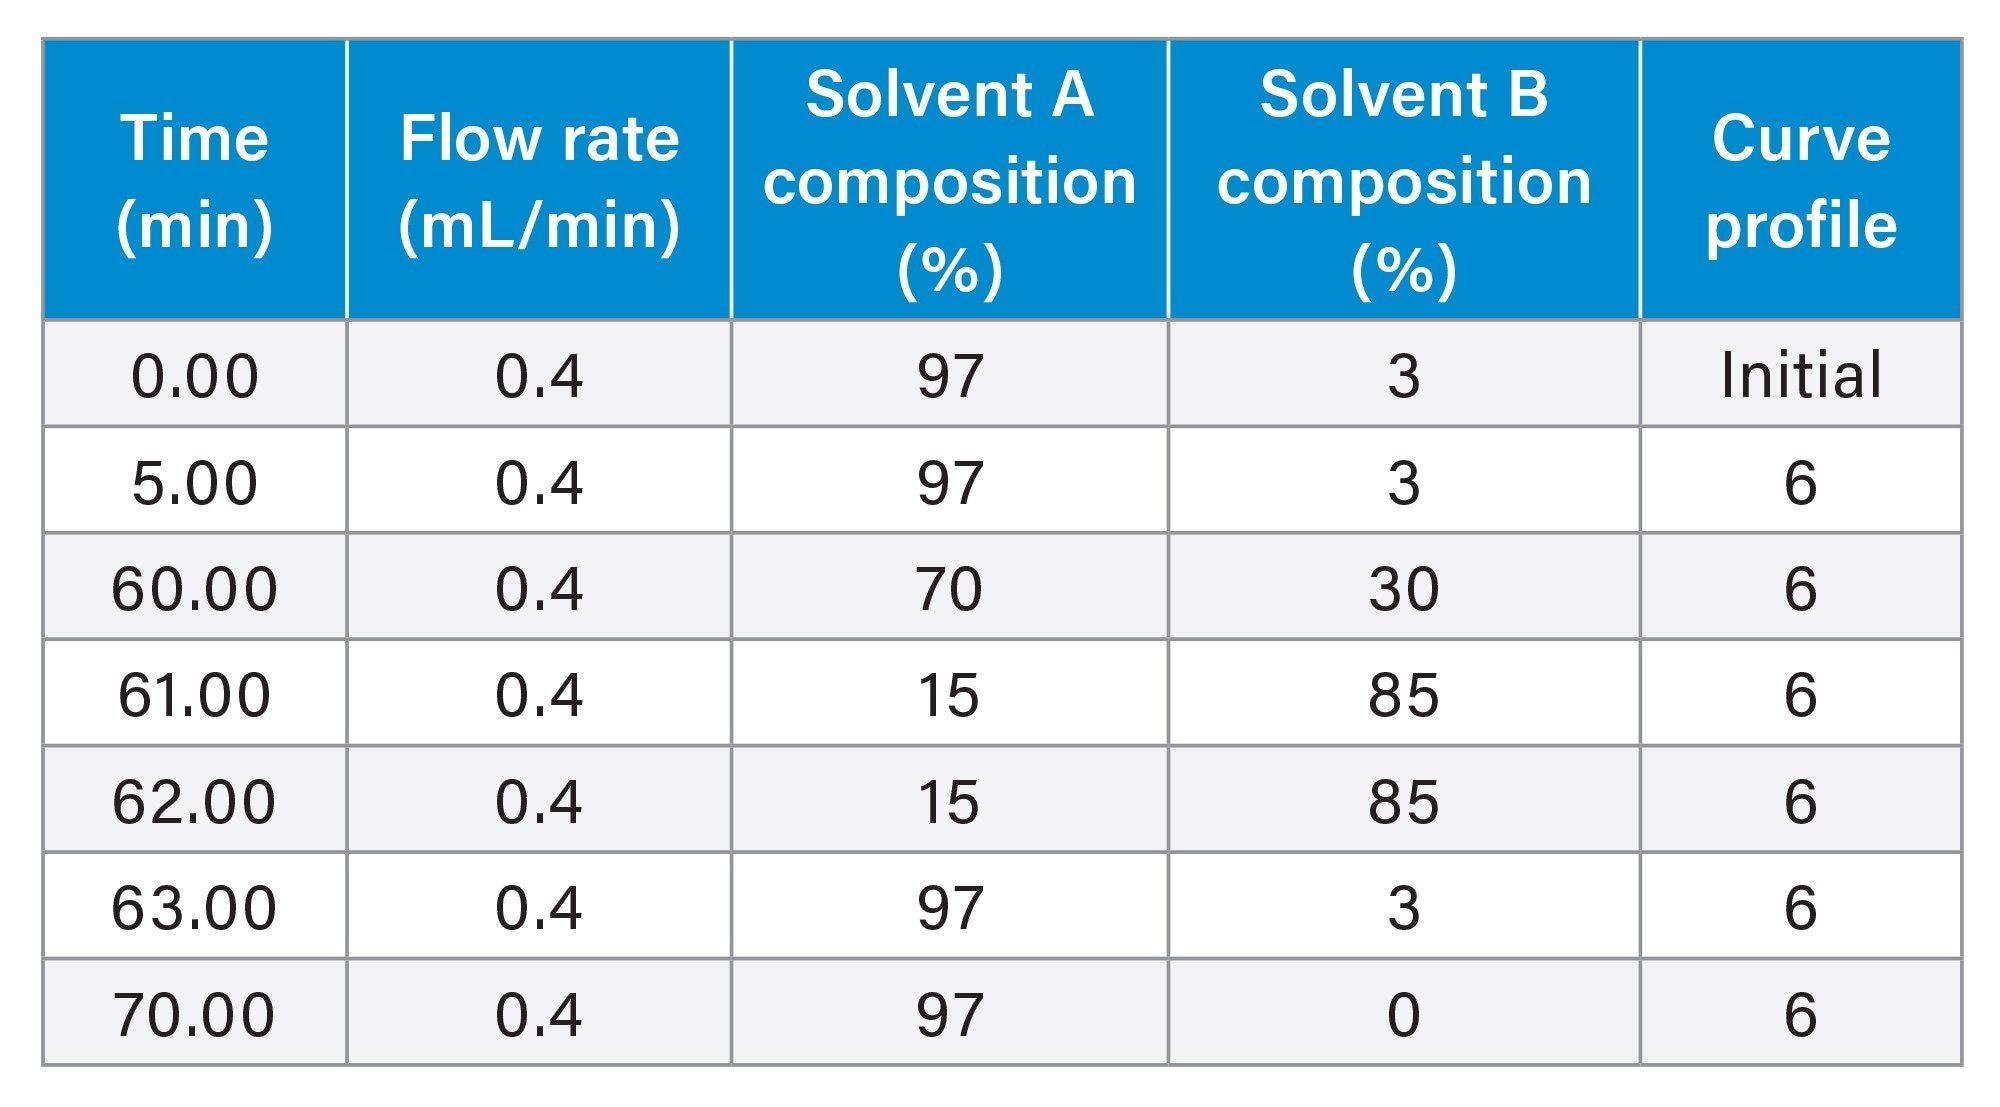
Flow rate: |
400 µL/min |
|
Mobile phases: |
Solvent A: 0.1% DIPEA (N,N-diisopropylethylamine), 1% HFIP (1,1,1,3,3,3-hexafluoroisopropanol) in DI water, pH 8.5 Solvent B: 0.0375% DIPEA, 0.075% HFIP in 65% ACN |
|
Sample temperature: |
8 °C |
|
Sample vials: |
QuanRecovery with MaxPeak HPS vials ( p/n: 186009186) |
|
Injection volume: |
5 µL |
|
Wash solvents: |
Purge solvent: 10% methanol in DI water Sample Manager wash solvent: 50% MeOH Seal wash: 10% methanol in DI water |
Gradient Table
MS Conditions
|
MS system: |
Xevo MRT (multi-reflecting time-of-flight) Q-Tof Mass Spectrometer |
|
Ionization mode: |
ESI(-) |
|
Acquisition mode: |
MSE |
|
Acquisition rate: |
2 Hz |
|
Capillary voltage: |
1.5 kV |
|
Cone voltage: |
40 V |
|
Source offset: |
10 V |
|
Source temperature: |
120 °C |
|
Desolvation temperature: |
550 °C |
|
Cone gas flow: |
0 L/h |
|
Desolvation gas flow: |
1000 L/hr |
|
TOF mass range: |
50-4000 (MSE acquisition) |
|
Low energy CE: |
6 V |
|
High energy CE ramp: |
15 to 25 V |
|
Lock-mass: |
50 pg/µL Leu Enk in 0.1% formic acid, 50% ACN |
|
Data acquisition: |
waters_connect v4.1.0.17 |
|
Data processing: |
SYNTHETIC Library App v2.0 MAP Sequence App v2.0 |
Results and Discussion
As the biopharmaceutical industry advances product development pipelines, increasing adoption of LC-MS based methods for analysis of RNA sequence and modifications complements traditional and NGS sequencing methods to achieve more thorough initial molecule characterization and reliable monitoring of structural integrity. Improvements in chromatographic reproducibility and resolution, and the increased usability of high mass resolution MS, along with improved sensitivity and accuracy of MS systems, allow for confident sequence confirmation and monitoring of intentional and non-intentional modifications. Most importantly, new oligonucleotide informatics tools that largely automate the interpretation of mapping data have made the daunting task of data analysis faster, easier, and less subject to human error.
While LC-MS for digested peptide mapping of biopharmaceutical proteins is routine, employing equivalent approaches to RNA has been more challenging. Unlike proteins, which are composed of 20 different amino acids, mRNAs contain only four building blocks (A, C, G, U), making the generation of oligonucleotide digestion products that have unique masses mappable to mRNAs more challenging. High frequency digestion enzymes, like RNase T1 with G-cleavage specificity, generate many isobaric, isomeric, and repeat mRNA digestion products that result in ambiguous assignments. Enzymes with lower frequency cleavage sites are able to produce longer digestion products, especially when they are employed with the intention to generate a digested oligonucleotide population containing missed cleavage oligonucleotides. The novel RNase Type2 enzymes employed in this work (RapiZyme MC1 and RapiZyme Cusativin), have a greater chance at producing predicable digestion products and missed-cleavage products with unique masses.
An informatics workflow (Figure 1) featuring the waters_connect MAP Sequence App v2.0 for data processing and digested oligo sequence assignment was designed specifically for fast and automated data processing of UPLC-MSE mapping data.6 This new feature in MAP Sequence v2.0 is capable of processing both MS1 and MSE fragmentation data channels to resolve ambiguities in isobaric and isomeric digested oligonucleotide assignments and improve the overall confidence of RNA sequence mapping. The informatics processing workflow consisted of three steps, all performed within the waters_connect MAP Sequence v 2.0 App:
1. In-Silico Digestion: The MAP Sequence App generates predicted, in silico digested oligonucleotide digestion products and sequence coverage, based on selecting the target mRNA sequence from the SYNTHETIC Library App v 2.0 and the digestion enzyme of choice. Combined sequence coverage from multiple enzyme digests can be amalgamated to achieve higher aggregated sequence coverage, and increased assignment confidence from overlapping sequence assignments.
2. Data Processing and Mass-based Peak Assignments: The app processes the UPLC-MSE data, matching the in silico predicted neutral monoisotopic masses of digested oligonucleotides to the experimentally acquired MS1 data. In addition, the elevated energy MSE (DIA) data channel is used for assigning the corresponding fragment ions to each digestion product, therefore increasing the confidence for all digestion product assignments, and enabling the resolution of ambiguous isomeric and isobaric nucleotides.
3. Sequence Coverage Visualization: The resulting coverage for each mRNA digest is summarized and visualized in the “Results” section. The combined sequence coverage obtained from multiple digest runs be displayed with summary coverage results calculated.
Within this workflow, all data acquisition, processing and reporting were conducted within the waters_connect informatics platform, a platform designed to address the needs of users that are required to maintain data integrity and support organizations subjected to regulatory scrutiny.
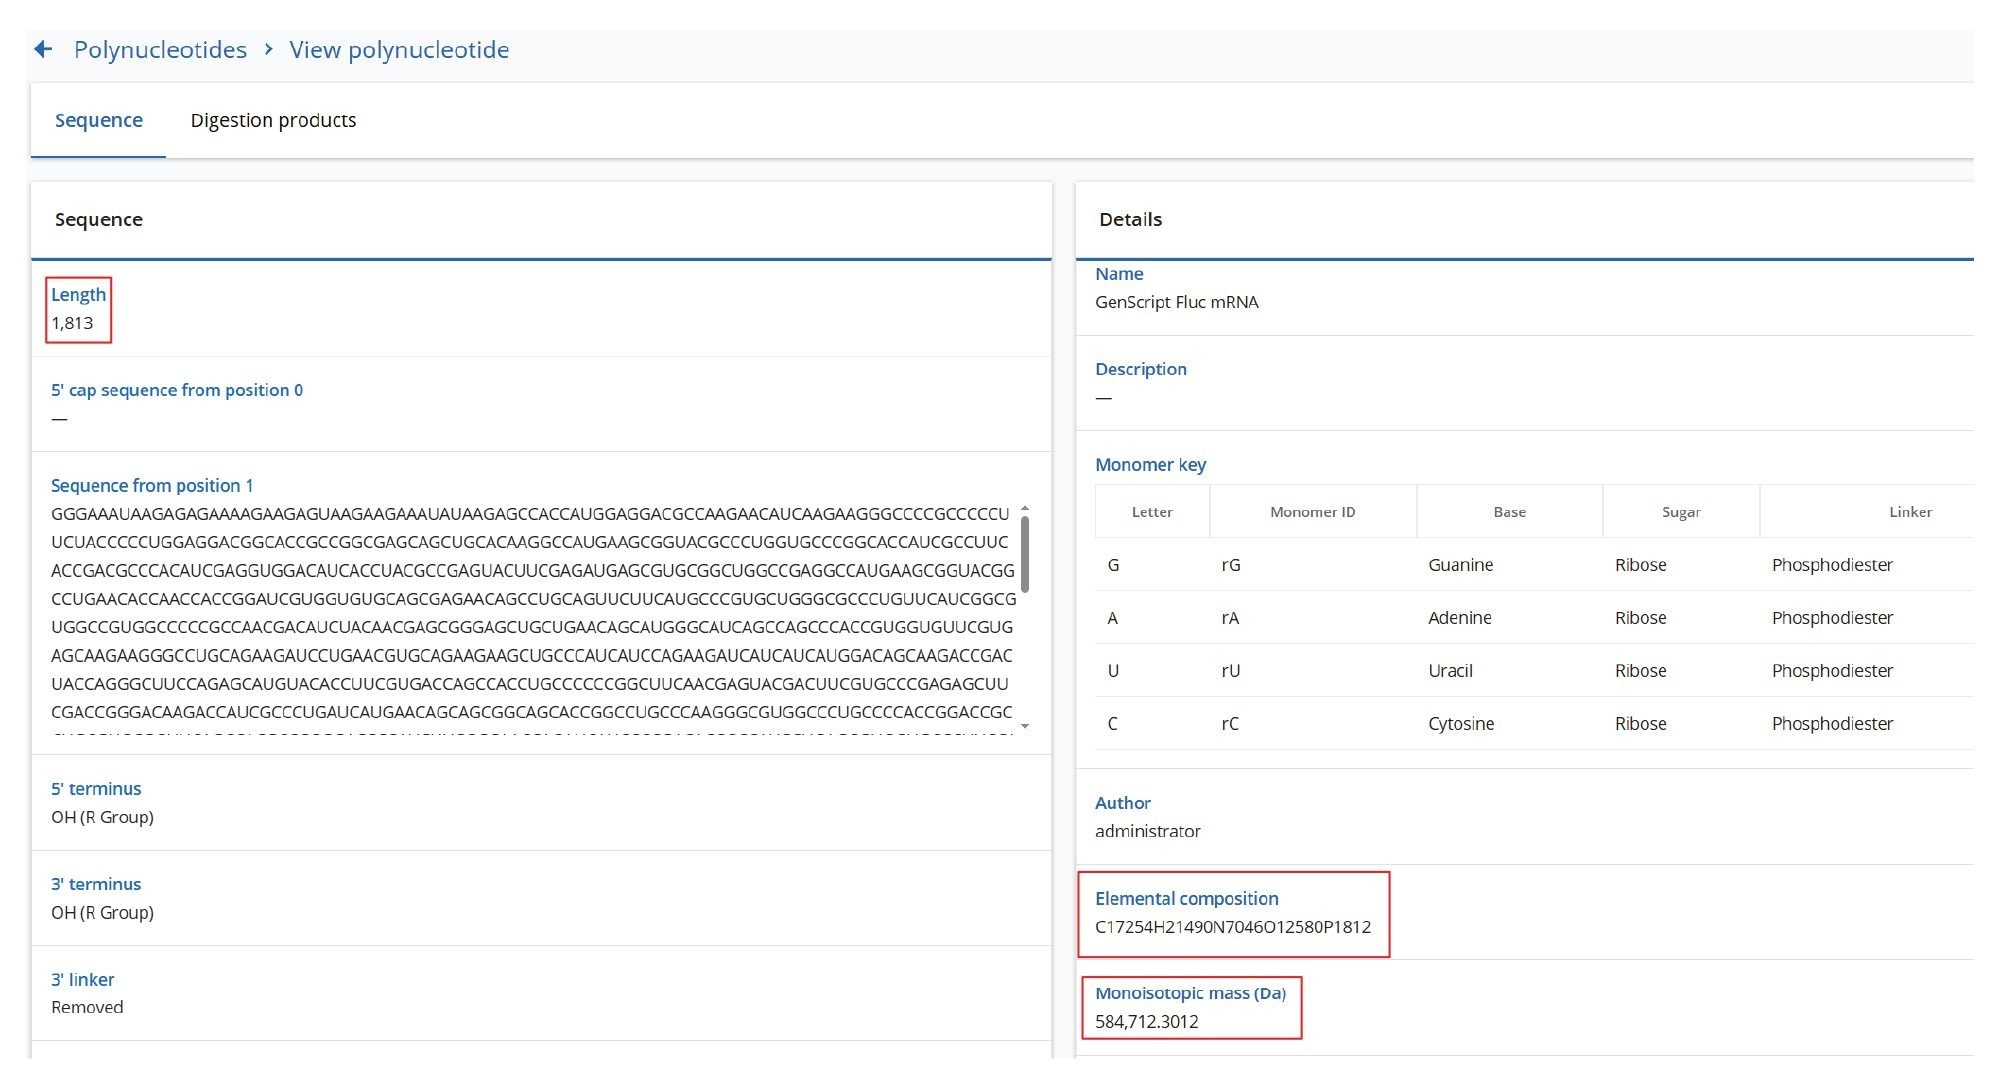
The data processing workflow begins with entering the mRNA sequence into the SYNTHETIC Library App v2.0, as illustrated in Figure 2. The Fluc mRNA sequence contains 1,813 nucleotides, without including the Cap and poly(A) tail structures. The SYNTHETIC Library App v2.0 prediction of the sequence coverage for the same mRNA digested with various enzymes enables optimal experimental design without wasting valuable samples. The predicted sequence coverages (Figure 3) for Fluc mRNA individually digested with three enzymes, RNase T1, RapiZyme MC1, and RapiZyme Cusativin, is displayed with the assumption of up to two missed cleavages. This predictive capability highlights how combining the individual sequence coverage results from multiple enzyme mapping analyses can increase the effective sequence coverage of the RNA substrate. It is critical to generate unambiguous digestion products that have unique sequences produced through enzymatic digestions. Unlike RNase T1, RapiZyme MC1 and RapiZyme Cusativin enzymes tend to produce longer unique digestion products through a combination of unique cleavage specificity and intentionally generated missed cleavages by regulating enzyme amounts and digestion time. The elevated energy MSE (DIA) fragmentation information is used for addressing the remaining ambiguous assignments observed for mRNA digestion products having the same mass or nucleotide composition but different linear oligo sequences.
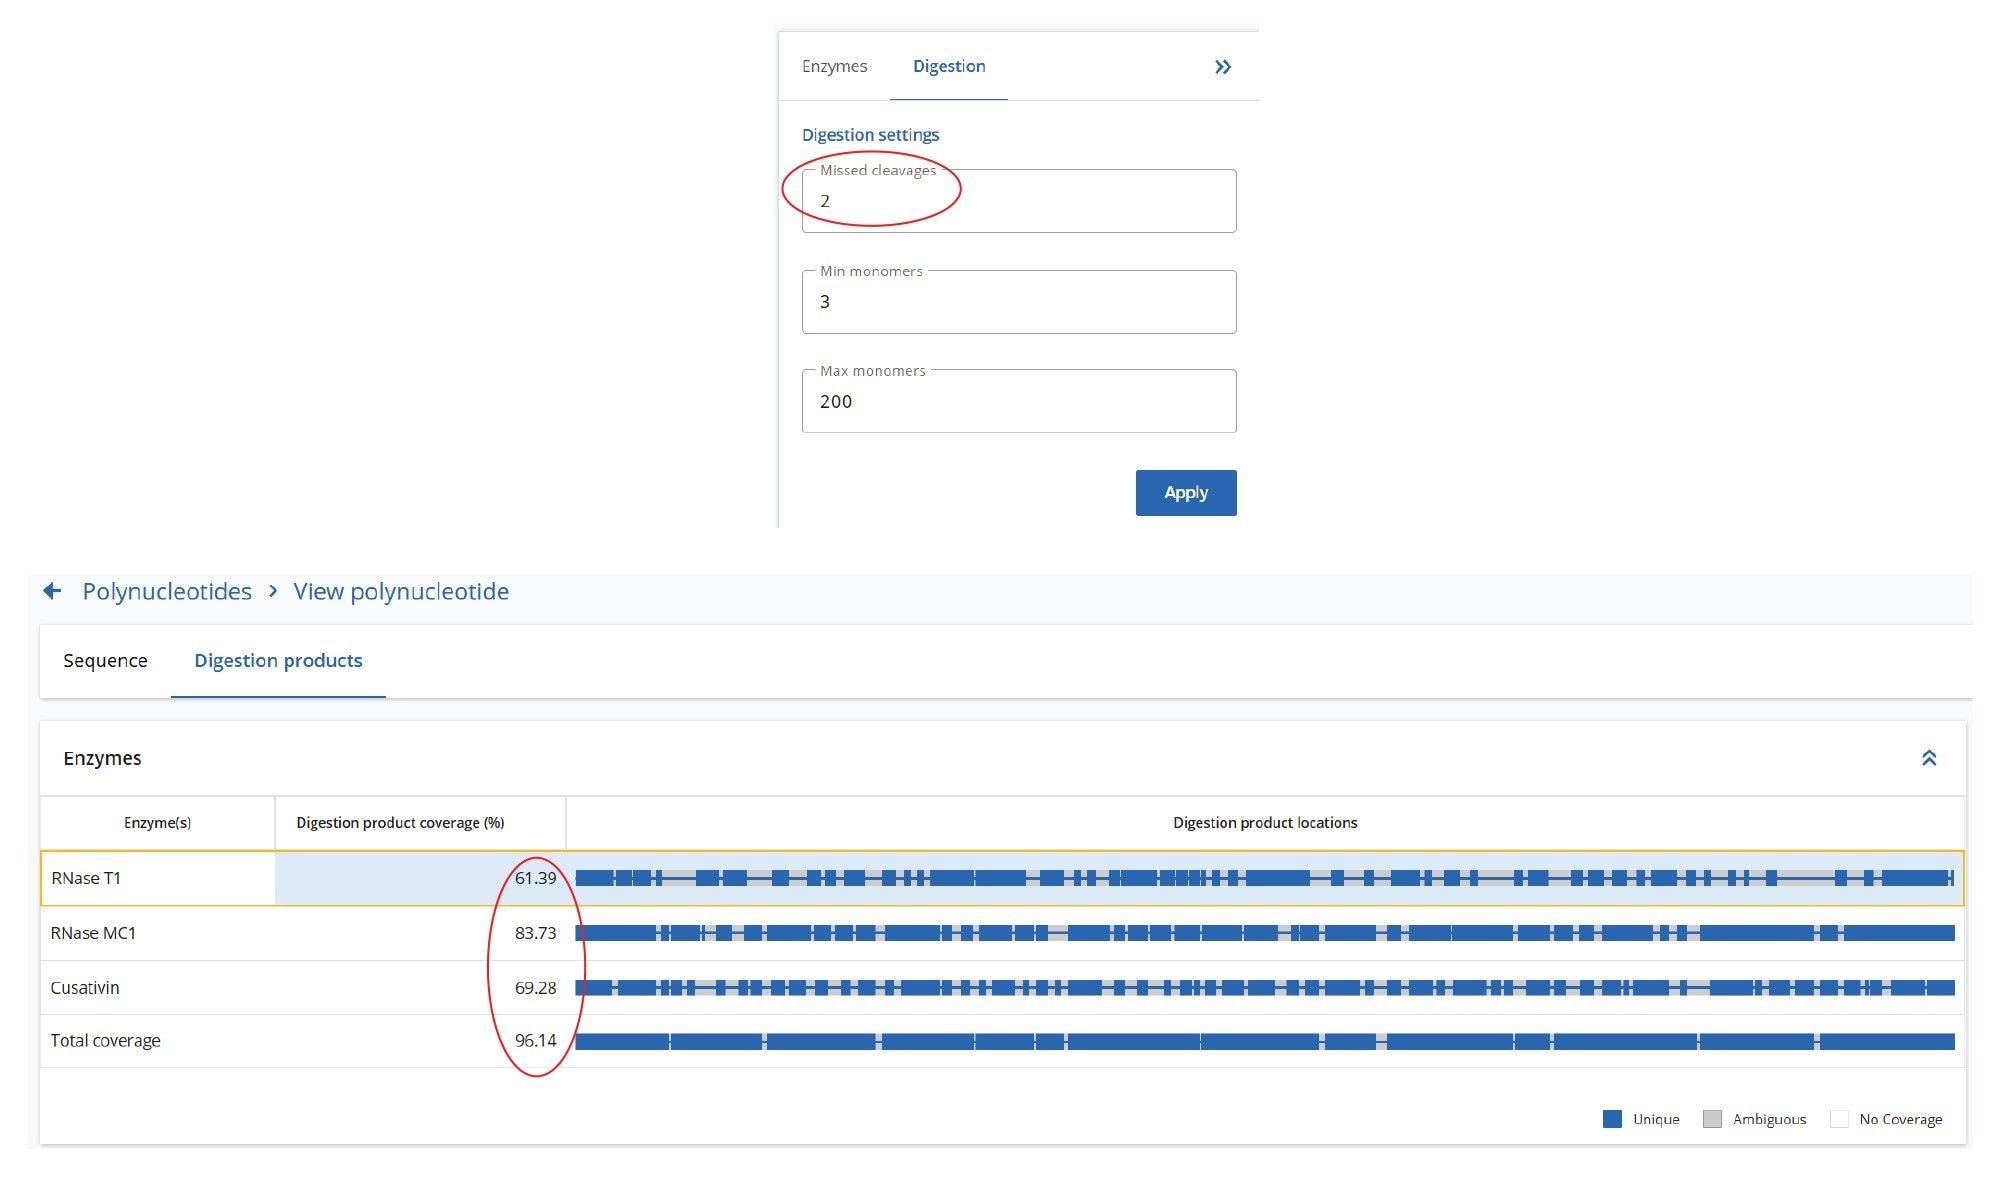
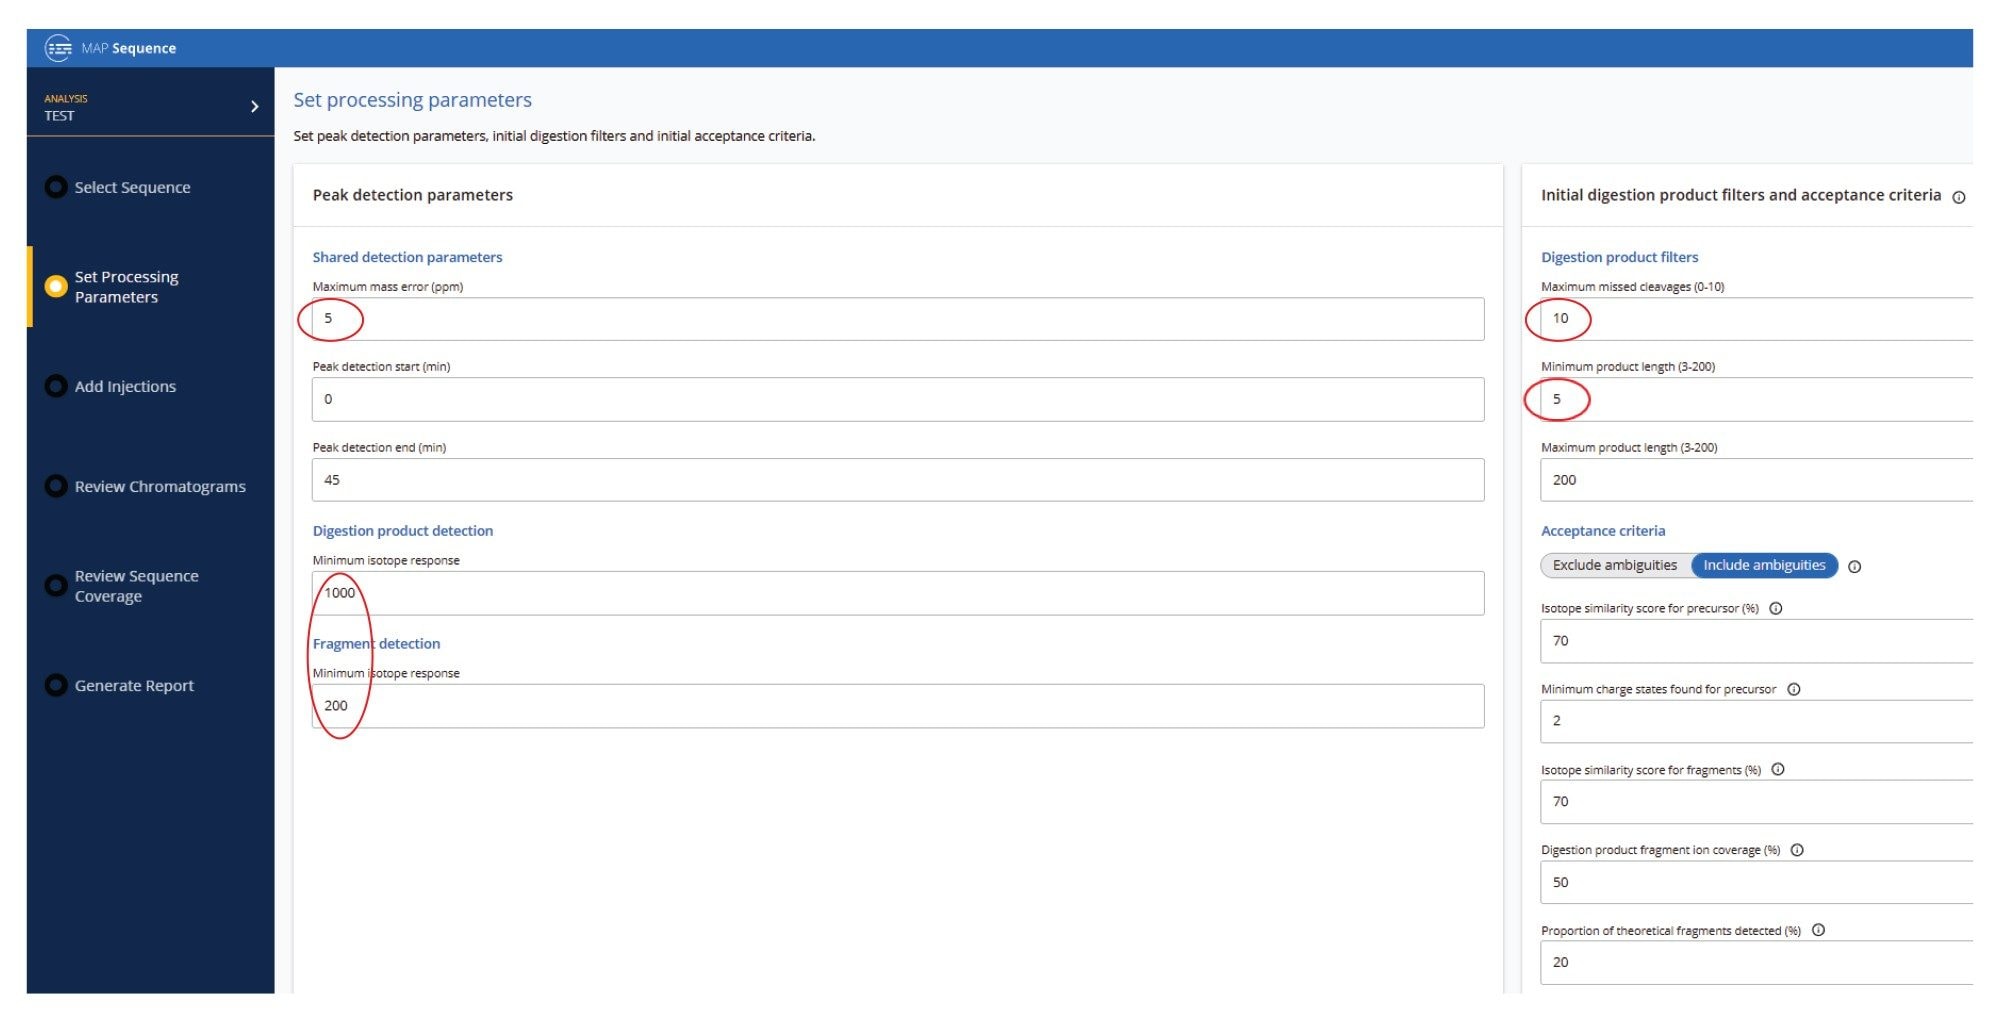
Three UPLC-MSE datasets were acquired for the Fluc mRNA sample digested with three different ribonucleases: RNase T1, RapiZyme MC1 and RapiZyme Cusativin. Automated processing of all datasets was carried out using the waters_connect MAP Sequence App (v2.0), applying the processing parameters shown in Figure 4. The mass accuracy tolerance used for matching the digested product precursors and their corresponding fragments was set to 5 ppm, because the Xevo MRT Mass Spectrometer typically provides sub-ppm mass accuracy, as demonstrated earlier for sgRNA digests.6 The minimum length of the digestion products was set to 5-mer to avoid the large number of ambiguous assignments typically encountered for very short digestion products (2-4 mers). The initial search allowed for up to 10 missed cleavages; however, user-review acceptance criteria can be applied that can restrict assignments to fewer missed cleavages in the final results. Isotopic distributions of both precursor and fragment ions were assessed using an isotope similarity score to ensure accurate matches between theoretical and experimental patterns, typically requiring a score of at least 70 out of 100. In addition, there are two acceptance criteria for fragment ion-based assignments, including the fragment ion coverage obtained for each digested product (at least 50%, as shown in the example in Figure 4 ) and the presence of a minimum proportion of theoretical fragment ions detected (20%), for each assigned oligo.
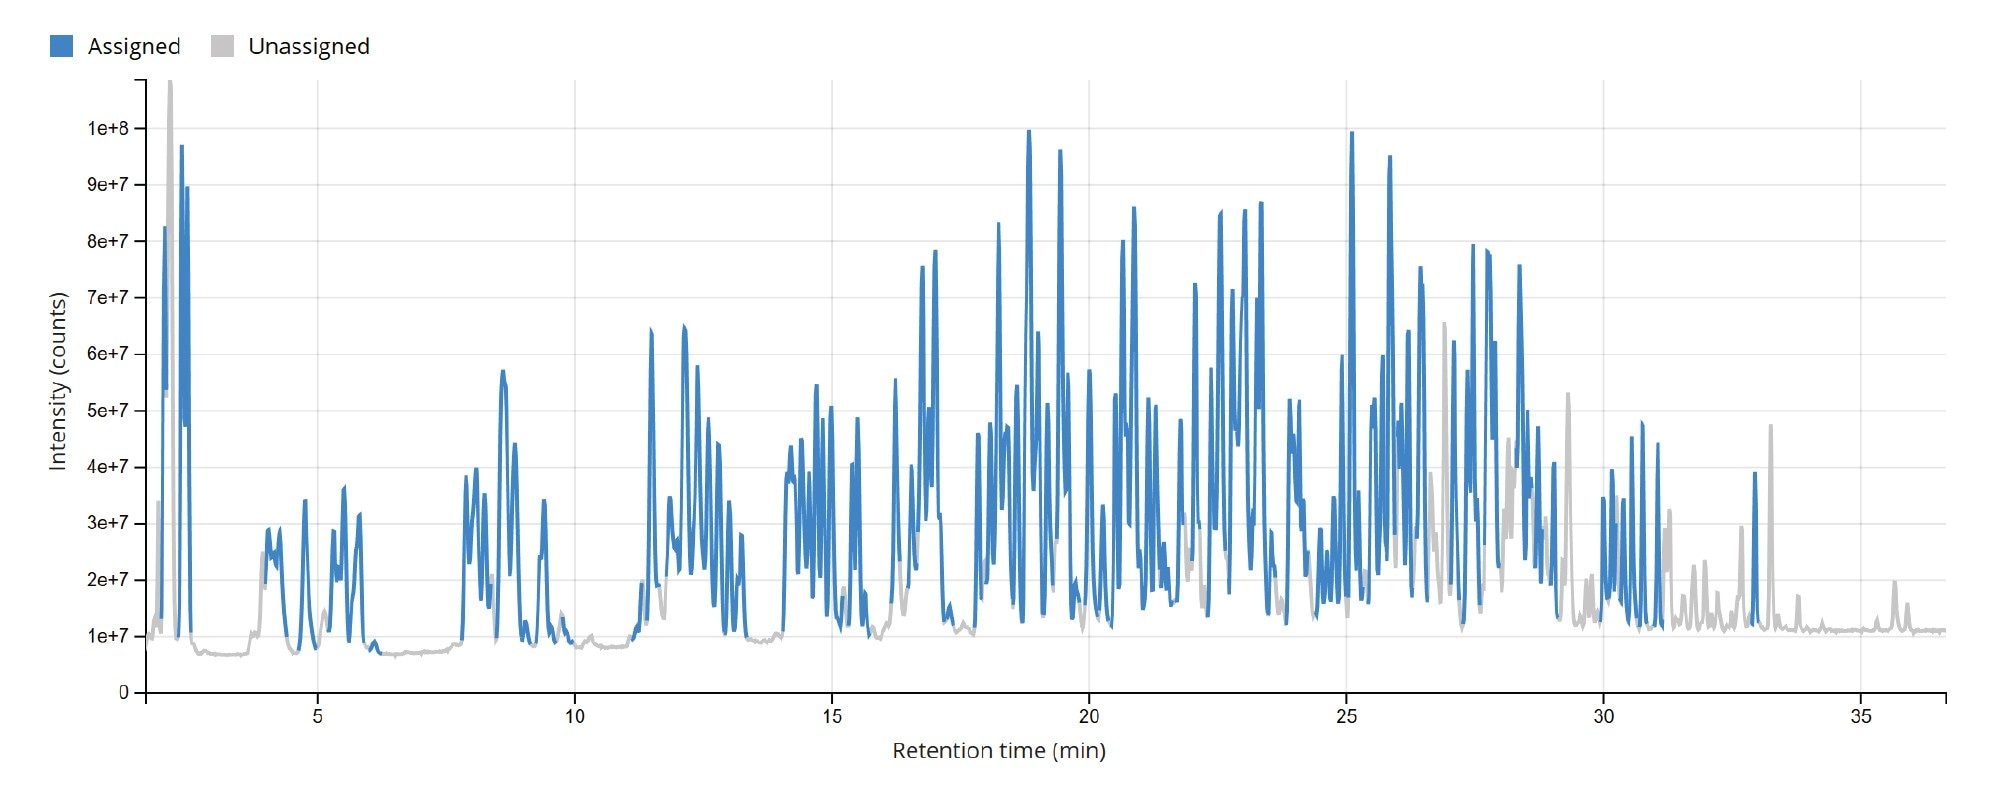
The TIC chromatogram resulting from the digestion of Fluc mRNA with RapiZyme MC1 is displayed within the MAP Sequence App v2.0, as shown in Figure 5. The blue trace indicates that the majority of the detected chromatographic signal corresponds to theoretically predicted MC1 digestion products. A portion of the results table, generated using the processing parameters in Figure 4, is shown in Figure 6. Green circles next to each digestion product denote unique identifications based on both low-energy MSE data (precursor ions) and elevated-energy MSE data (fragment ions). All digestion products were confidently identified by matching experimentally observed monoisotopic oligonucleotide precursor masses to their in-silico predicted counterparts. The average root mean square (RMS) mass accuracy across all assigned digestion products was within the sub-ppm range (<1 ppm). Additional details for each assigned precursor were accessible by clicking the corresponding sequence, highlighted in blue in the left column of the table.
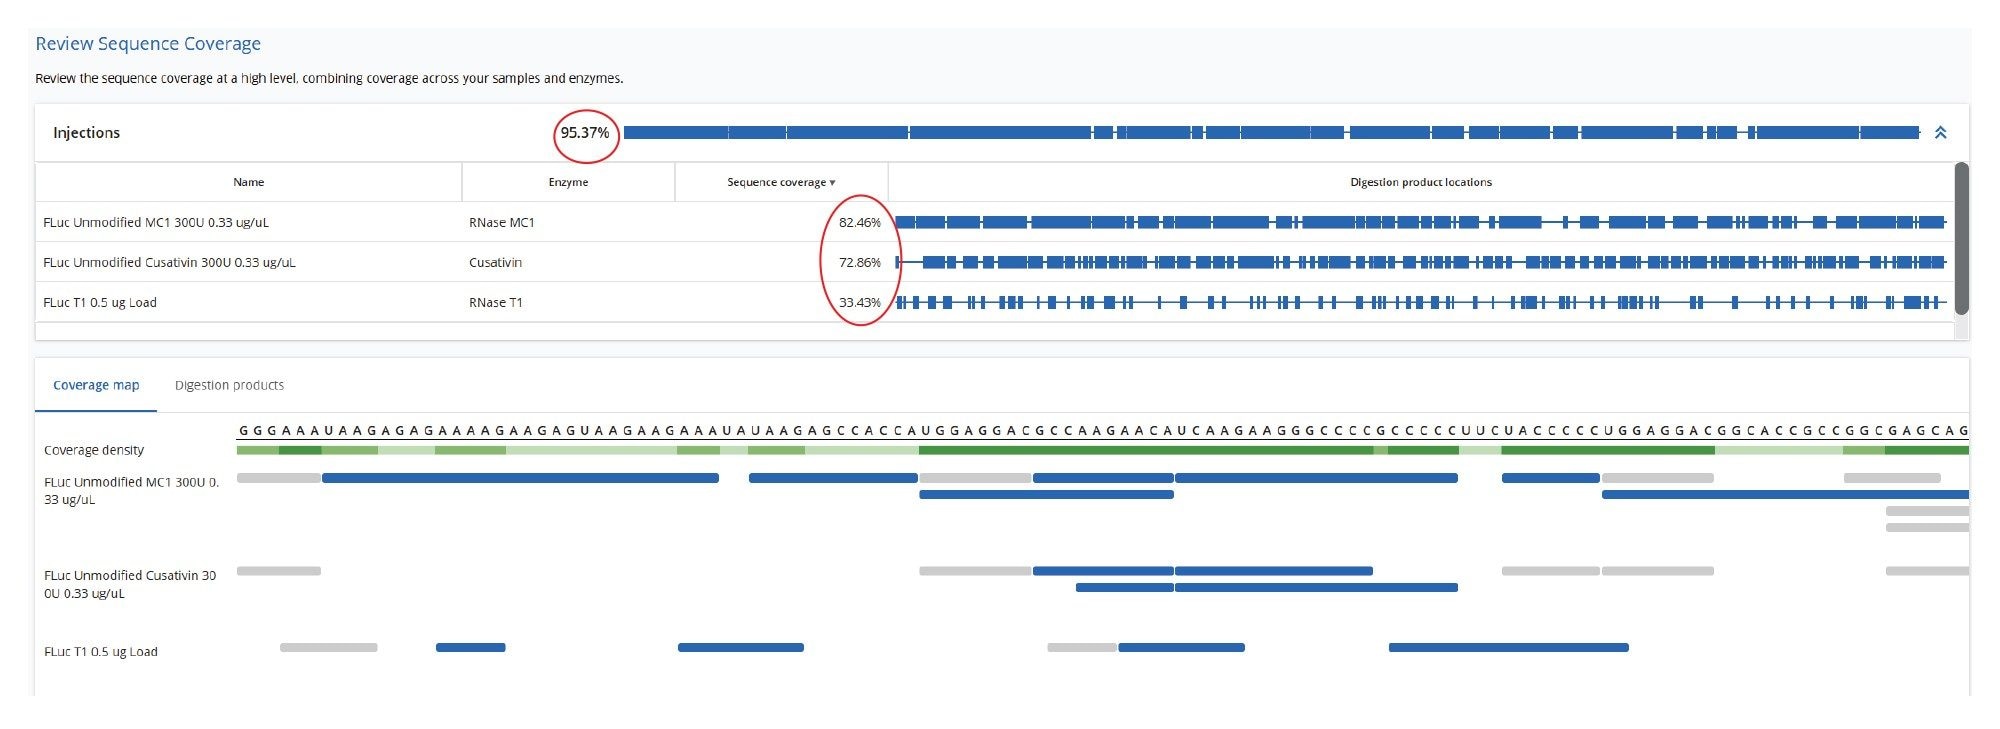
A comparison of the sequence mapping results (Figure 6) indicates that RNase T1 produced considerably lower unique coverage (~33%), compared to the MC1 (~82%) and Cusativin (~73%) digestions, due to the higher number of ambiguously assigned digestion products for RNase T1. This is a direct result of the much broader specificity of RNase T1 (cleavage after every G residue), in contrast with MC1 and Cusativin cleavage specificity, which relies on very specific dinucleotide motifs.6-9 MC1 cleaves at the 5’-end of uridine residues, with three major cleavage sites (A_U / C_U / U_U) and two minor cleavage sites (C_A / C_G). Cusativin cleaves at the 3’-end of cytidine residues, with four major cleavage sites (C_A / C_G / C_U / U_A) and three minor cleavage sites (A_U / G_U / U_U). While RNase T1 adds a linear phosphate to the 3’-end of all its digestion products, both MC1 and Cusativin produce digestion products primarily with a 3’ cyclic phosphate. With additional missed cleavages, both MC1 and Cusativin produced longer digestion products compared to RNase T1. These longer oligonucleotide products are more likely to have unique masses, reducing the chance for ambiguous assignments.
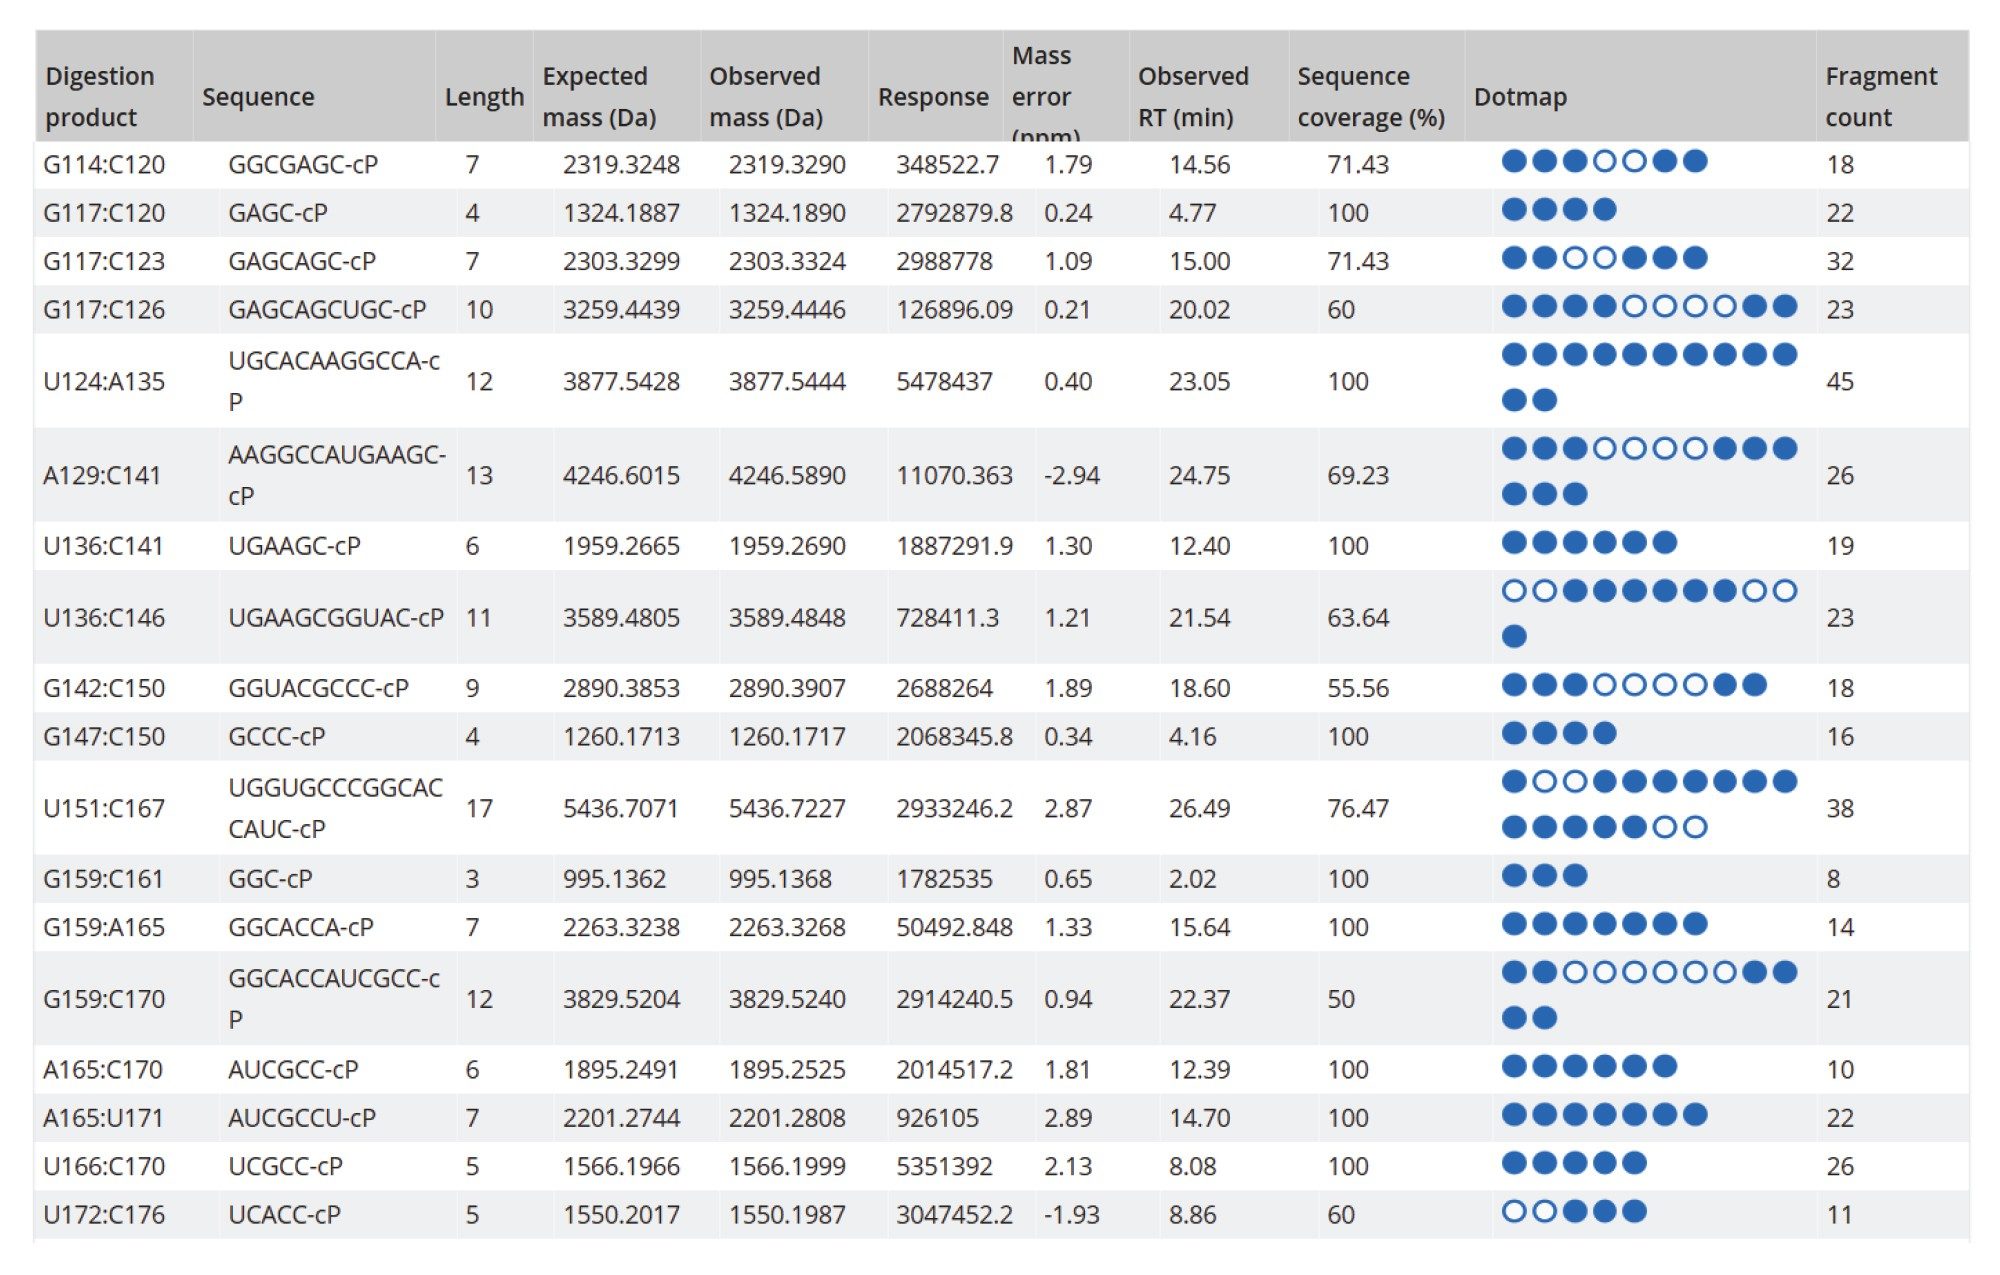
As a result of these enzymatic features, the mapping results of MC1 and Cusativin exhibit better coverage. As shown in Figure 6, the MAP Sequence 2.0 Software was able to aggregate results from multiple enzyme digest maps, producing a combined 95% sequence coverage for the Fluc mRNA. An example of the MAP Sequence v2.0 report (Figure 7), reveals that all digested product assignments for the Fluc mRNA were verified through corresponding fragment ion data. The tabular results illustrate the oligonucleotide map obtained with RapiZyme MC1 digestion. The last three columns highlight the matched high-energy fragment ions calculated as percent sequence coverage, the total number of assigned fragment ions and a simplified dot-map view for each of the assigned digested products.
Following the precursor ion search, there are three different types of ambiguous sequence assignments of digestion products: 1) repeat sequences, which refers to the digestion products with identical sequences; 2) resolved structural isomers, which refers to the digestion products that have the same monoisotopic mass and elemental composition, but different nucleotide sequences, which can be confidently assigned using acceptance criteria such as fragment ion coverage, based on their unique fragmentation pattern; 3) unresolved structural isomers, which cannot be confidently assigned, because two or more structural isomers from the same group have met the acceptance criteria.
While the first and third categories of digestion products remain ambiguous following the matching of fragment ions, the second category (which comprises ~80% of the ambiguous assignments resulting from precursor ion matching) refers to resolved structural isomers that have unambiguous sequence assignments. For these types of precursors, the fragment ion information was used successfully to confirm their sequence.
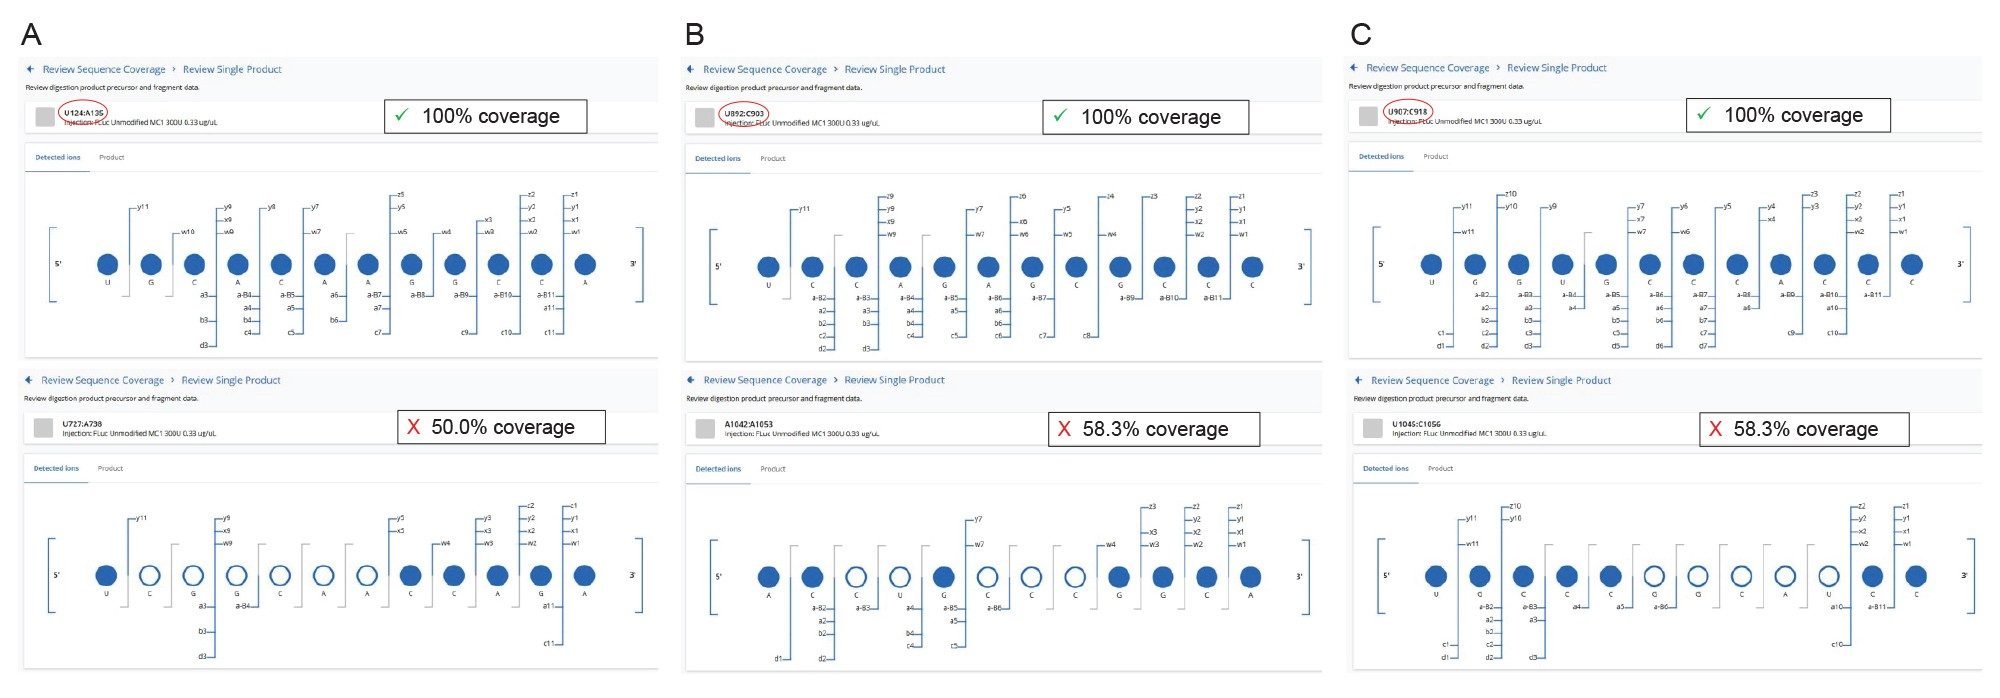
Three different examples of resolved structural isomers are highlighted in Figure 8 (A, B, C) for three 12-mer pairs of digestion products produced by RapiZyme MC1 digestion. In panel 8A, the sequence coverage of the assigned U124:A135 digestion product UGC ACA AGG CCA is full (100%), while the alternatively assigned U727:A38 digestion product UCG GCA ACC AGA had only 50% fragment ion coverage. In the second example, displayed in panel 8B, the U892:C903 digestion product UCC AGA GCG CCC achieved complete sequence coverage, while its structural isomer A1042:A1053 ACC UGC CCG GCA, had only 58.3% sequence coverage. Finally, in the third example shown in panel 8C, the U907:C918 digestion product UGG UGC CCA CCC was sequenced completely, while its counterpart, the U1045:C1056 sequence isomer UGC CCG GCA UCC, displayed 58.3% fragment ion matches. In all these highlighted examples, as in many other situations, the MAP Sequence App 2.0 automatically assigned the fragment ions detected in the elevated energy ESI-MSE spectrum to just one of the sequence isomers options, therefore increasing the overall mRNA sequence coverage.
The utility of mass spectrometry for sequence confirmation of large mRNA molecules can be deduced from these results. Combining the sequence coverage obtained from multiple RNase digestion maps provides a clear advantage over single-enzyme digestion, yielding higher overall sequence coverage. The utilization of MS1 based digested oligo assignments utilizing data independent MSE fragmentation confirms the improved assignment confidence and increased resolution of linear sequence confirmation achieved with the added fragmentation data.
Conclusion
- A new informatics workflow was demonstrated, featuring the waters_connect MAP Sequence App 2.0, which facilitated sequencing of mRNA digests using UPLC-MSE (DIA) acquired data.
- Two novel RNase T2 enzymes (RapiZyme MC1 and RapiZyme Cusativin) generated a greater population of fully digested oligonucleotides and missed cleavage oligo products, resulting in higher and more confident overlapping mRNA map sequence coverage.
- Structural isomers of digestion products were automatically differentiated by the MAP Sequence App 2.0 algorithm after using the elevated energy fragment ions to differentiate isobaric and isomeric digested oligonucleotides.
References
- Xu S, Yang K, Li R, Zhang L. Vaccine era - Mechanisms, Drug Platform and Clinical Prospection, Intl J Mol Sci Chem, 2020, 21 (18), 6582, doi: 10.3390/ijms21186582.
- Verbeke R, Lentacker I, De Smedt SC, Dewitte H. The dawn of mRNA vaccines: The COVID-19 case. J Controlled Release, 2021, 333, 511-520, doi: 10.1016/ j.jconrel.2021.03.043.
- Jackson NA, Kester KE, Casimiro D, Gurunathan S, DeRosa F. The Promise of mRNA vaccines: A biotech and industrial perspective. npj Vaccines, 2020, 5, https://doi.org/ 10.1038/s41541-020-0159-8.
- Synthetic mRNA Oligo-Mapping Using Ion-Pairing Liquid chromatography and Mass Spectrometry, Waters application note, 720007669, 2022.
- RNA CQA Analysis using the BioAccord LC-MS System and INTACT Mass waters_connect, Waters application note, 720008130, 2023.
- Sequence Mapping of sgRNA Digests: Leveraging Xevo MRT Mass Spectrometer Performance and Streamlining Data Analysis with MAP Sequence 2.0, Waters application note, 720009130, 2025.
- Jiang T, Yu N, Kim J, Murgo JR, Kissai M, Ravichandran K, Miracco E, Presnyak V, Hua S. Oligonucleotide Sequence Mapping of Large Therapeutic mRNAs via Parallel Ribonuclease Digestions and LC-MS/MS, Anal Chem, 2019, 91, 8500-8506, doi:10.1021/acs.analchem.9b01664.
- Vanhinsbergh CJ, Criscuolo A, Sutton JN, Keely M, Williamson AJK, Cook K, Dickman M. Characterization and Sequence Mapping of Large RNA and mRNA Therapeutics using Mass Spectrometry, Anal Chem, 2022, 94, 7339-7349, doi: 10.1021/acs.analchem.2c00765.
- Gau B, Dawdy AW, Wang HL, Bare B, Castaneda CH, Friese OV, Thompson MS, Lerch TF, Cirelli DJ, Rouse JC. Oligonucleotide Mapping via Mass Spectrometry to Enable Comprehensive Primary Structure Characterization of an mRNA Vaccine Against SARS CoV-2, Sci Rep, 2023, 13, No 9038, doi: 10.1038/s41598-023-36193-2.
- Tang S, Liu GY, Yan Y, Wang S, Li N. Development of a Flow Through-Based Limited Digestion Approach for High-Throughput and High-Sequence Coverage Mapping of Therapeutic mRNAs, Anal Chem, 2024, 96, 16944-17003, doi: 10.1021/acs.analchem.4c04384.
- Tunable Digestion of RNA Using RapiZyme RNases to Confirm Sequence and Map Modifications, Waters application note, 720008539, 2024.
720009171, December 2025