The red kite is primarily a scavenger that feeds on worms, small mammals, and carrion. Its feeding habits make it particularly susceptible to pesticide poisoning, either accidental – when it feeds on creatures that have previously been killed by pesticides; or intentional – when people spike pesticides into carrion, either to kill animals such as foxes and crows, or to target the birds themselves.
In the U.K., the red kite is protected under the Wildlife and Countryside Act of 1981, and, under Schedule 1, Part I, of this act, they are “protected by special penalties”.3 The birds are afforded additional, wider protection in Scotland, as a result of the Nature Conservation (Scotland) Act of 2004.4 If red kite carcasses are discovered by police or wildlife protection officers, and pesticide poisoning is suspected, they are often brought to SASA (Science and Advice for Scottish Agriculture – a division of the Scottish government). Here, samples are analyzed to identify the cause of death and, if necessary, the particular type or types of pesticide used.
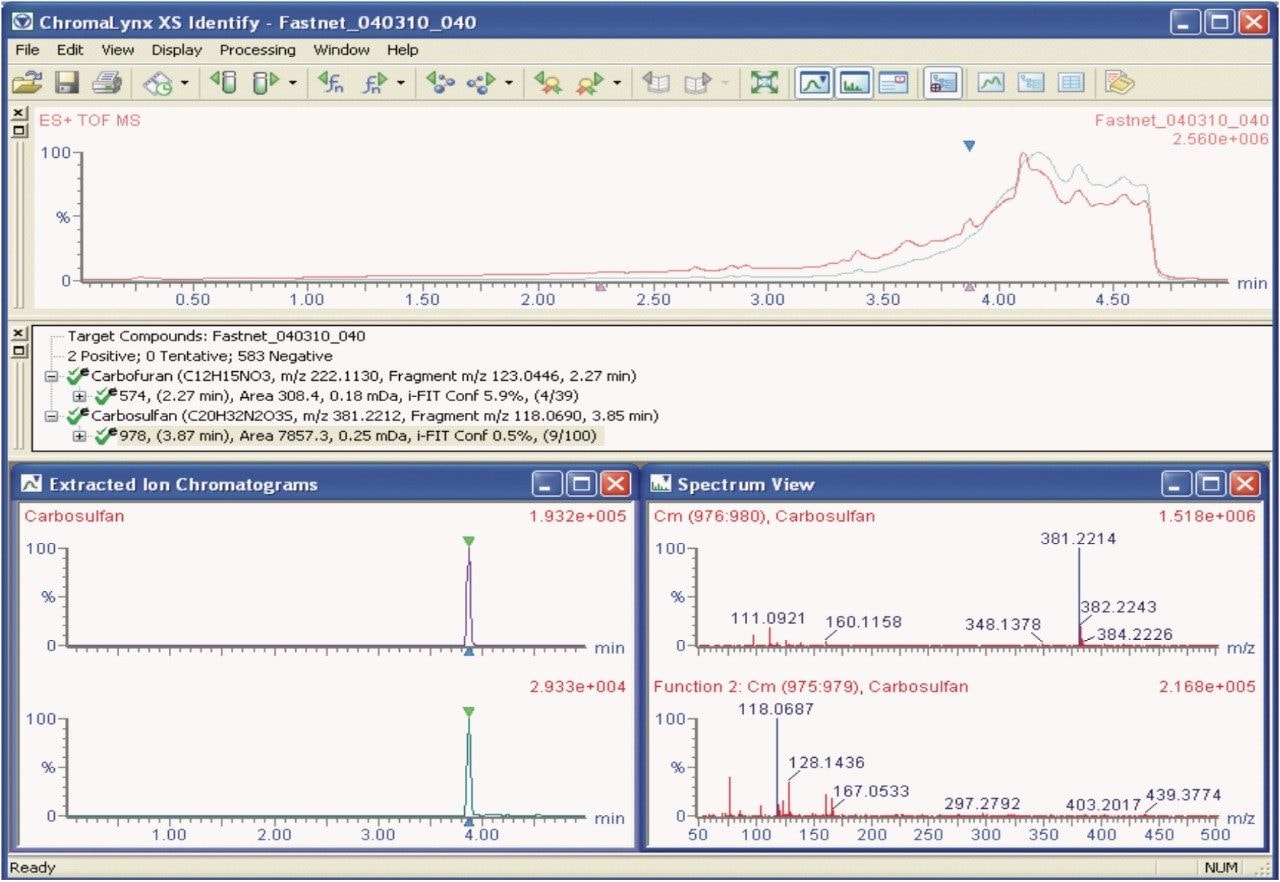
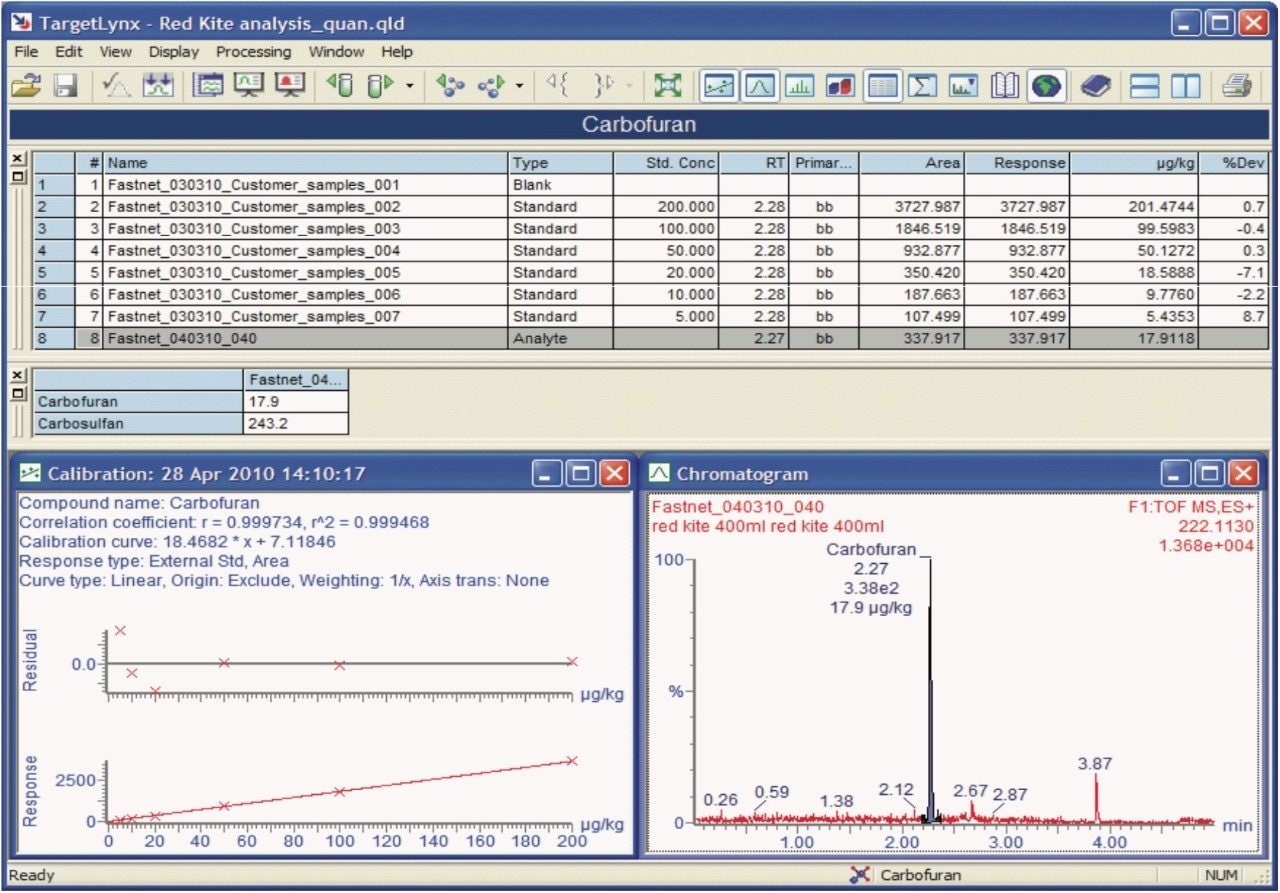
This application note describes the use of Waters ACQUITY UPLC coupled with Xevo G2 QTof, along with POSI±IVE Software and the MassFragment tool, to screen samples from the gullet of a red kite carcass suspected of poisoning by pesticides, and to identify which pesticides were used. We were able to demonstrate the unequivocal detection and identification of the pesticide poisons ingested by the red kite.