Monitoring System Performance With System Suitability and Control Charts in Empower
Dies ist ein Applikationsbericht, der keinen detaillierten Abschnitt zu Versuchen enthält.
Abstract
System Suitability is a series of injections you can make to help you determine the suitability and effectiveness of your chromatographic system before use. System Suitability requirements must pass to guarantee the quality of the sample run results. System Suitability injections also enable you to monitor method performance over time.
Introduction
Empower™ Chromatographic Data System (CDS) can assess System Suitability standards interactively, checking the performance of standards against your System Suitability requirements in an automated, unattended manner. Upon failing the requirements, Empower CDS can be configured to continue the sample run, abort the sample run, or reinject the standards. Subsequently, System Suitability parameters can be plotted on control charts for data trending. Data trending allows users to monitor method performance and take corrective action before out-of-specification products are produced.
The functionality of interactive System Suitability and control charts are highlighted through this case study below:
Six System Suitability standards are analyzed at the start of the sample run and, to ensure that the system is performing well, the analyte’s Retention Time must fall within ±3% of the target Retention Time.
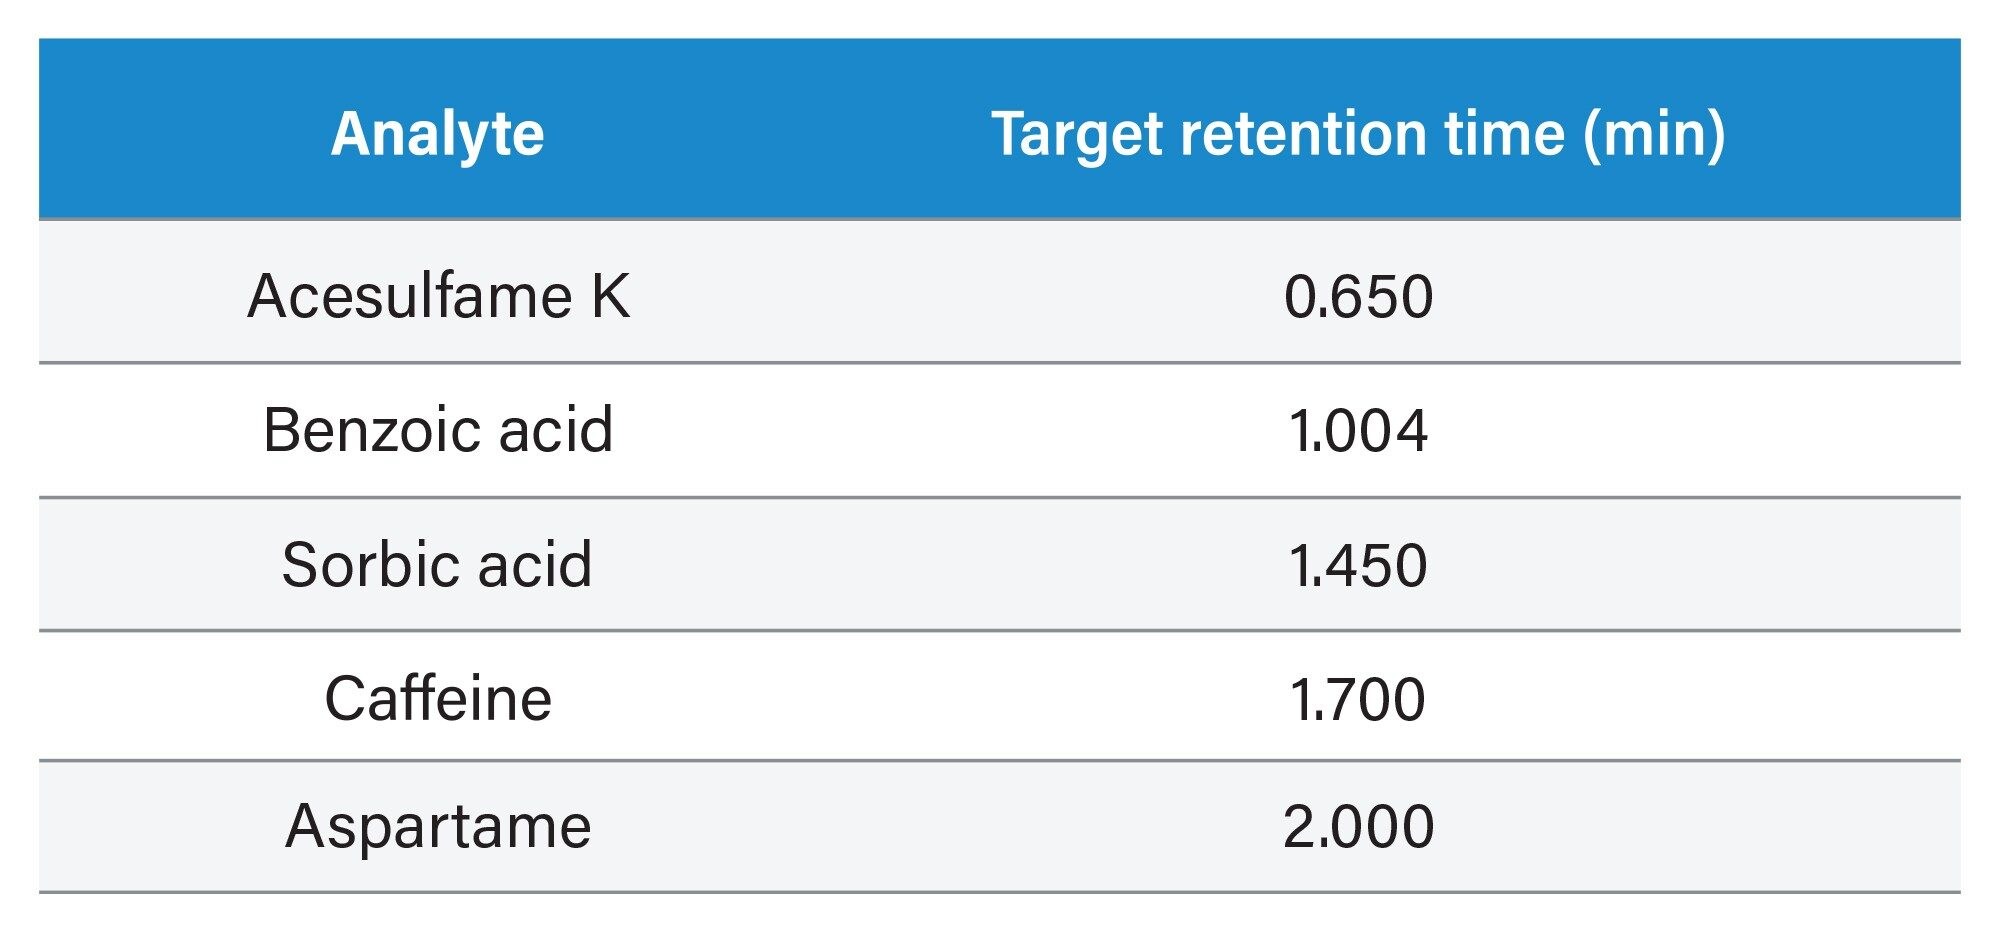 Table 1. Table of target Retention Time of the various analytes.
Results and Discussion
In the Processing Method
First, System Suitability criteria are set up in your Empower Processing Method through the Limits Tab. Click on the target component and select the parameters that you wish to monitor in the Suitability Limits table. For this example, the target Retention Time and an error % of 3% for all components has been set.
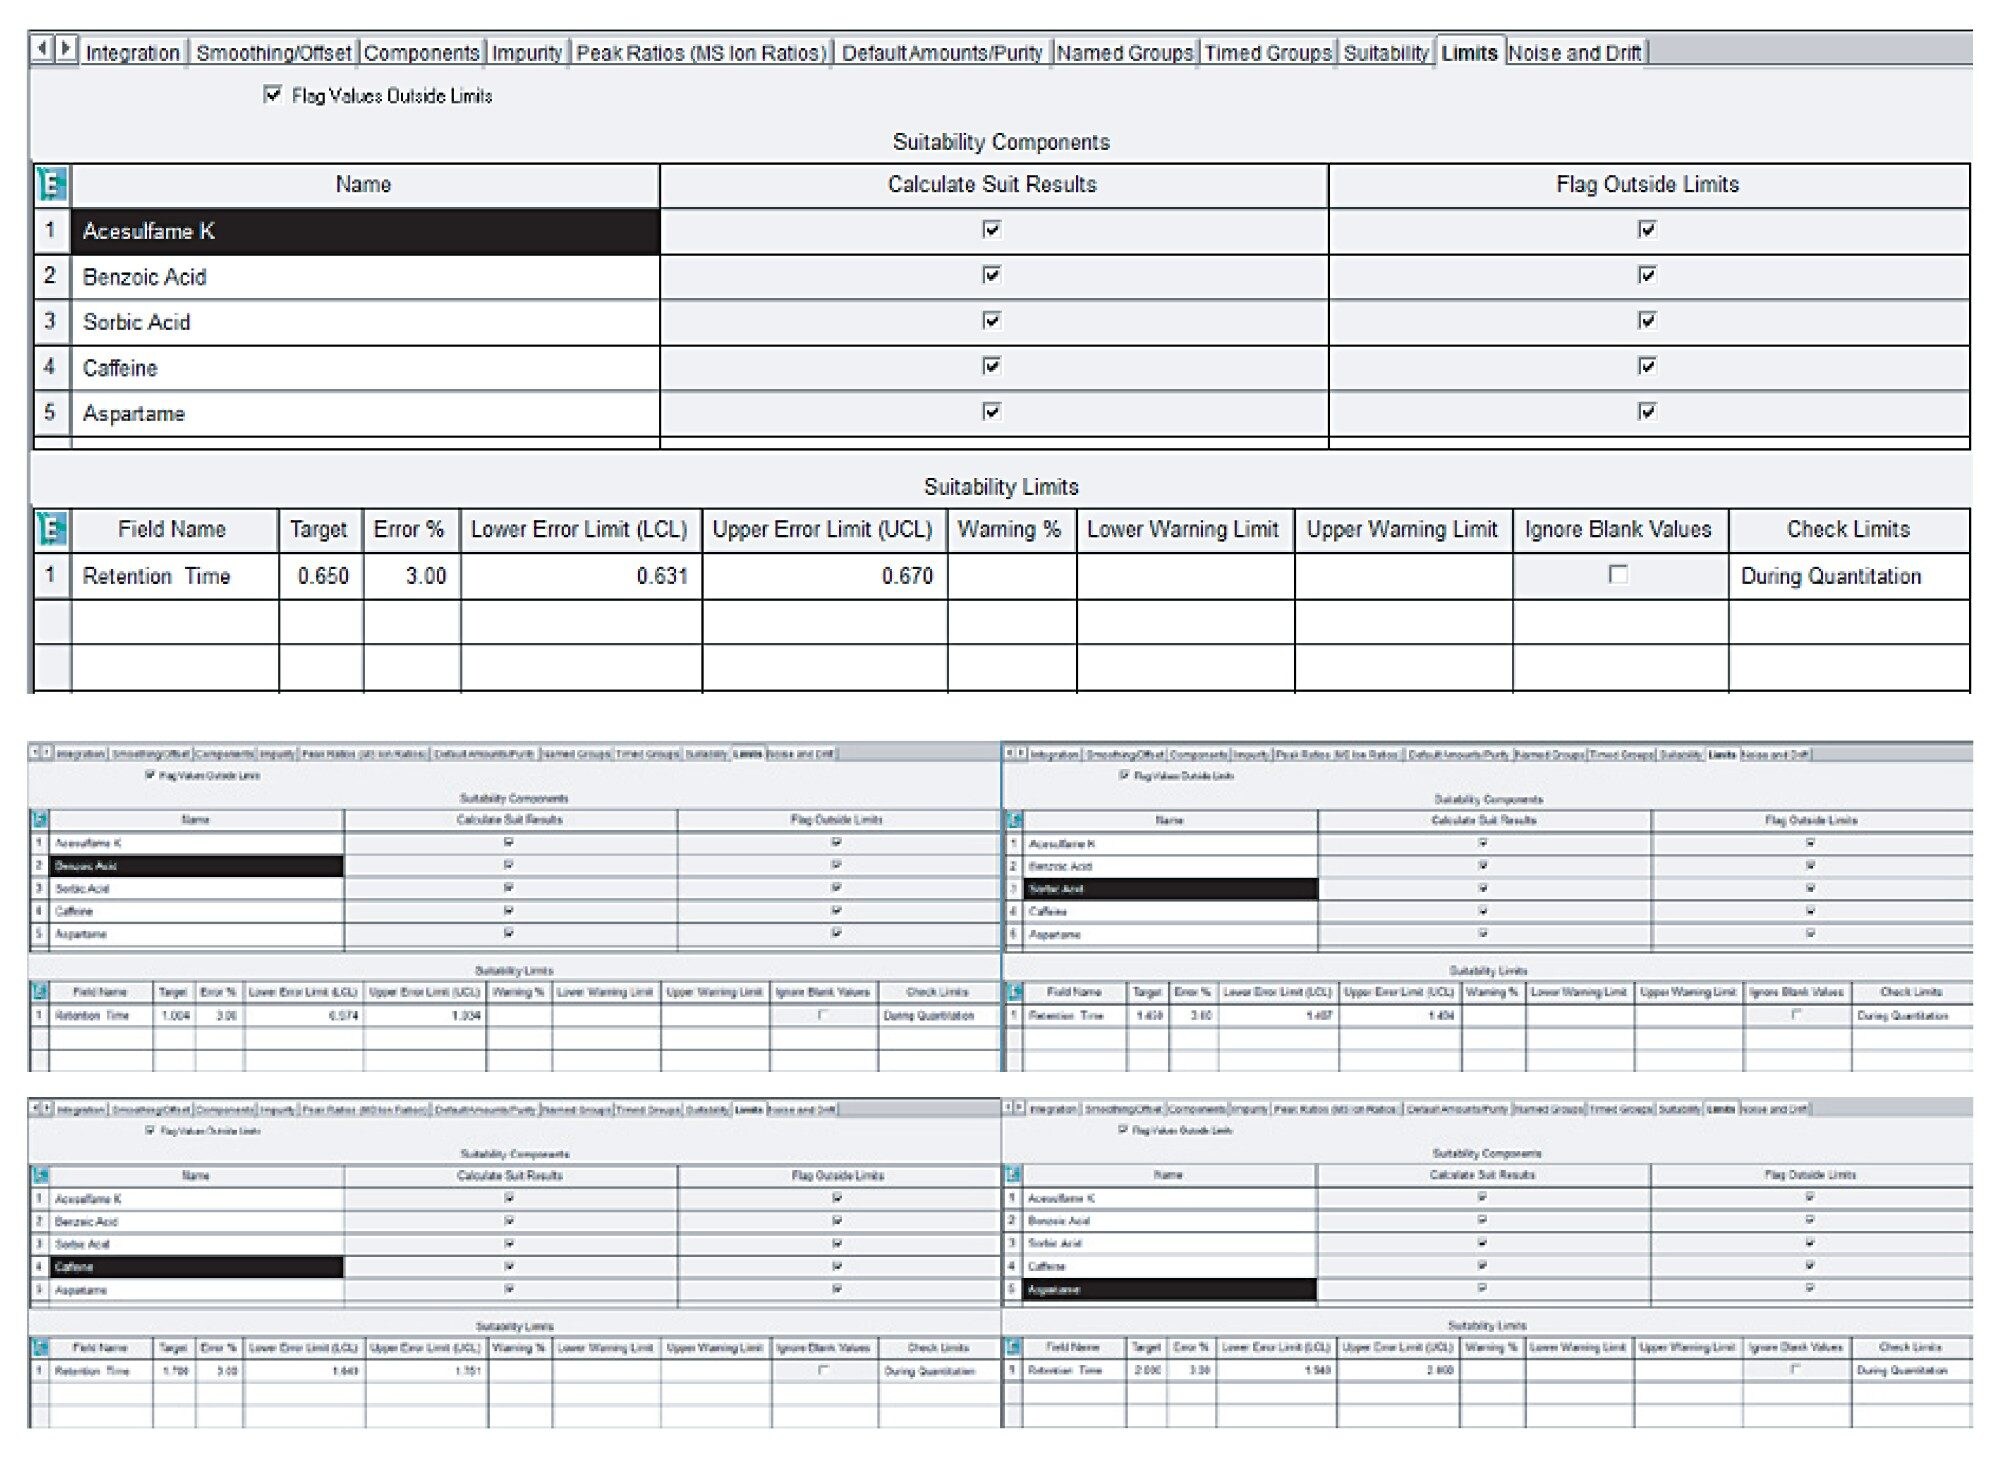 Figure 1. Click on each of the target component and select the parameters you wish to monitor in the Suitability Limits table.
In the Method Set
The Processing Method is added into the Method Set to allow Empower to process and evaluate your System Suitability criteria during the run.
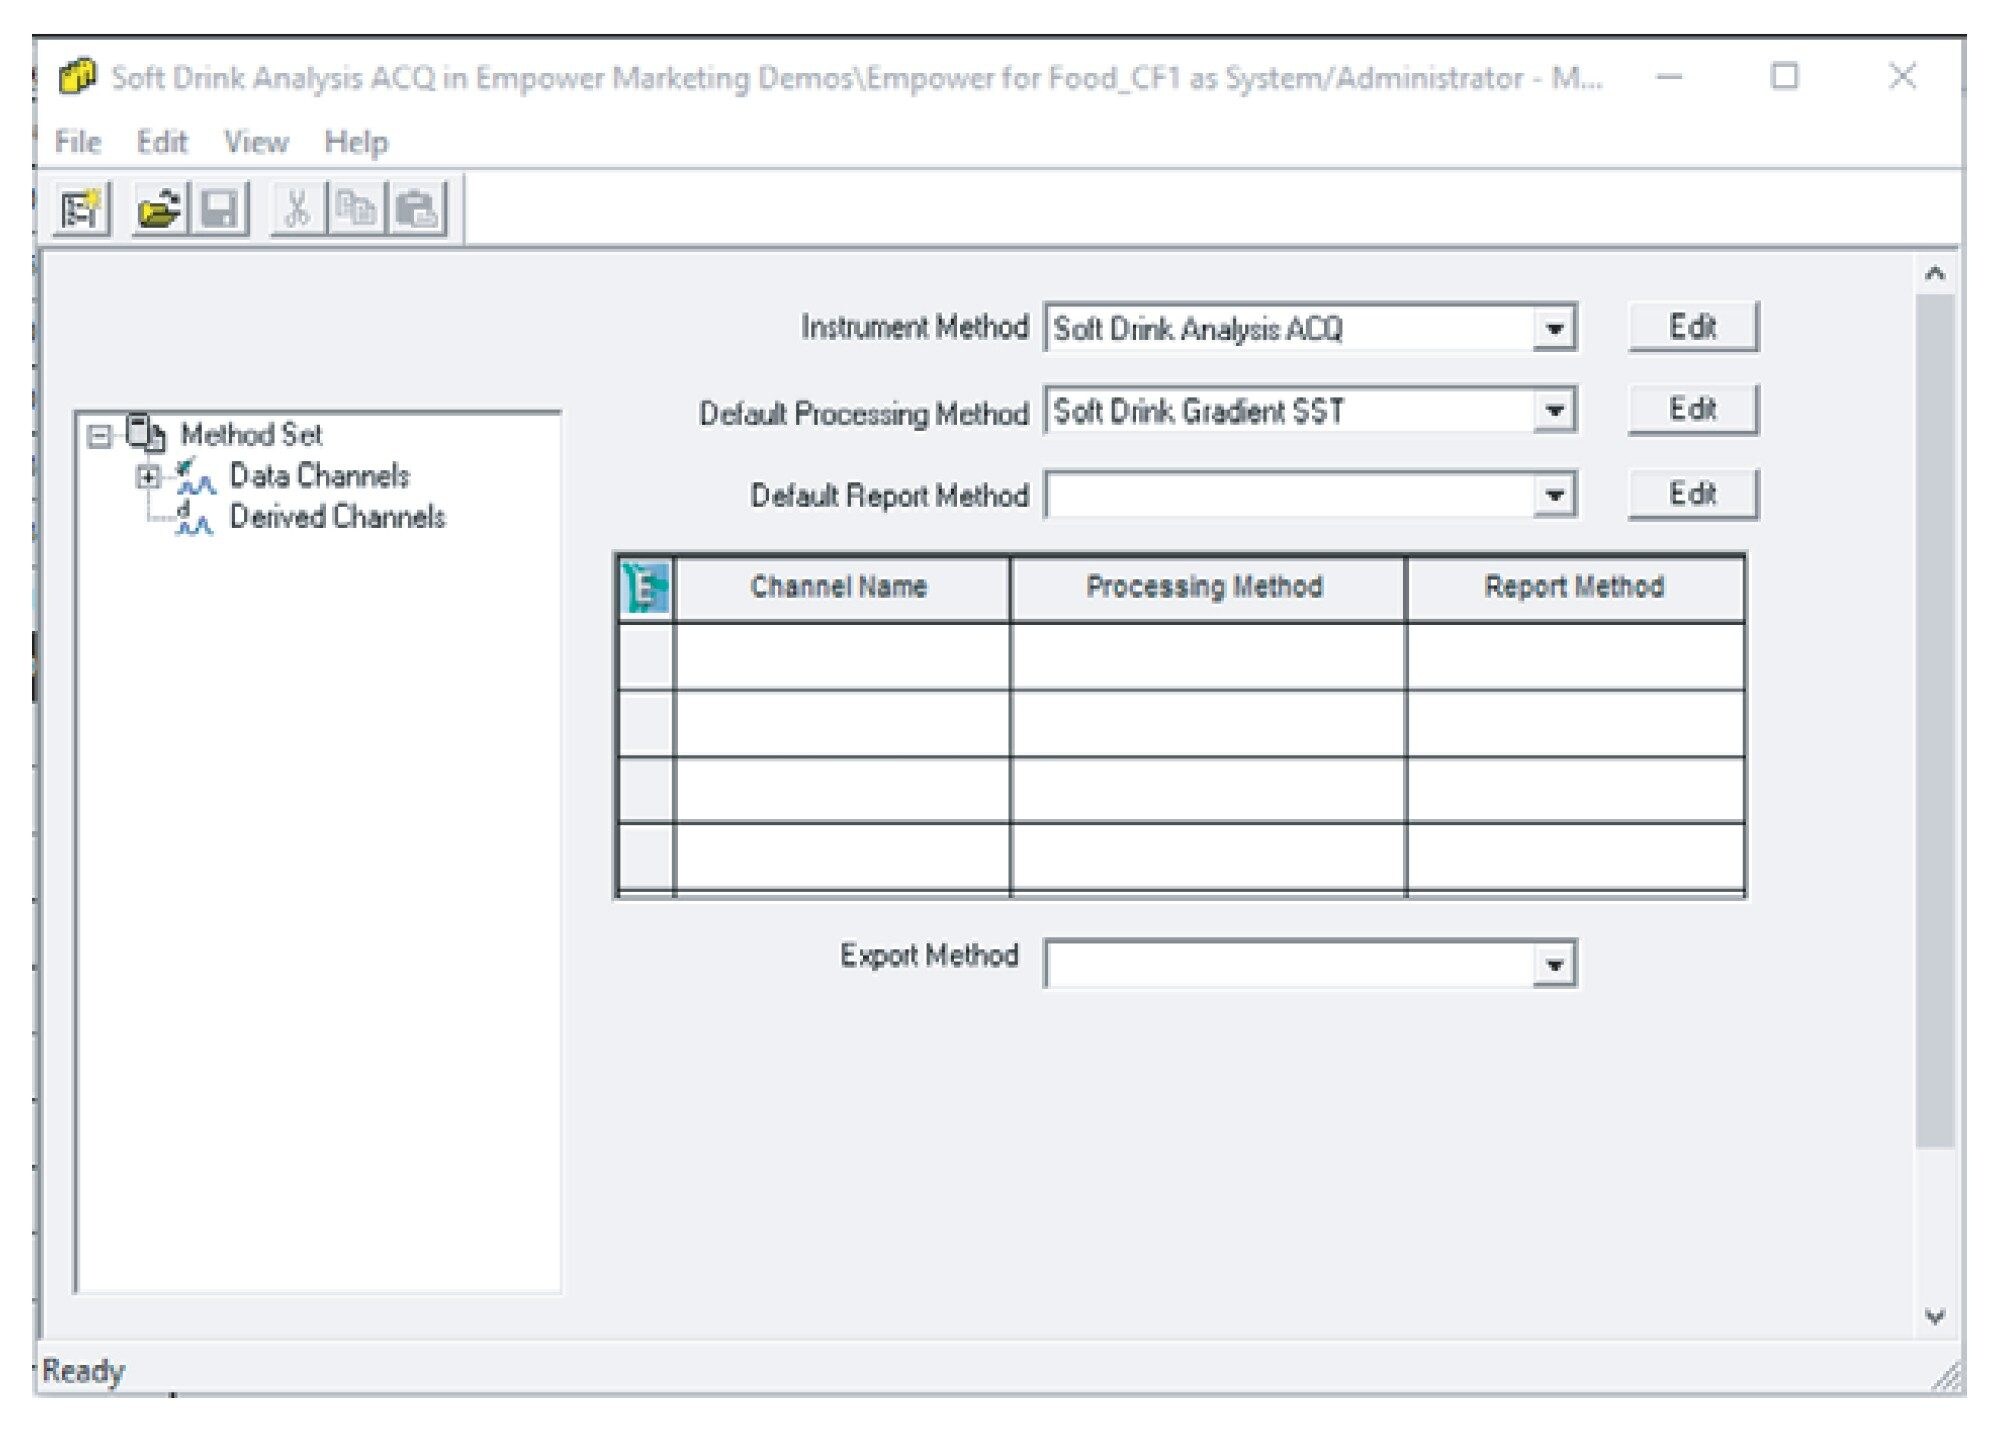 Figure 2. Adding the Processing Method to the Method Set to allow for automated processing.
In the Run Samples Window
After your Sample Set is set up, the Run Mode and Suitability Mode are configured to enable interactive System Suitability. In the Run Mode, choose “Run Only”, “Run and Process”, or “Run and Report” for online data processing. “Run and Process” and “Run and Report” will result in the generation of results. Here, select “Run and Process”.
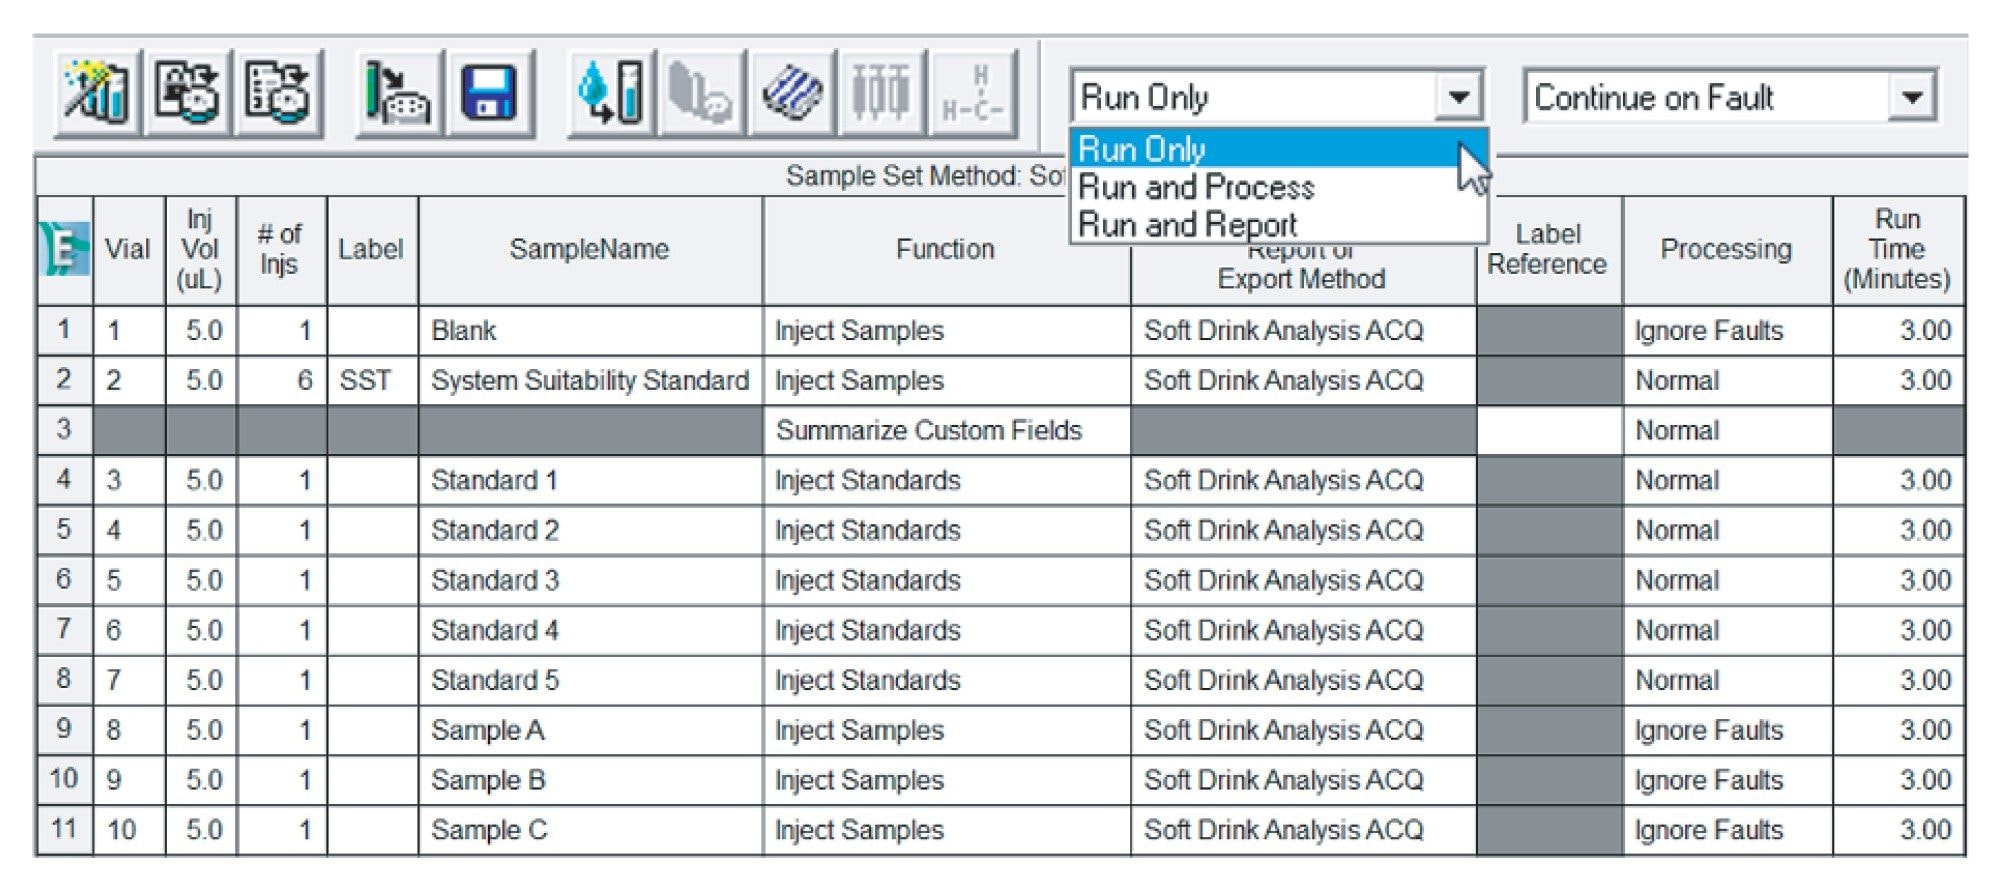 Figure 3. Select the Run Mode for online data processing.
The Suitability Mode allows you to configure Empower to take actions to continue the run, stop the run or reinject samples, in the event of System Suitability faults. Faults happen when the injection fails to meet the limits set. For this example, we will choose “Stop on Fault”.
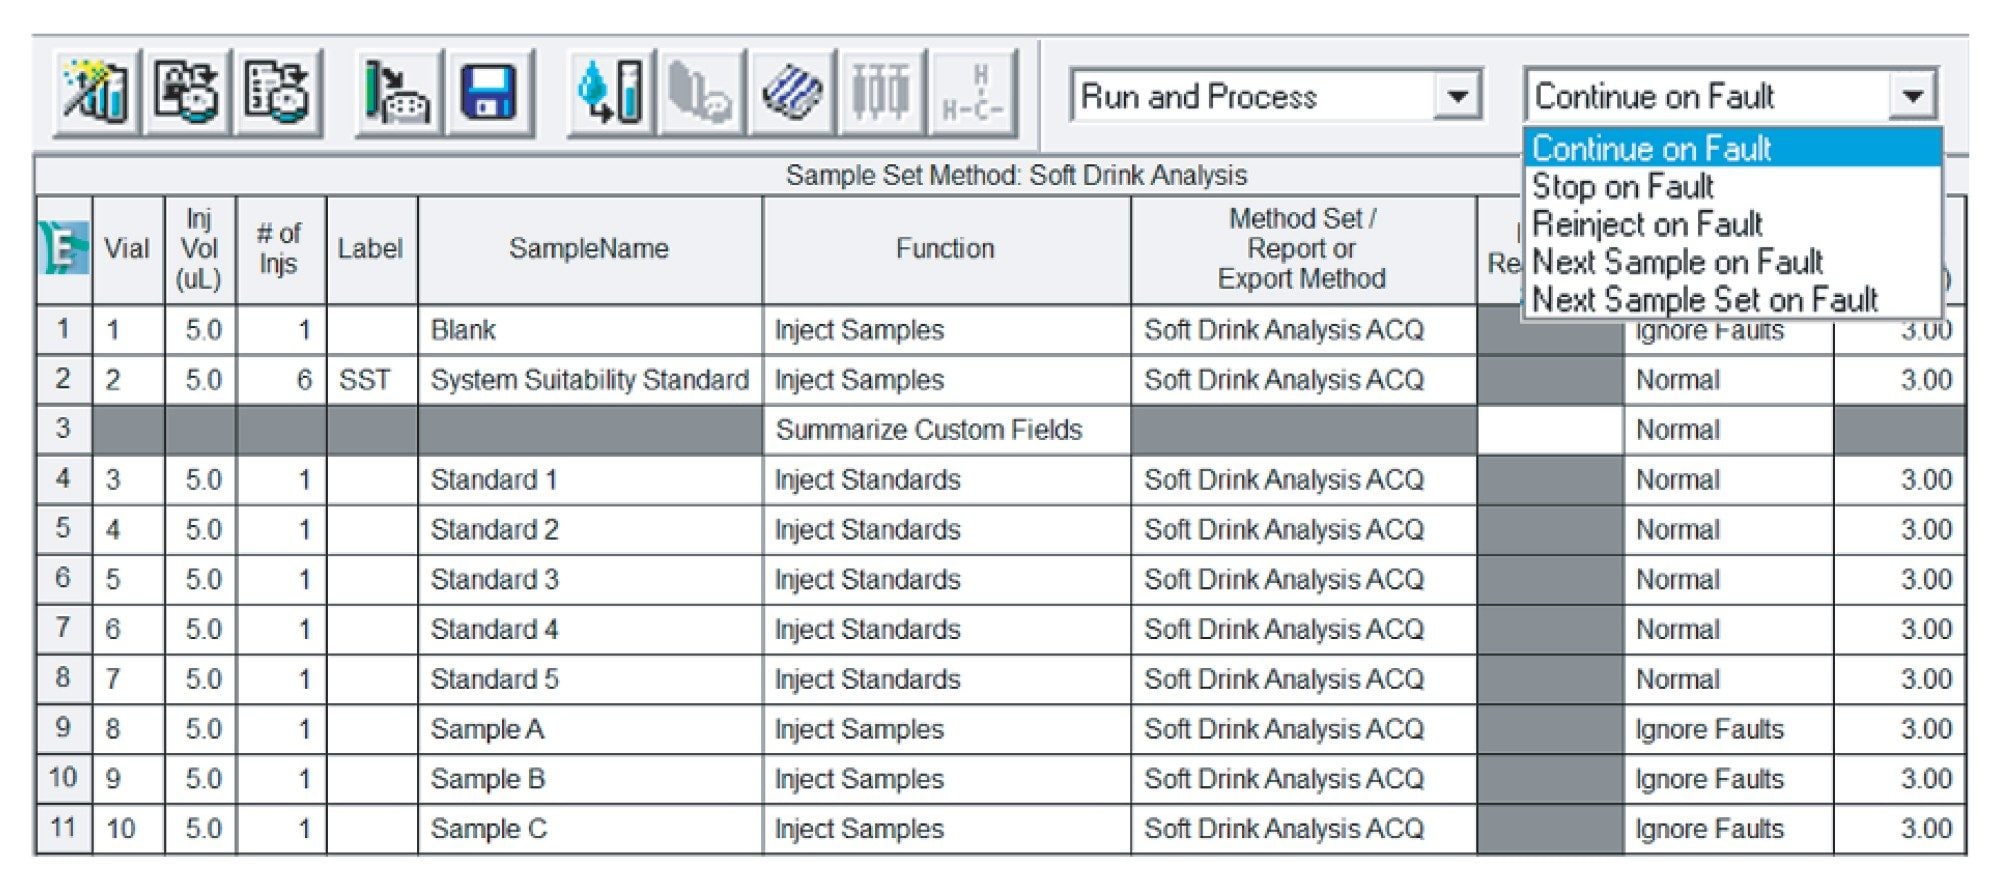 Figure 4. Select the Suitability Mode to configure Empower to take specific actions in the event of a System Suitability failure.
Next, the System Suitability standards are analyzed. Empower continues your sample run if System Suitability limits pass or aborts the run if System Suitability limits fail.
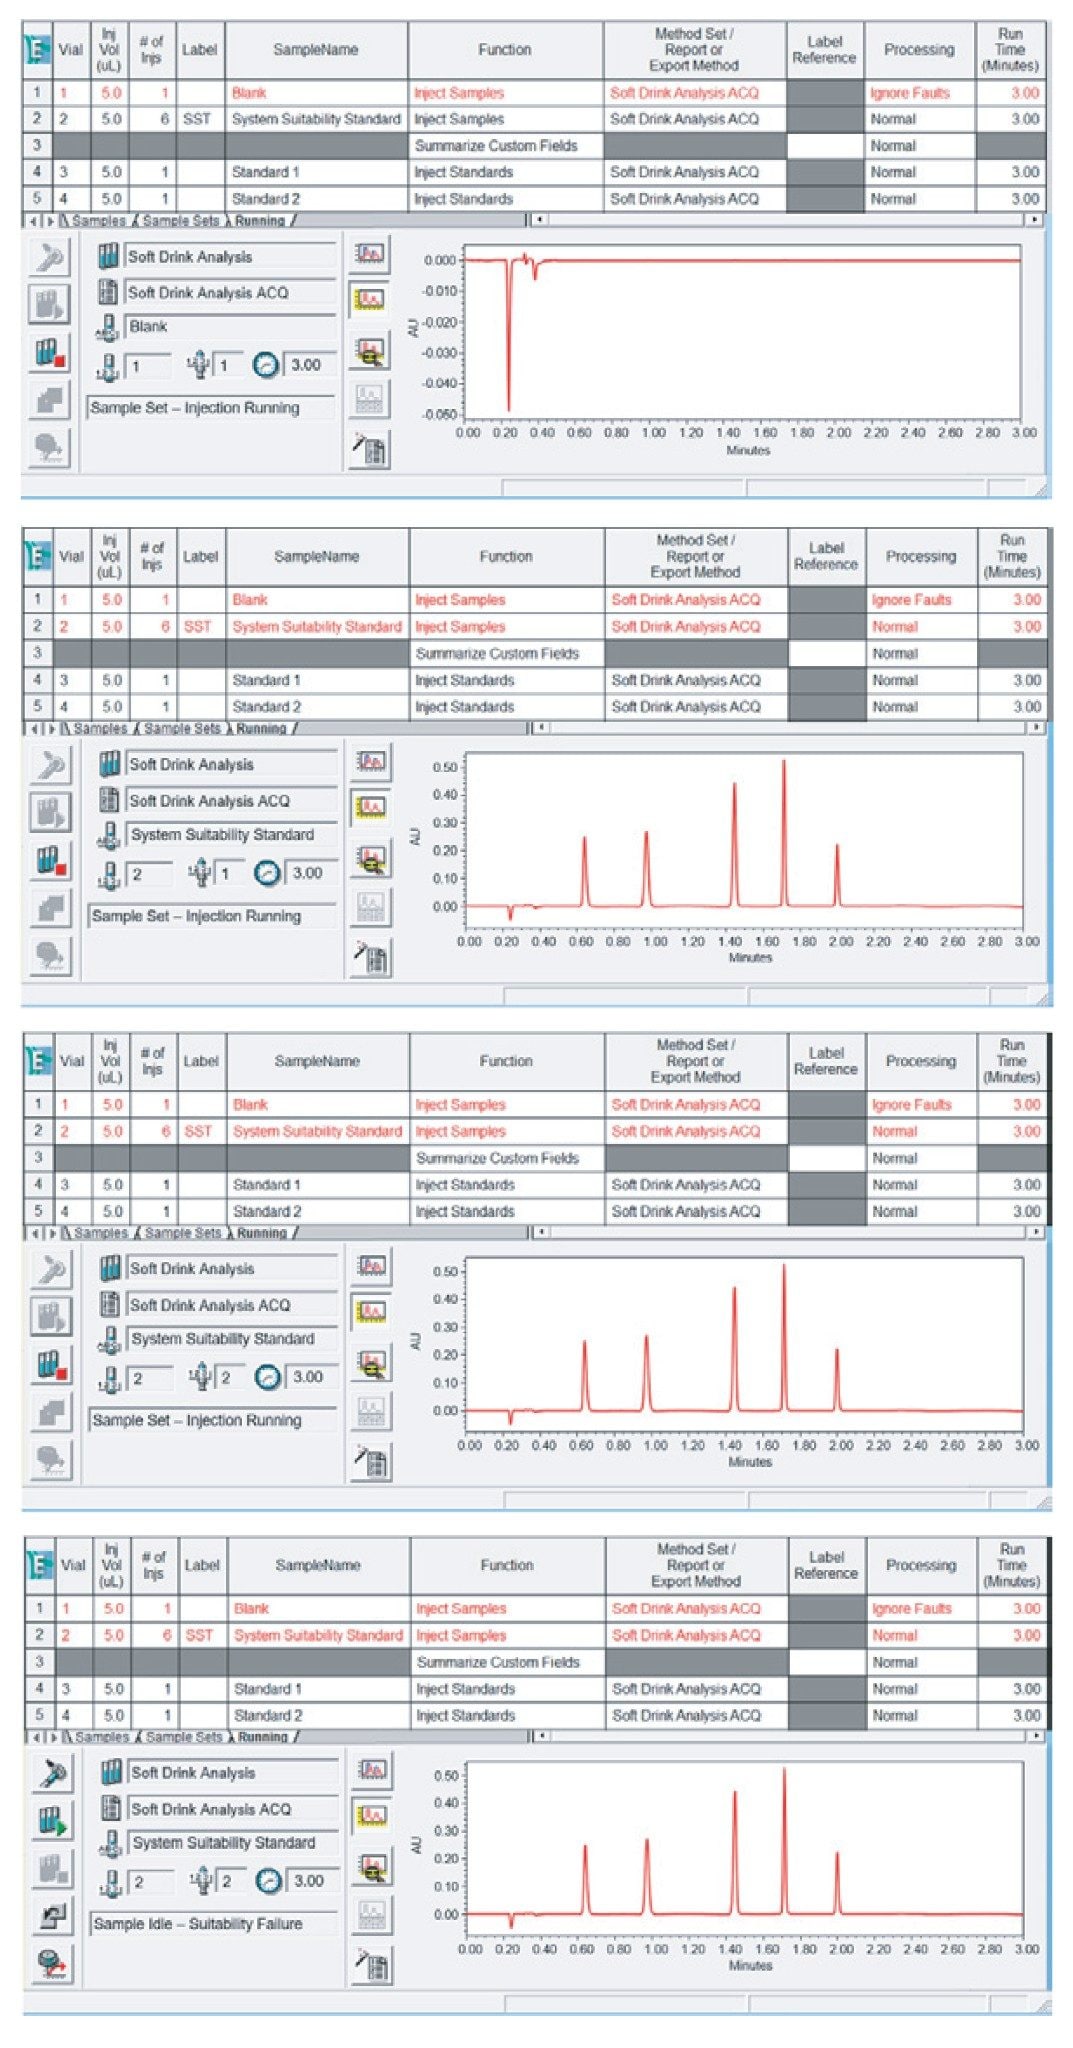 Figure 5. Empower continues the sample run if System Suitability limits pass or aborts the run if System Suitability limits fail. This allows for an unattended, hands-free operation.
Upon detecting a System Suitability fault in the second injection of the System Suitability standard, Empower aborts the run and indicates a suitability failure. You can review possible faults in the Review window.
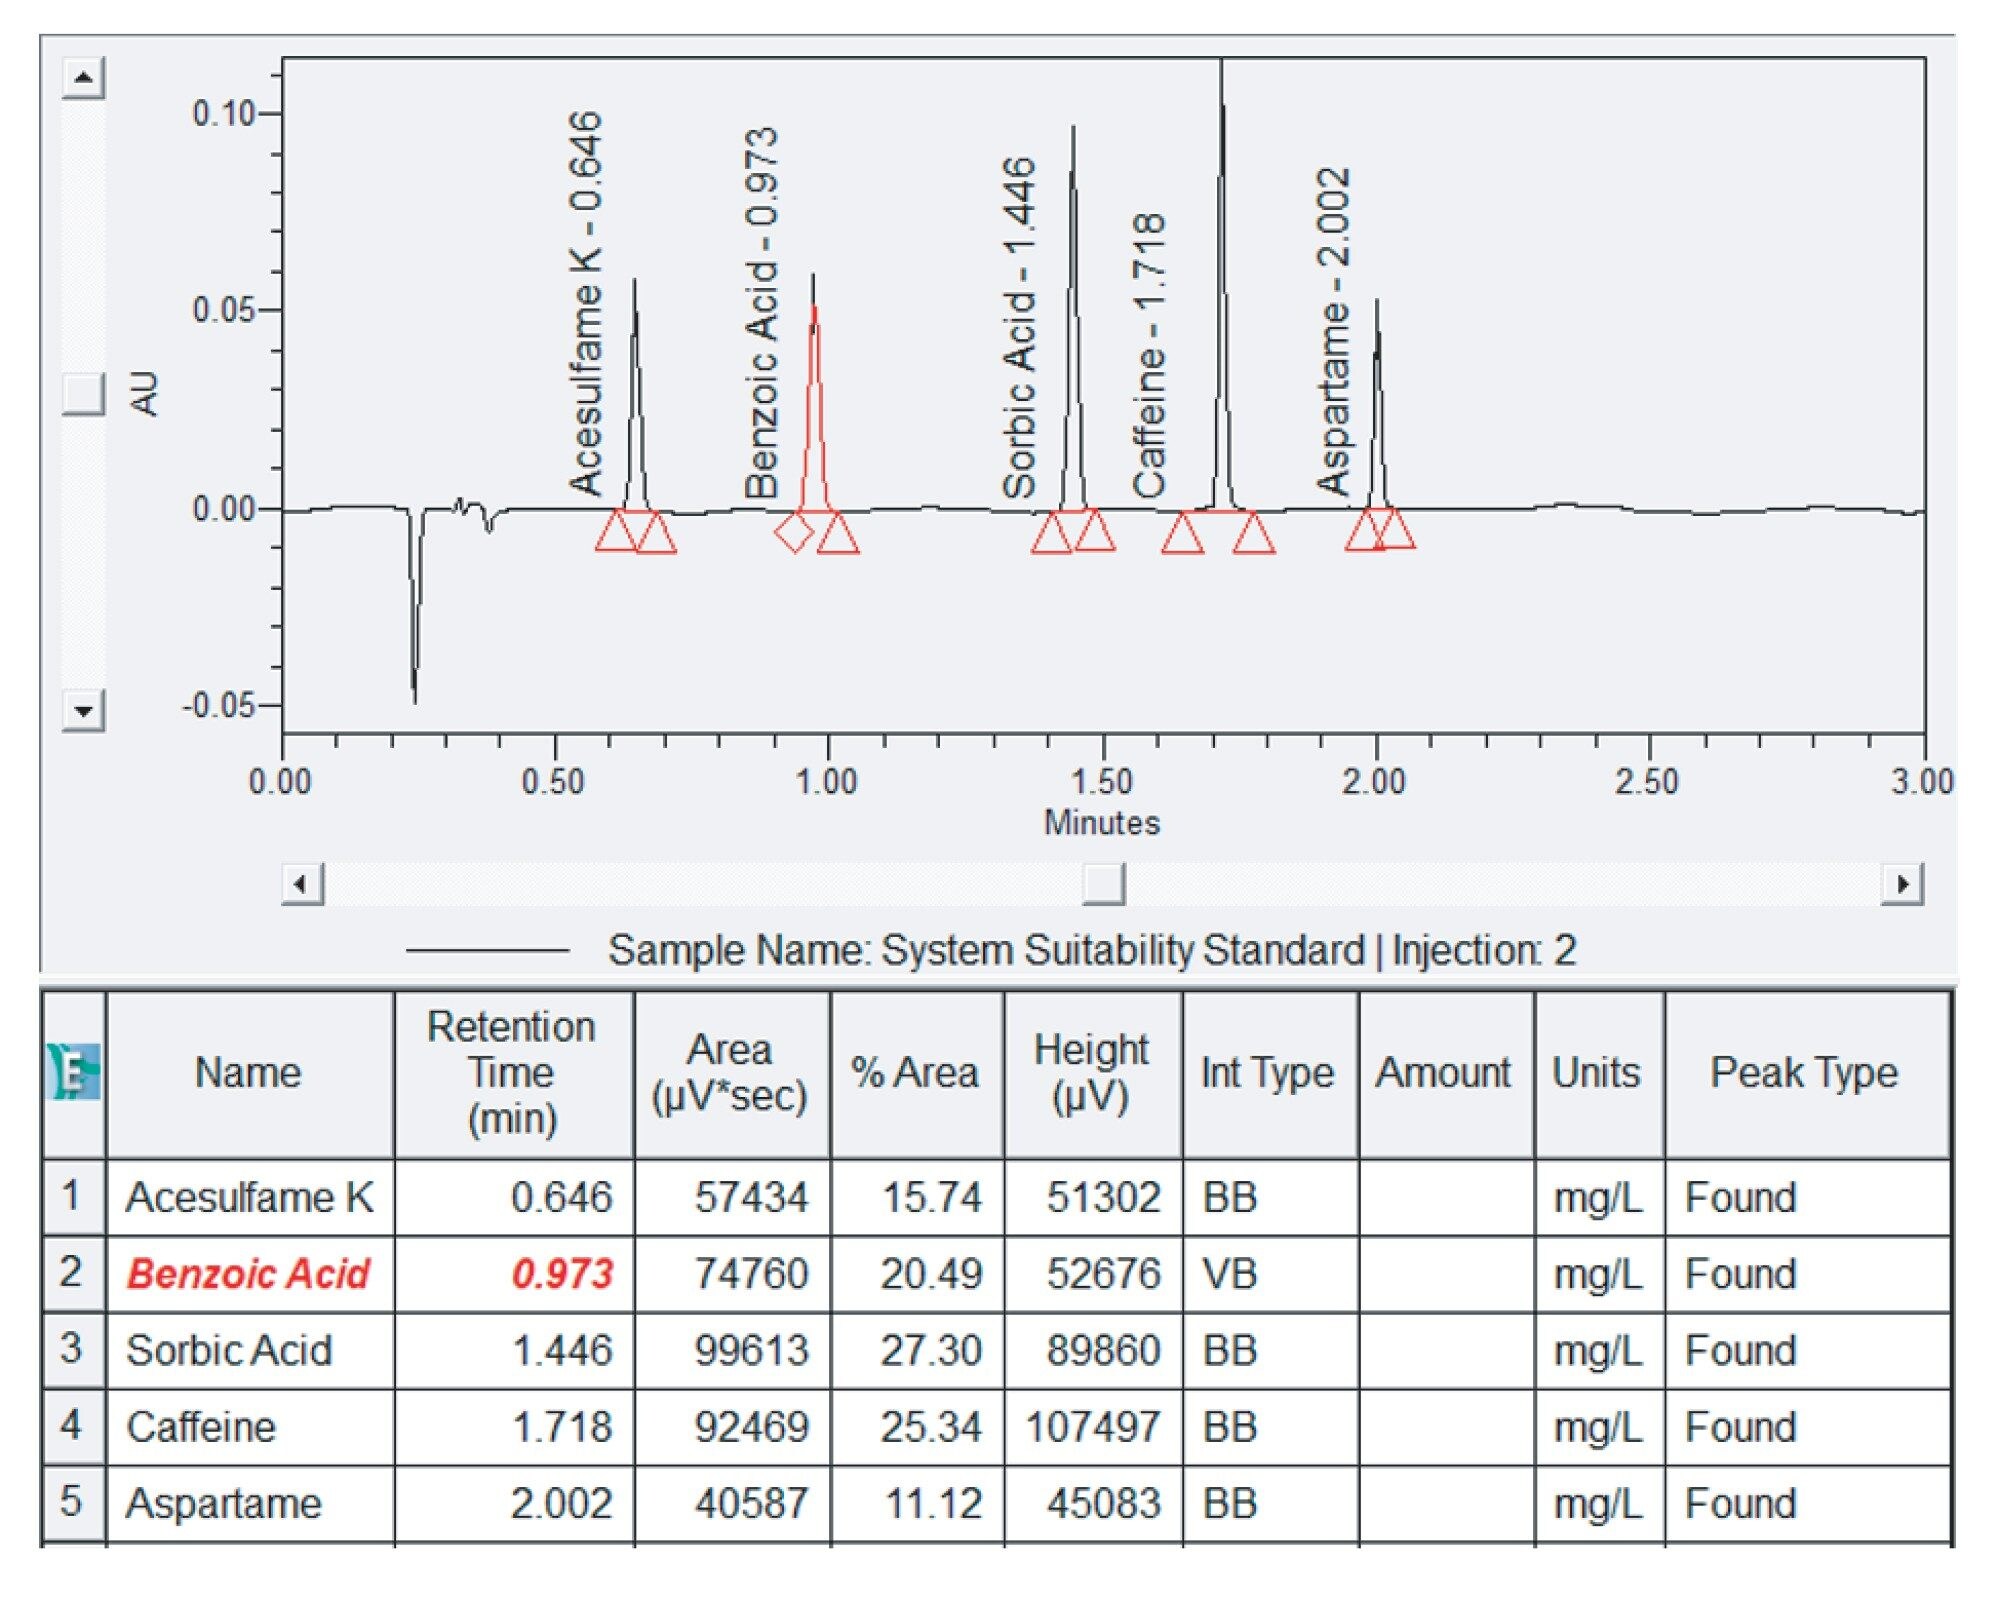 Figure 6. Review window displaying System Suitability failure for Benzoic Acid.
System Suitability faults are automatically highlighted in red, bold, and italics for you. Here, it is observed that Benzoic Acid’s Retention Time of 0.973 min falls outside the ±3% error range of 0.974 to 1.034 min.
Data Trending in Publisher
Benzoic acid’s Retention Time can be trended across multiple injections to determine if there is a drift towards an out-ofspecification result. To observe the data trending across multiple results, a Summary Report is required. This can be set up through Method Properties. Access Method Properties through the Edit Menu and select Method Properties. Here, we choose a Summary by All report.
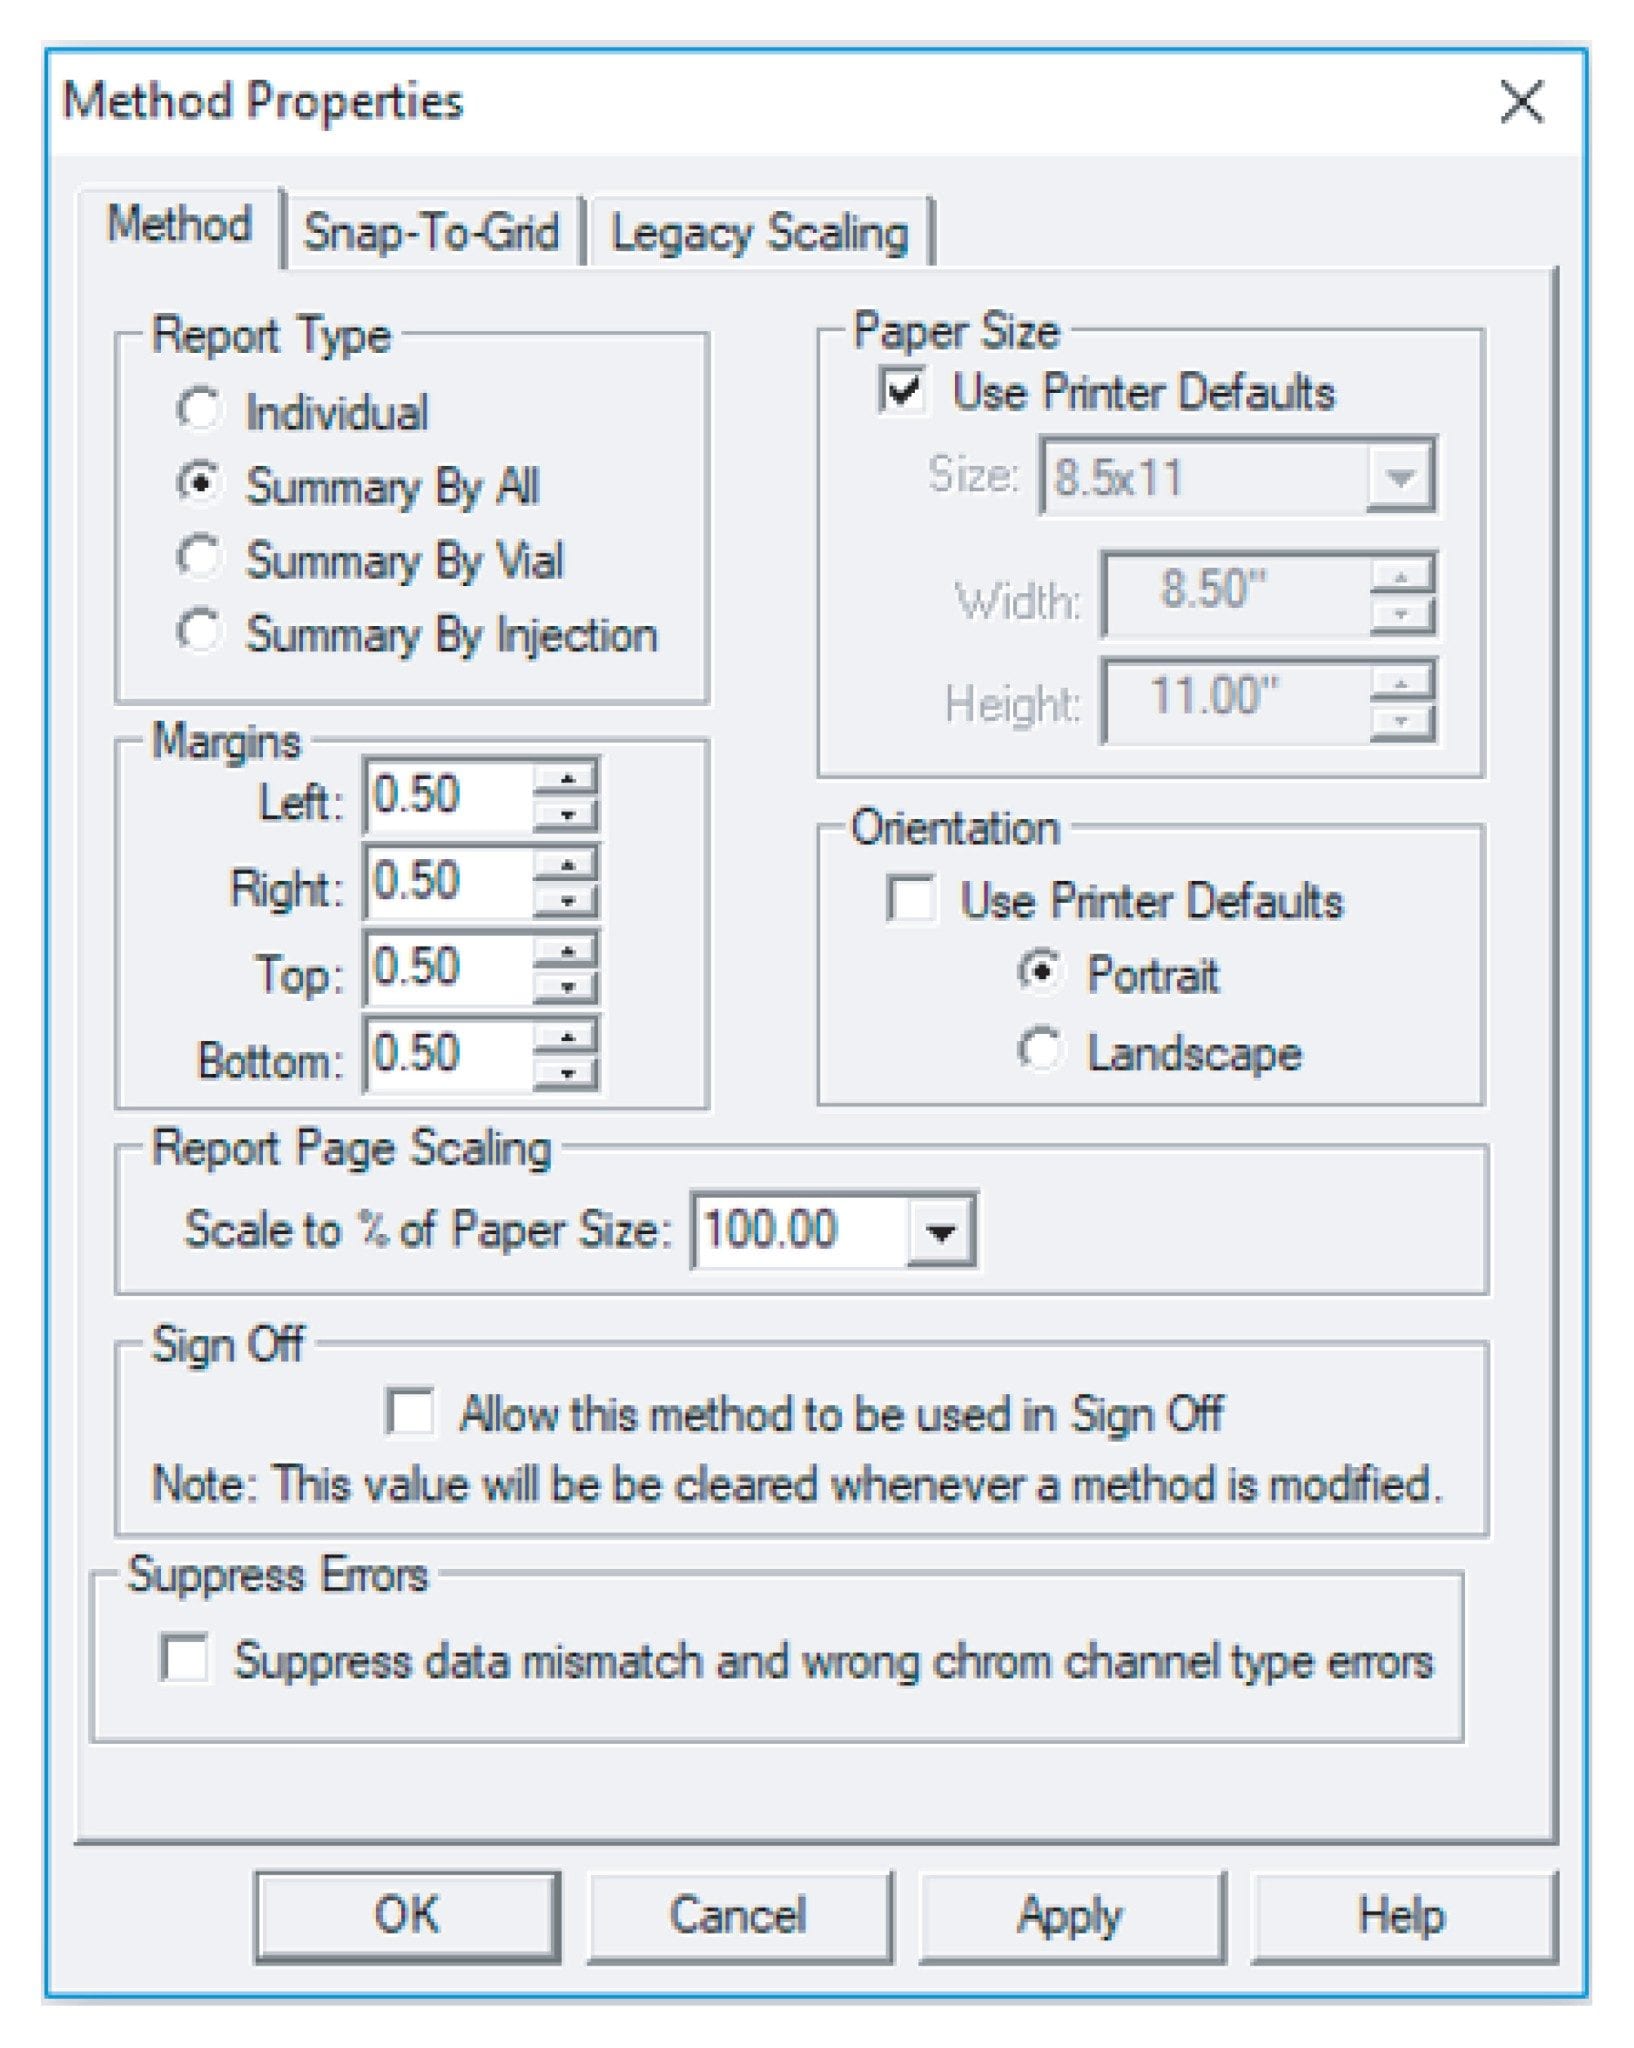 Figure 7. Method Properties in Report Publisher.
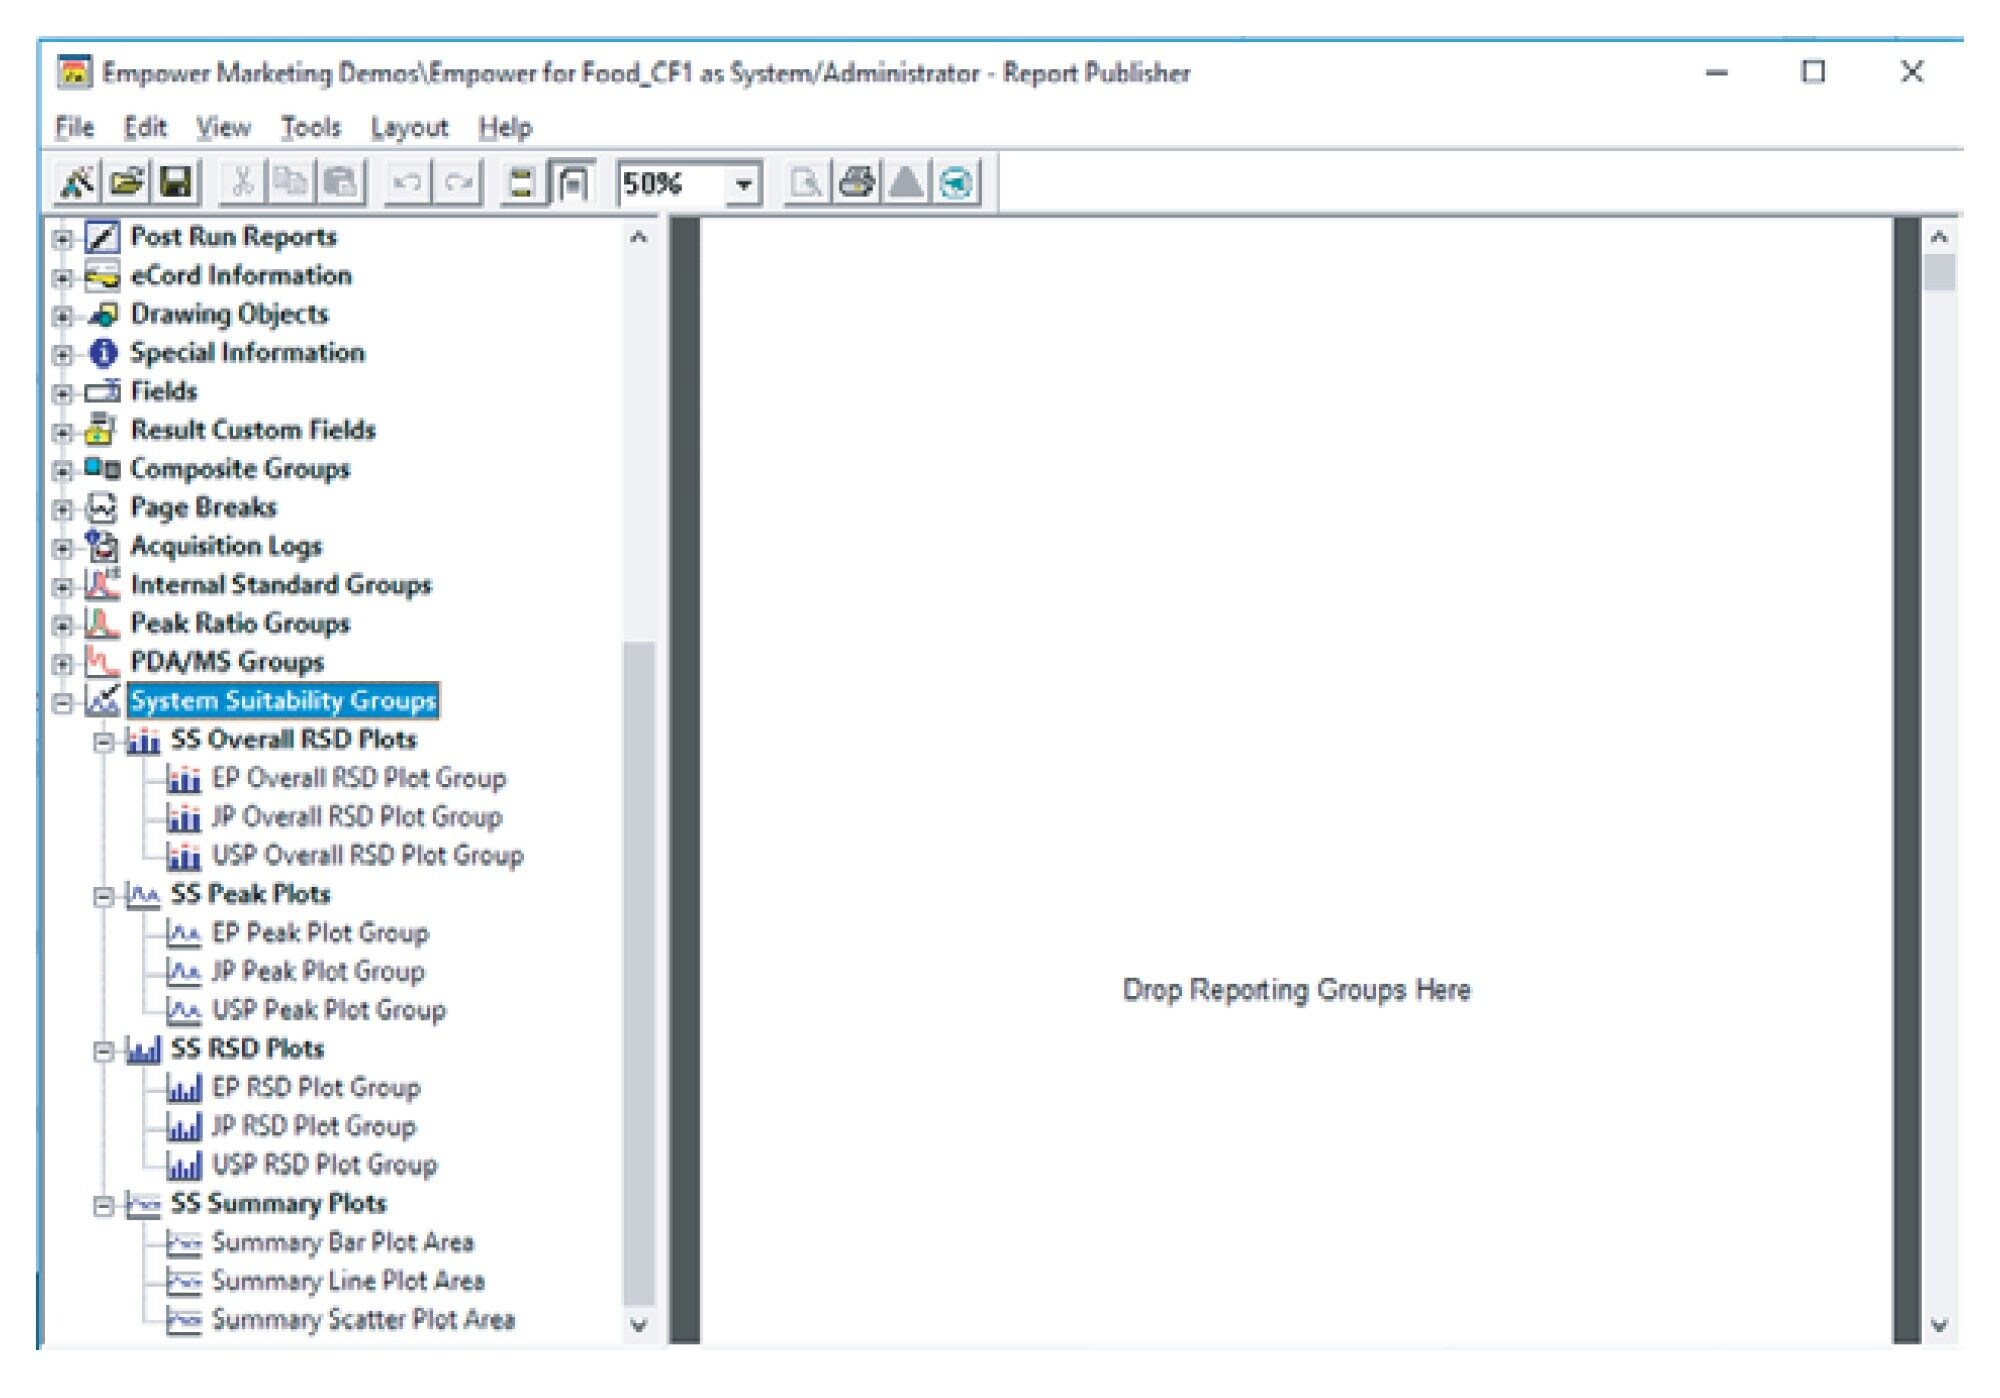 Figure 8. Report Publisher allows users to plot control charts via System Suitability groups.
On the right is the report method layout, while the list of report groups can be found on the left. System Suitability groups allow you to plot control charts. To observe the data trending for Retention Time, the SS Summary Plots are used. There are three display options for your Summary Plot, namely, Bar Plot, Line Plot, and Scatter Plot.
By default, Area will be trended for your Summary Plot. This can be changed in the Summary Plot Properties. Right click on the plot to access the Summary Plot Properties. There is an extensive selection of parameters – Empower built-in fields and custom fields inclusive – to choose from. We will select Retention Time to assess the trending of benzoic acid’s Retention Time over six System Suitability standard injections.
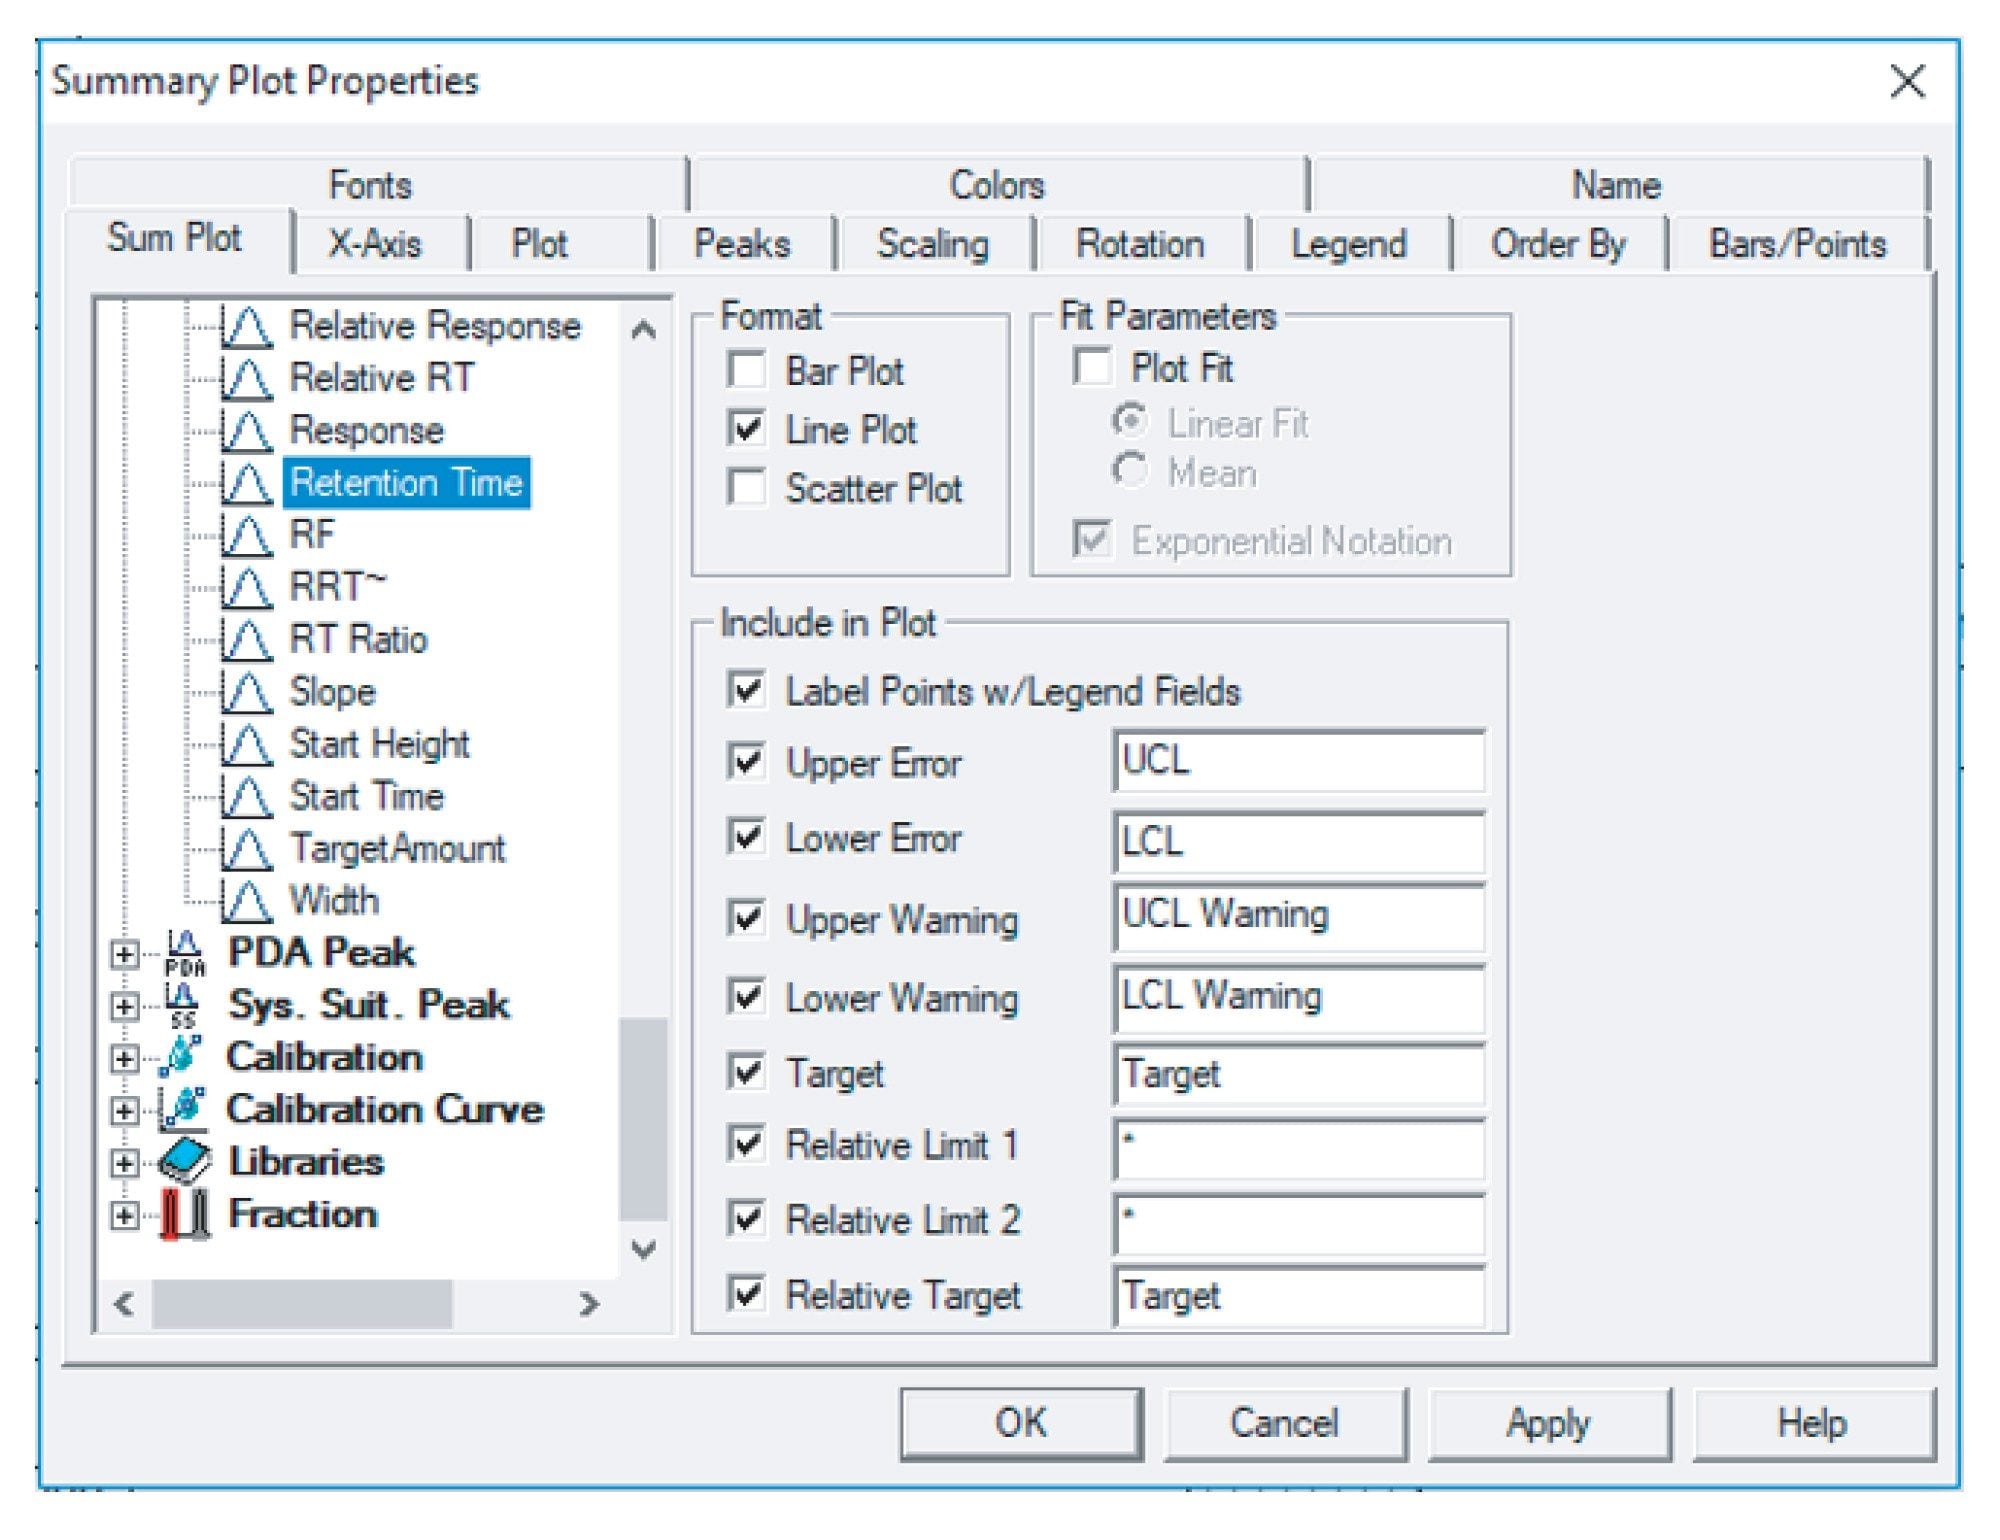 Figure 9. Summary Plot Properties allow users to set the parameter that they would like to trend.
The Summary Line Plot of benzoic acid’s Retention Time over six injections revealed that the injections were mostly trending near the lower error limit. Investigations and preventive corrective actions would be necessary to ensure that the method continues to maintain its optimum performance.
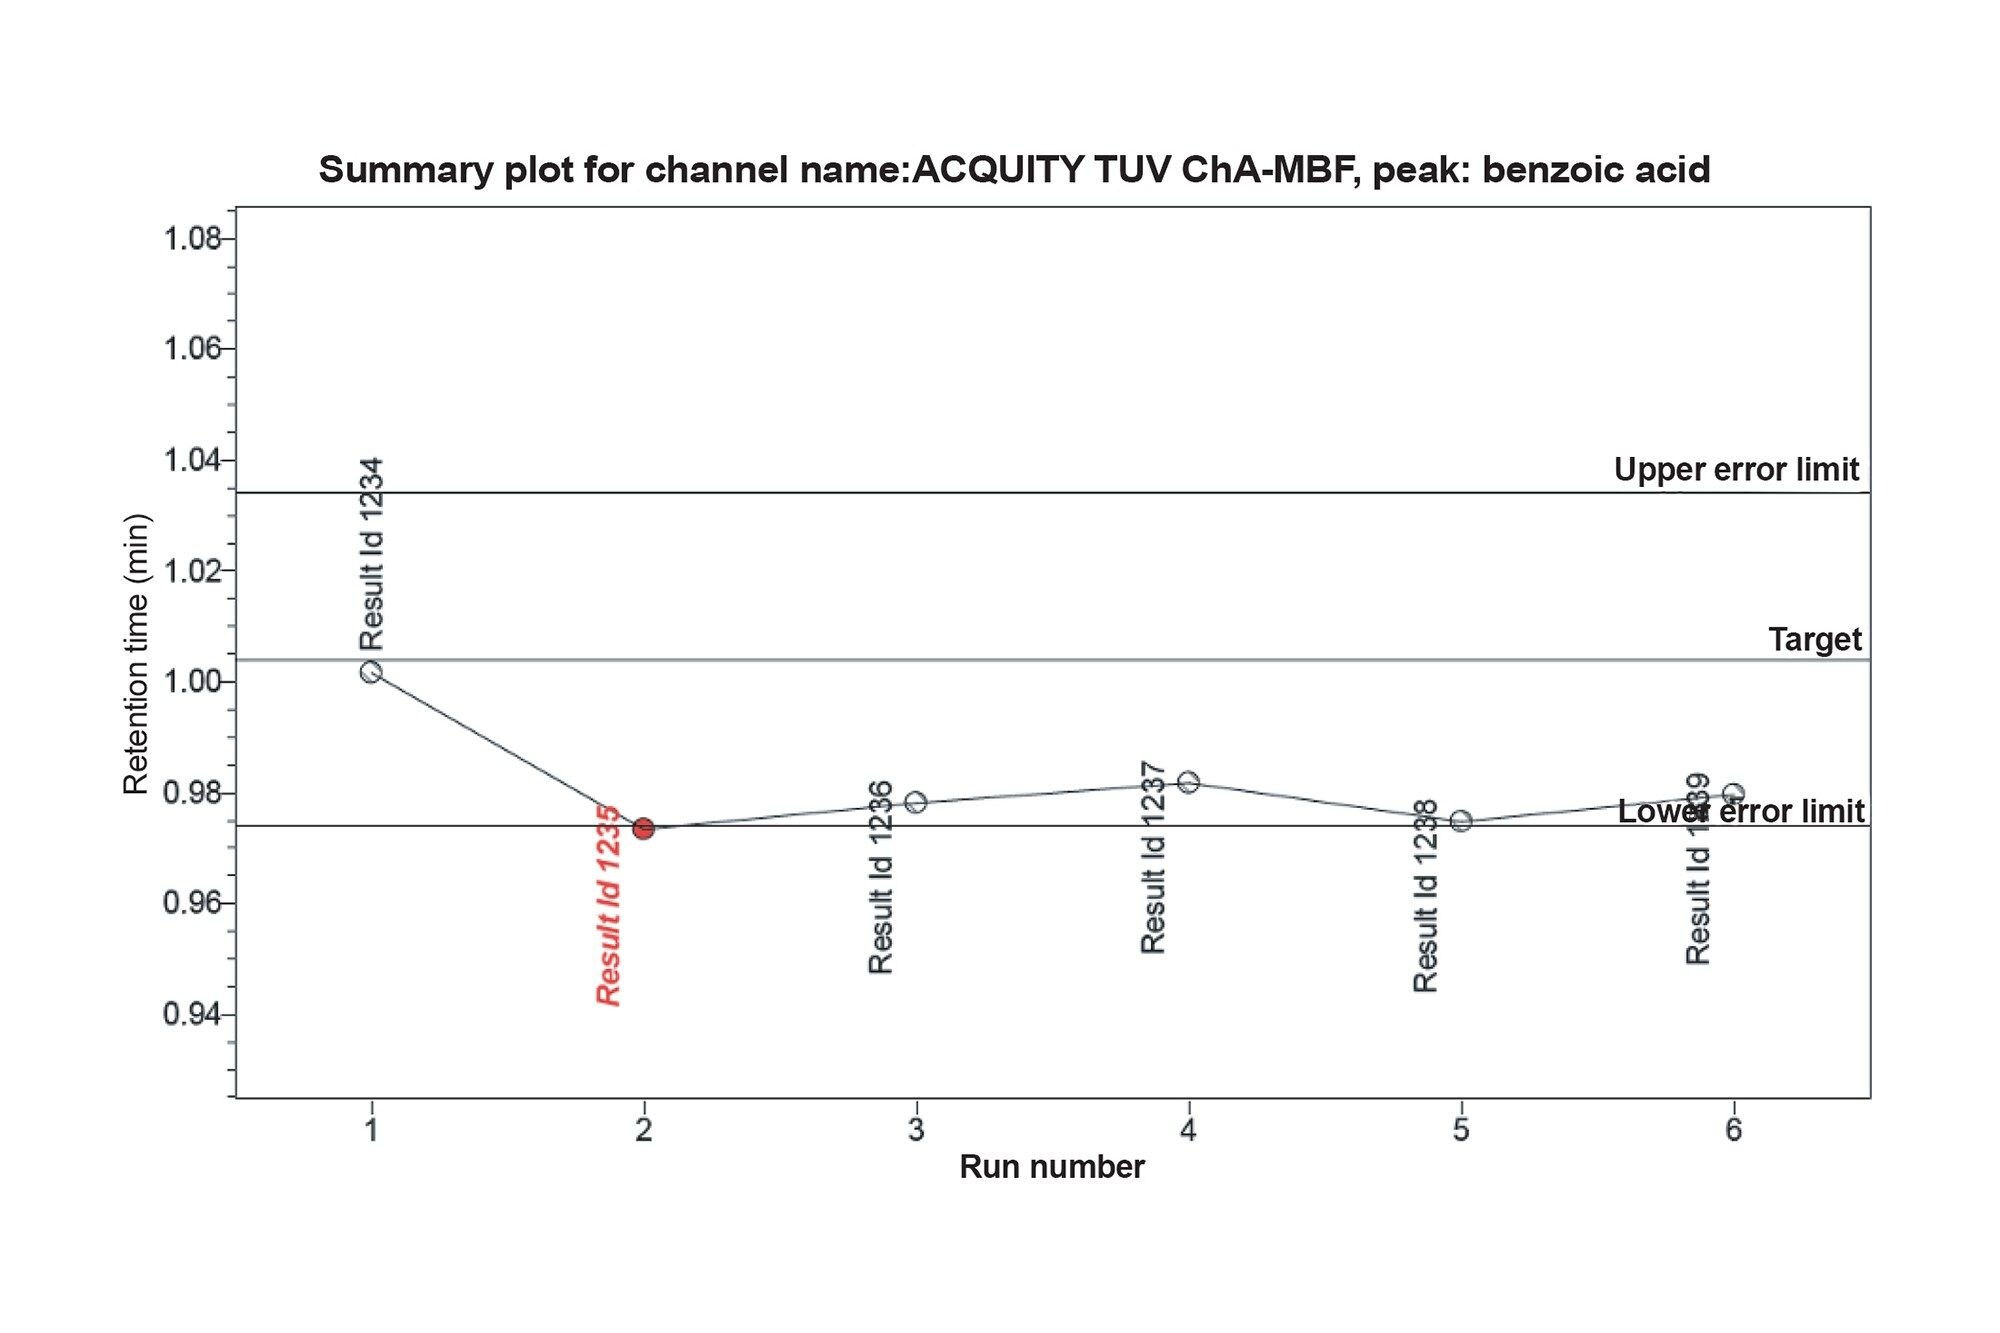 Figure 10. Summary line plot of benzoic acid’s Retention Time trending over six injections.
Conclusion
Empower CDS allows for an assessment of your System Suitability standards in an automated manner. Laboratory productivity is increased as you do not have to manually assess System Suitability criteria. Upon failing the requirements, sample runs can be configured to continue, abort, or reinject the standards, allowing for a true hands-off system operation. Control charts provide you graphical representations of the result performance trends over time, allowing you to easily review and identify out-oftrend results.
Empower CDS’s interactive System Suitability and control charts work in tandem to help assure that your laboratory continuously generates valid results while maintaining laboratory productivity.
Featured Products
720007010, October 2020