• Applikationsbericht

Dramatic Improvements in Assay Reproducibility for Water-Soluble Vitamins Using ACQUITY UPLC and the Ultra-Sensitive Xevo TQ-S Mass Spectrometer

Dramatic Improvements in Assay Reproducibility for Water-Soluble Vitamins Using ACQUITY UPLC and the Ultra-Sensitive Xevo TQ-S Mass Spectrometer

  • Nicholas A. Cellar
  • James E. Denison
  • C. Thomas Seipelt
  • Marian Twohig
  • Jennifer A. Burgess
  • Abbott Nutrition
  • Waters Corporation
Vitamin c effervescent tablet is dissolving in glass of water

Abstract

Recent advances in LC-MS/MS have further decreased the limits of detection that can be attained. In this work, however, the latest advances in LC-MS/MS technology have been used to specifically attain much lower RSDs than have been previously attainable with this type of multi-analyte method. This high level of reproducibility is required in order to address label claim disputes, minimize overage amounts, and maintain profitability while ensuring the health and safety of all consumers of these products. In this application note, quantification of seven water-soluble vitamins in a single method using UPLC-MS/MS with improved RSDs below 3% for all vitamins.    

Benefits

  • Quantification of seven water-soluble vitamins in a single method using UPLC-MS/MS
  • Improvement in precision to obtain RSDs below 3% for all vitamins

Introduction

Fortification of infant formula and adult nutritionals with vitamins that are essential for health and well being is widely accepted as necessary to address the nutritional needs of those who consume these products. Much research has been conducted to ensure the delivery of the appropriate level of these vitamins from both a health benefit and safety perspective.1

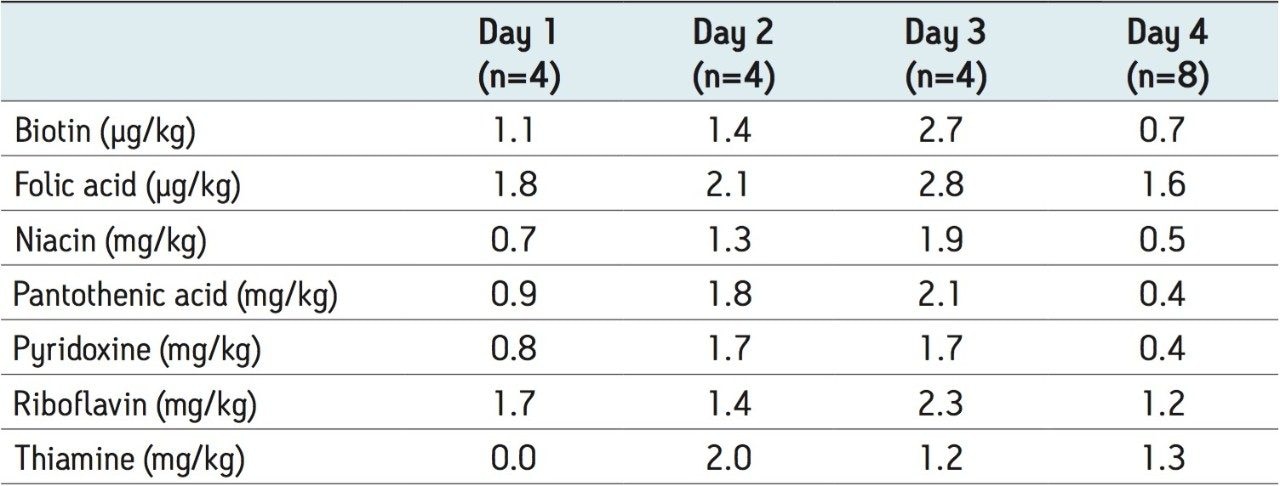
In order to ensure that the appropriate levels of vitamins are available throughout the shelf life of a product, manufacturers must take into account any degradation over time of the vitamins and make up for this with an increase in the initial amount of the fortified vitamin. With both maximum and minimum levels required for these vitamins, a delicate balance must be reached between overages and degradation. Precise and accurate measurements of vitamin concentrations becomes critical. When measurements from different laboratories are added to  an already complicated analytical challenge, the task can appear insurmountable. Variation must be reduced to ensure intra- and inter-lab reproducibility can meet the analytical requirements.

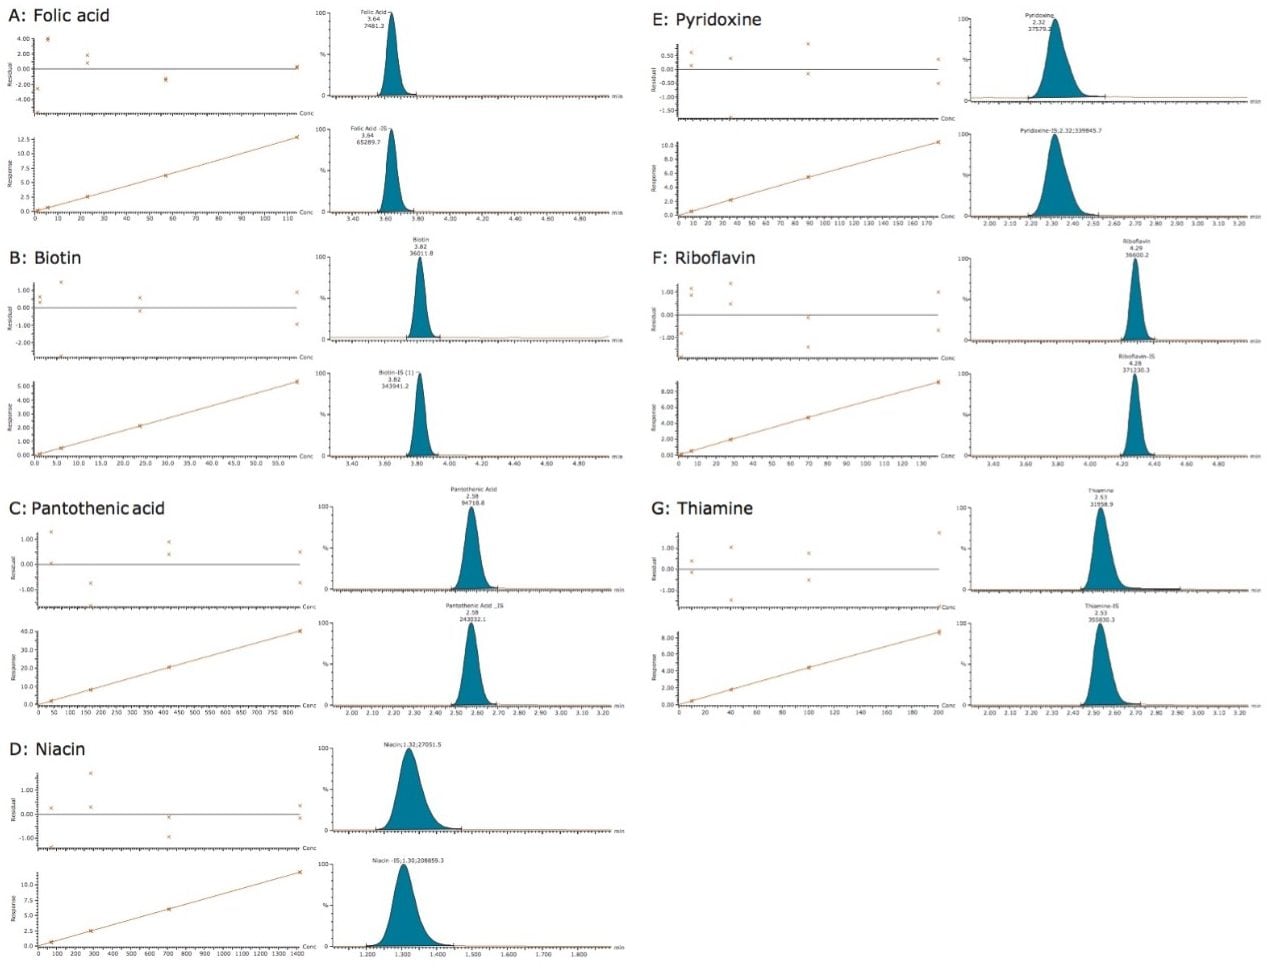
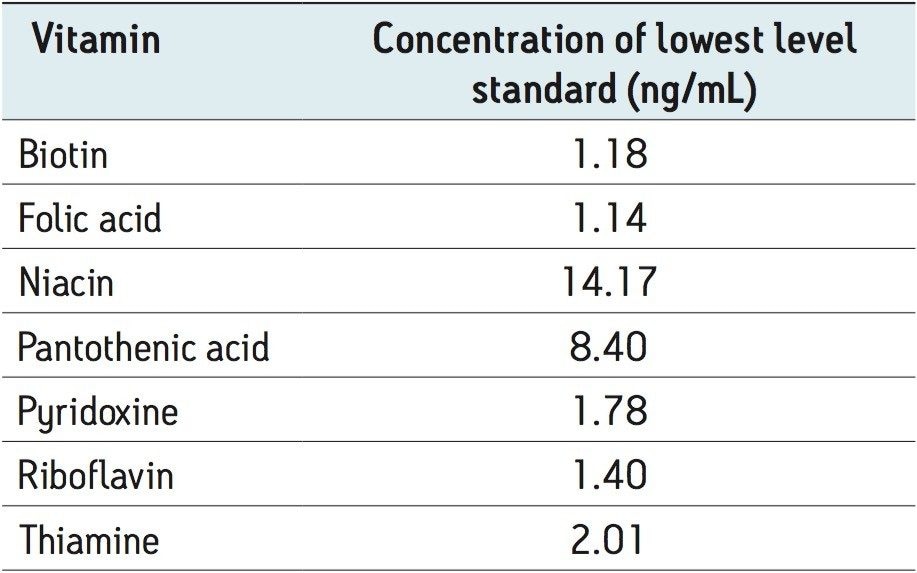
LC-MS/MS technology has begun to be more widely accepted for the quantitative analysis of fortified vitamins in food products.2-5 The advantages in selectivity and sensitivity, along with the ability to analyze multiple analytes in a single injection make this technology highly suitable for this application. Recent advances in LC-MS/MS have further decreased the limits of detection that can be attained. In this work, however, the latest advances in LC-MS/MS technology have been used to specifically attain much lower RSDs than have been previously attainable with this type of multi-analyte method. This high level of reproducibility is required in order to address label claim disputes, minimize overage amounts, and maintain profitability while ensuring the health and safety of all consumers of these products.

Experimental

UPLC conditions

System:

ACQUITY UPLC

Column:

ACQUITY HSS T3 C18, 1.8 μm, 1.0 X 100 mm

Column temp.:

60 °C

Injection volume:

10 μL

Flow rate:

0.15 mL/min

Mobile phase A:

Water + 0.05% HCOOH and 0.01% HFBA

Mobile phase B:

Methanol with 10 mM NH4OH

Strong wash:

Methanol

Weak wash:

Water

MS conditions

Mass spectrometer:

Xevo TQ-S

Ionization mode:

ESI +

Capillary voltage:

2.5 kV

Desolvation temp.:

500 °C

Desolvation gas flow:

750 L/h

Source temp.:

150 °C

Cone gas: 

300 L/h

MRM transitions

The MRM transitions, cone voltage, and collision energy selected for each of the water-soluble vitamins and their internal standards are shown in Table 2, along with the expected compound retention time.

UPLC method for water-soluble vitamins analyses.
Table 1. UPLC method for water-soluble vitamins analyses.
MRM transitions, retention times, and tuning parameters for the water-soluble vitamins and their internal standards.
Table 2. MRM transitions, retention times, and tuning parameters for the water-soluble vitamins and their internal standards. 

Standard preparation

Seven working standards containing a mix of all the analyzed vitamins and isotopically labeled standards were prepared in 1% ascorbic acid solution, then pH adjusted with ammonium hydroxide. 

Sample preparation

Precisely weighed amounts of sample were made up according to the (proprietary) standard operating procedure (SOP) for the method. The amount depended upon the specific product to be analyzed. Products included both ready-to-feed and powdered formulations. Isotopically labeled standards for each of the vitamins were added. Following thorough mixing of the samples, 25 mL of 1% ascorbic acid was added to the samples. Following another thorough mixing, 80 µL of 30% ammonium hydroxide was added. The samples were mixed again and allowed stand for 10 minutes. An aliquot of the supernatant from the settled samples was filtered through 0.45 µm PTFE directly into autosampler vials.

The SOP for the analysis resulted in working standards and samples that were far too concentrated for analysis on the Xevo TQ-S. In order to meet the SOP, tune parameters were optimized to bring the response into the linear range of the instrument.

Results and Discussion

Example MRM chromatograms of each of the vitamins in the NIST SRM 1849a are shown in Figure 1. The calculated levels in SRM 1849a for each of the vitamins is given in Table 3, along with the NIST reported levels and expected range. As can be seen in Table 3, there was good agreement with the published values and the precision (RSD) was excellent. 

MRM chromatograms for each of the vitamins for the analysis of the NIST SRM 1849a.
Figure 1. MRM chromatograms for each of the vitamins for the analysis of the NIST SRM 1849a.
Expected amount and acceptable range for the NIST SRM 1849a
Table 3. Expected amount and acceptable range for the NIST SRM 1849a along with the calculated mean values, RSD, and accuracy for 19 separate analyses over an eight-month period. The first eight preparations used a different internal standard RSD for biotin, therefore only analyses with the final internal standard for biotin were included (n=11).

Examples of MRM chromatograms for the lowest level standard of each vitamin along with their calibration curves are shown in Figure 2. Each of the seven calibration curves showed r2 values <0.999. Intra-day variability on four separate days is shown in Table 4 and ranged between 0% and 2.8%. The concentration of the lowest level working standard for each vitamin is shown in Table 5. 

Calibration curves and residuals plots along with the MRM chromatograms of the lowest level standard and internal standard of each vitamin.

Figure 2. Calibration curves and residuals plots along with the MRM chromatograms of the lowest level standard and internal standard of each vitamin. Concentrations of the lowest level standard are listed below.

A: Folic acid, 1.14 ng/mL 

B: Biotin, 1.18 ng/mL 

C: Pantothenic acid, 8.40 ng/mL 

D: Niacin, 14.17 ng/mL 

E: Pyridoxine, 1.78 ng/mL 

F: Riboflavin, 1.40 ng/mL 

G: Thiamine, 2.10 ng/mL 

Intra-day precision for four separate days. Values are the percentage relative standard deviation (% RSD) for the NIST SRM 1849a.
Table 4. Intra-day precision for four separate days. Values are the percentage relative standard deviation (% RSD) for the NIST SRM 1849a. For days 1 through 3, n=4; for day 4, n=8.
Concentration levels for the lowest level working standard.
Table 5. Concentration levels for the lowest level working standard.

Reports of the intra-day and inter-day variability from the analysis of vitamins in fortified products are available in the literature. Goldschmidt and Wolf2 published a method using HPLC with MS detection with RSDs below 3% for niacinamide, pyridoxine, and pantothenic acid. For riboflavin and biotin, the RSDs were approximately 5% but for thiamine and folic acid the RSDs were typically reported to be above 5%. Huang et al.found reproducibility for eight replicates to be below 5% for a commercial infant formula. Zhang et al.reported intra-day variability ranging from 1.17% to 7.81% for 14 vitamins and vitamin-like compounds. The inter-day variability was reported to range between 2.61% and 8.42%. As can be seen in Table 4, the intra-day variability for this method was vastly improved compared to the literature for each of the compounds analyzed. To assess the reproducibility of the method, 19 independent preparations on 19 different days over an eight-month period were performed. During this period of time, the internal standard for biotin was changed, therefore only the measurements with the final biotin internal standard are included in Table 3 (i.e. from the final 11 analyses performed). For the measurements with the former biotin internal standard, the RSD was 2.0% and the accuracy compared to the NIST value was 102% (n=8). Therefore, either of the biotin internal standards were deemed suitable for the method. Overall, the variability for this study was typically below 2.5%, as shown in Table 3. Only biotin and riboflavin showed slightly higher values than this. The accuracy was between 100% and 108% for all analytes. 

Conclusion

  • LC-MS/MS offers the opportunity to combine single-analyte water-soluble vitamin methods into a multi-analyte method, saving time and improving laboratory efficiency.
  • A single UPLC-MS/MS method for the analysis of biotin, folic acid, pantothenic acid, niacin, pyridoxine, riboflavin, and thiamine has been presented.
  • With the employment of an ultra-sensitive mass spectrometer, the variability in measurements could be vastly improved to ensure RSDs better than 3% for the vitamins tested.
  • This reduction in variation is important to ensure that intra- and inter-lab reproducibility can meet the analytical requirements to guarantee that label claims are met at the end of shelf life.
  • Improvements in precision also enable reductions in the overages required during product formulation in order to improve product profitability.

References

  1. Koletzko B, Baker S, Cleghorn G, Neto UF, Gopalan S, Hernell O, Hock QS, Jirapinyo P, Lonnerdal B, Pencharz P, Pzyrembel H, Ramirez-Mayans J, Shamir R, Turck D, Yamashiro Y, and Zong-Yi D. Global standard for the composition of infant formula: recommendations of an ESPGHAN coordinated international expert group. Journal of Pediatric Gastroenterology and Nutrition. 2005; 41:584-599.
  2. Goldschmidt RJ, Wolf WR. Simultaneous determination of water-soluble vitamins in SRM 1849 Infant/Adult Nutritional Formula powder by liquid chromatography-isotope dilution mass spectrometry. Analytical and Bioanalytical Chemistry. 2010; 397:471-481.
  3. Huang M, Winters D, Crowley R, Sullivan D. Measurement of water-soluble B vitamins in infant formula by liquid chromatography/tandem mass spectrometry. Journal of AOAC. 2009; 92(6):1728-1738.
  4. Zhang H, Chen S, Liao W, Ren Y. Fast simultaneous determination of multiple water-soluble vitamins and vitamin-like compounds in infant formula by UPLC-MS/MS. Journal Food Agriculture & Environment. 2009; 7(2): 88-93.
  5. Phinney KW, Rimmer CA, TJ Brown, Sander LC, Sharpless KE, and Wise SA. Isotope Dilution Liquid Chromatography - Mass Spectrometry Methods for Fat- and Water-Soluble Vitamins in Nutritional Formulations. Analytical Chemistry. 2011; 83 (1):92-98.

720004690, May 2013

Zurück zum Seitenanfang Zurück zum Seitenanfang