The most challenging step in metabolite identification is the detection of very low level metabolites, particularly with in vivo samples. Typically, very little sample preparation is carried out when analyzing these samples in order to keep them as intact as possible, avoiding the risk of polar metabolite loss in an extraction procedure. Urine samples are usually diluted, while for plasma, samples are protein precipitated. As standards are rarely available, analysis occurs with little prior knowledge of expected results. This is particularly evident in drug development, where very low levels of circulating metabolites need to be identified in a sea of endogenous interferences. Thus, searching for low-level putative metabolites in complex matrices is a significant challenge.
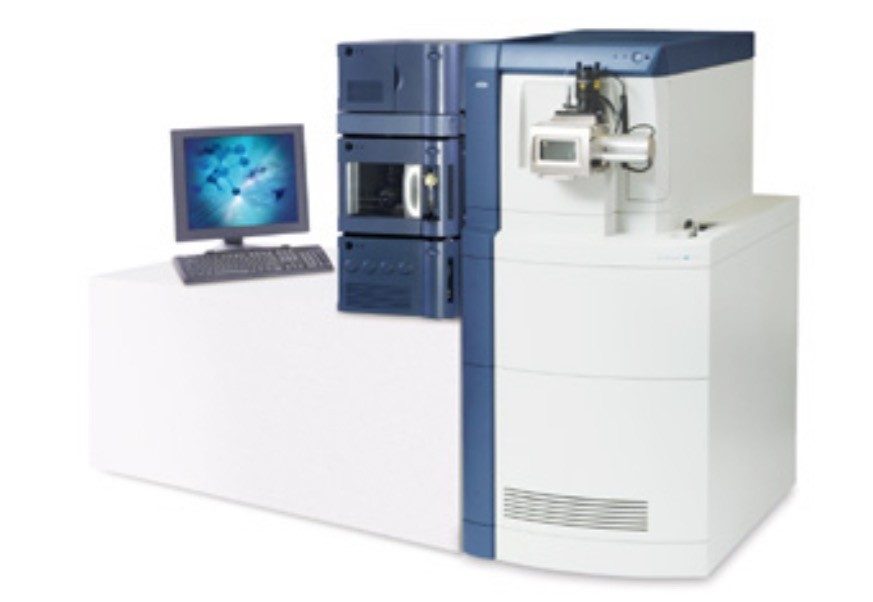
The introduction of Waters UltraPerformance LC (UPLC) System has revolutionized this type of analysis through major advances in separation efficiency and sensitivity over traditional HPLC. However, in hyphenated techniques such as this, the quality of the MS detection remains a critical factor in determining low level metabolites, especially as drugdevelopment follows a trend of increased potency and lower dosing levels. This applies not only to full scan MS data, but also places more stringent requirements on MS/MS information quality-vital to determine the structure and site of biotransformation.
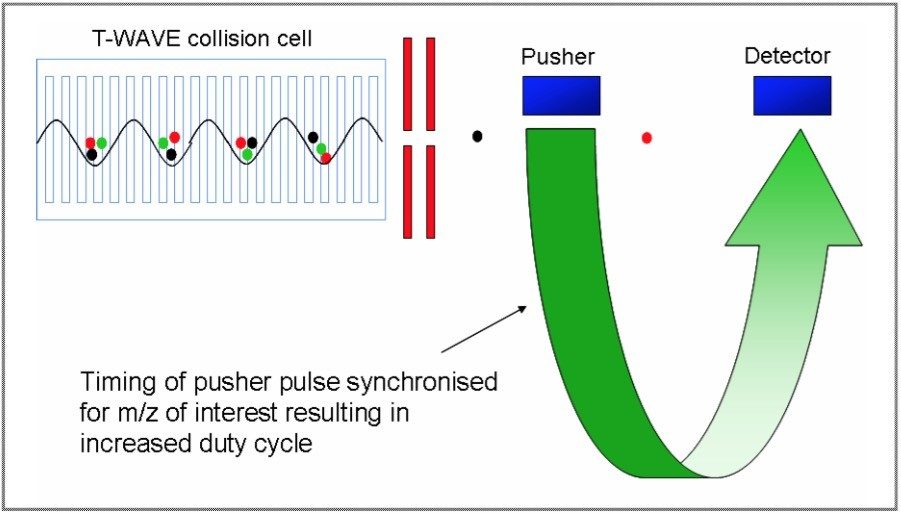
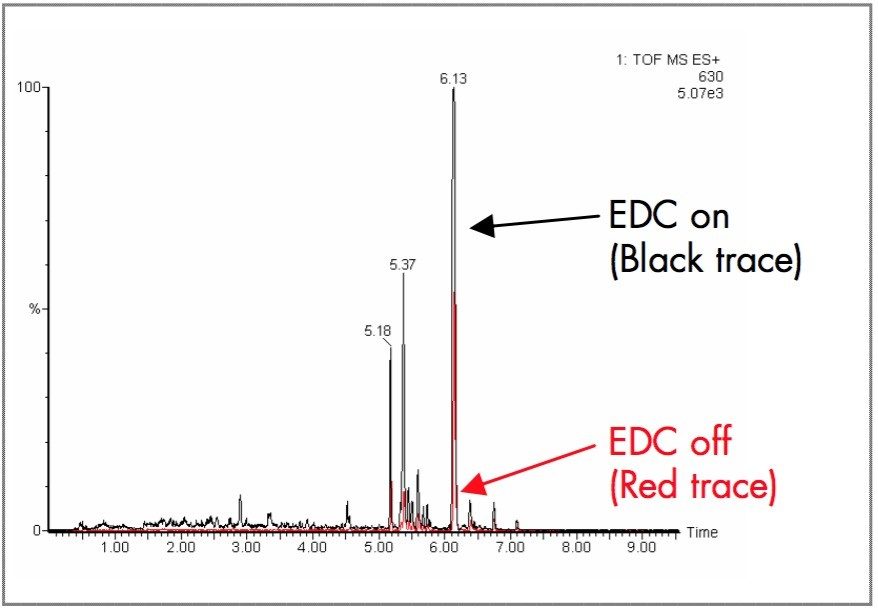
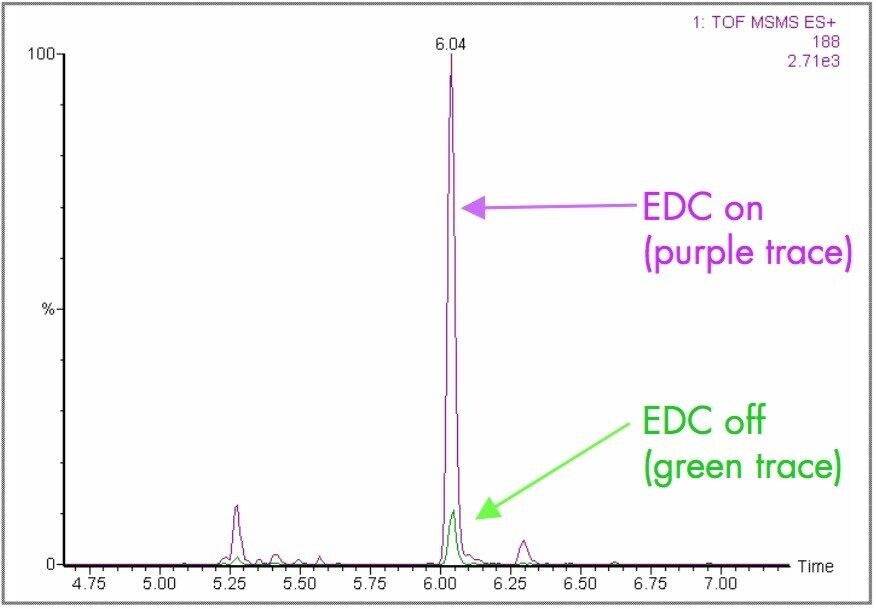
In this application note, a UPLC-MS/MS method will be described, allowing lower concentration to be detected for metabolite identification. Complementing superior UPLC chromatographic separations, the Waters Micromass Q-Tof Premier with its enhanced duty cycle (EDC) mode provides enhanced sensitivity, and thus, maximizes the amount of information obtained from a single injection of a complex sample. In this mode, the duty cycle of the mass spectrometer can be increased for specified m/z values, providing significant sensitivity enhancements. This is achieved by utilizing novel T-Wave1 (Traveling Wave) collision cell technology to shape the ion beam into packets of ions. These ion packets are then released from the collision cell at certain intervals with the pusher of the oa-Tof, synchronized to operate as the ion of interest enters the extraction region (Figure 1). EDC can be operated in both MS and MS/MS modes of analysis as well as precursor ion discovery (PID) experiments. The increases in sensitivity offered by EDC are variable, depending on the m/z values. Increases of an order of magnitude or more can be achieved for ions of m/z values of 250 and below.