The aim of the study presented is to illustrate the enhanced performance of the Waters Micromass LCT Premier oa-Tof Mass Spectrometer. The data presented shows mass accuracy achieved over a twelve-hour period. Using negative ion mode electrospray, very good mass accuracy is achieved routinely with real time centroid data acquisition and lockmass correction. Acquisition of UV data in parallel is performed. The system used is comprised of a Waters Alliance HT 2795 Separations Module, 2996 PDA Detector, Symmetry C18 Column, and Micromass LCT Premier oa-Tof Mass Spectrometer.
The LCT Premier is a newly developed benchtop oa-Tof (orthogonal acceleration time of flight) mass spectrometer. New hardware and software control technology has been incorporated to meet the increased analytical demands in the pharmaceutical, environmental, and clinical applications arenas. This study utilizes a plant extract at concentrations of 100 ng/μL. The extract contains a plethora of major and minor components of which exact mass measurement can be performed in one analysis. The high duty cycle of Tof is utilized for qualitative studies, generating full spectra at high mass accuracy (<3 ppm RMS). The highly specific data generated provides an extra degree of information that aids interpretation of the data. Using real time exact mass centroid data acquisition, the evaluation of electrospray negative ion mode performance of the LCT Premier has been performed. The LCT Premier oa-Tof is presented in Figure 1 and the schematic of the LCT Premier with the analyzer in V geometry is illustrated in Figure 2.
HPLC: |
Alliance HT 2795 Separations Module |
Column: |
Waters Symmetry C18 (250 mm x 4.6 mm, 5 μm particles) with guard column (2 mm x 3.9 mm, 5 μm particles) |
Column temp.: |
35 ˚C |
Flow: |
1 mL/min - split 1:4 |
Mobile phase: |
A: H2O (0.2% HCOOH), B: MeCN |
Gradient: |
0-10 min:15% B; 10-40 min: 15-30% B; 40-50 min: 30-15% B |
Mass spectrometer: |
Micromass LCT Premier oa-Tof |
Ionization mode: |
ESI Voltage -ve = 2.7 kV |
Sample cone voltage: |
100 V |
Reference mass: |
Leucine enkephalin, [M-H]=554.2615 |
Acquisition parameters: |
100 –1000 Da 1 spectrum/second 5500 FWHM 0.1 second inter scan delay |
Two plant extracts (Passiflora caerulea and edulis) were selected for analysis to evaluate the LCT Premier negative mode exact mass measurement performance. The BPI chromatograms obtained for the negative mode analysis of the two species are shown in Figure 4, where Passiflora edulis (A) and Passiflora caerulea (B) are presented. Visually comparing the two chromatograms, the difference in the profile of the two species is evident. This highlights the advantage of oa-Tof technology, where good sensitivity can be obtained with full exact mass spectral acquisition. A plethora of major and minor components have been detected in both extracts, and acquiring full spectra has ensured that a maximum amount of specific information can be obtained.
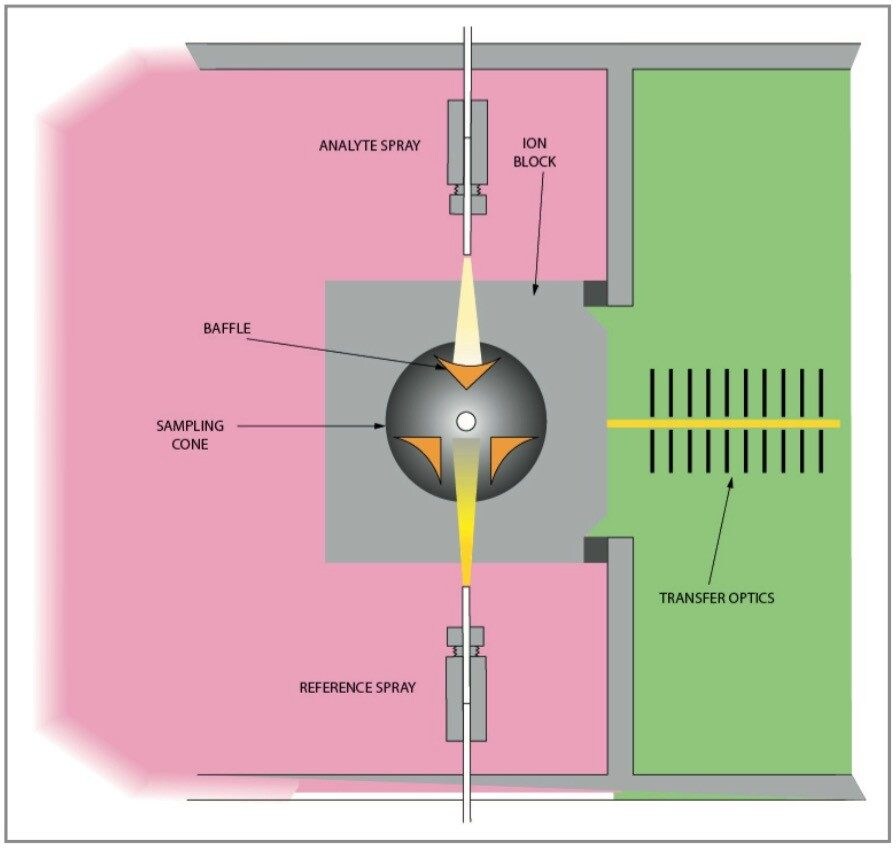
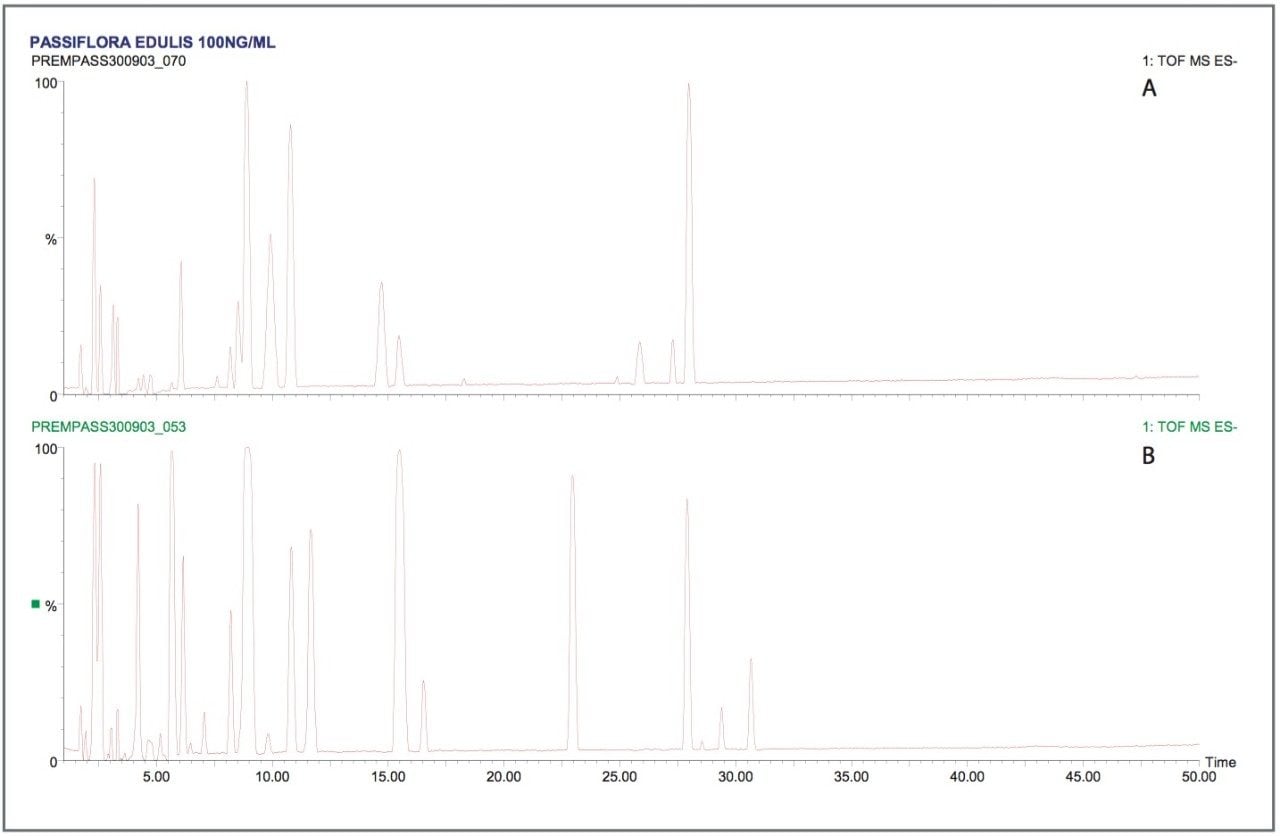
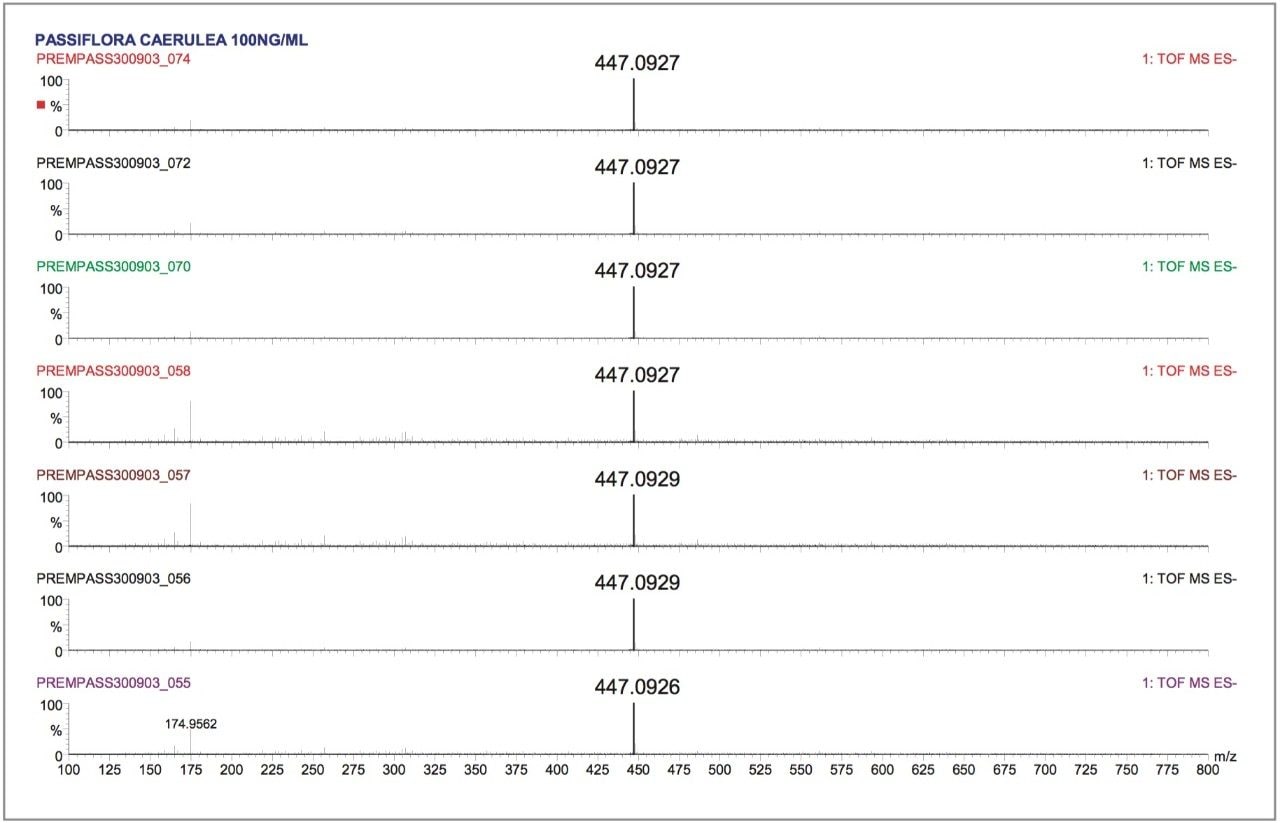
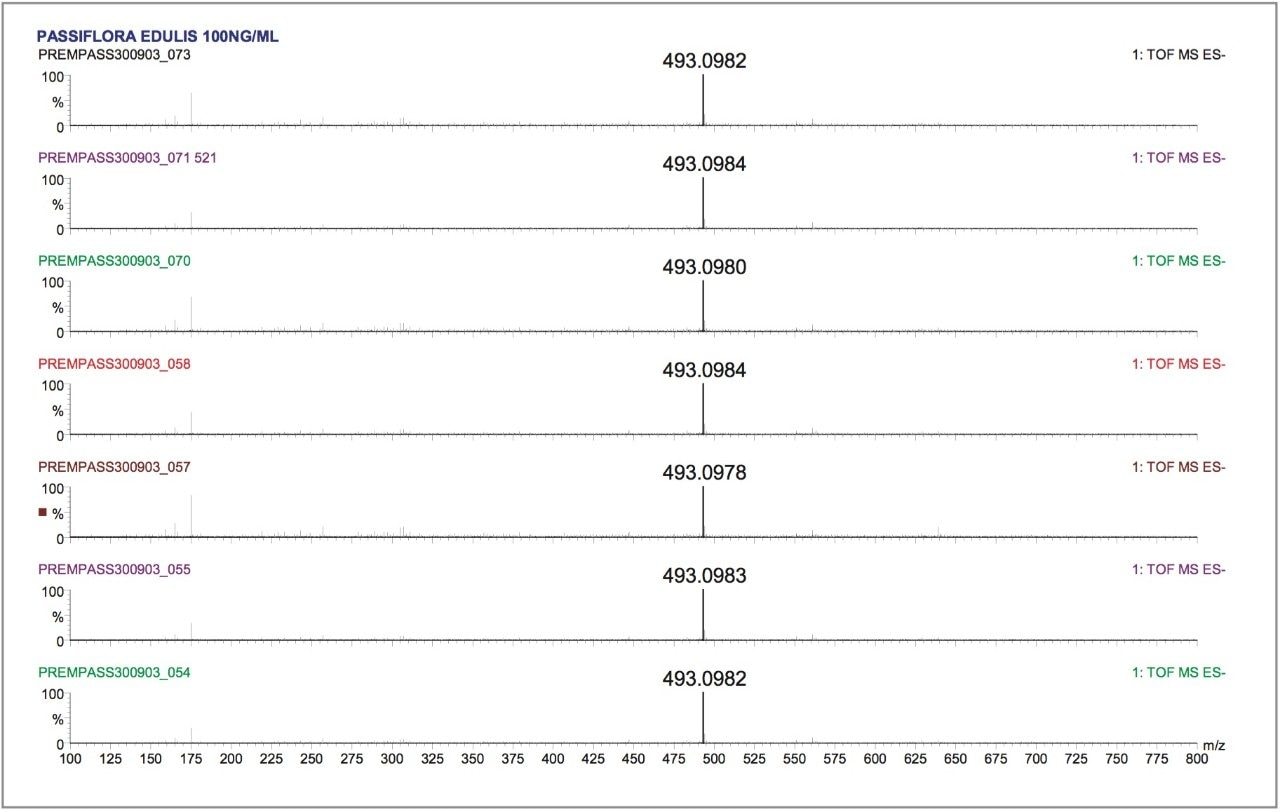
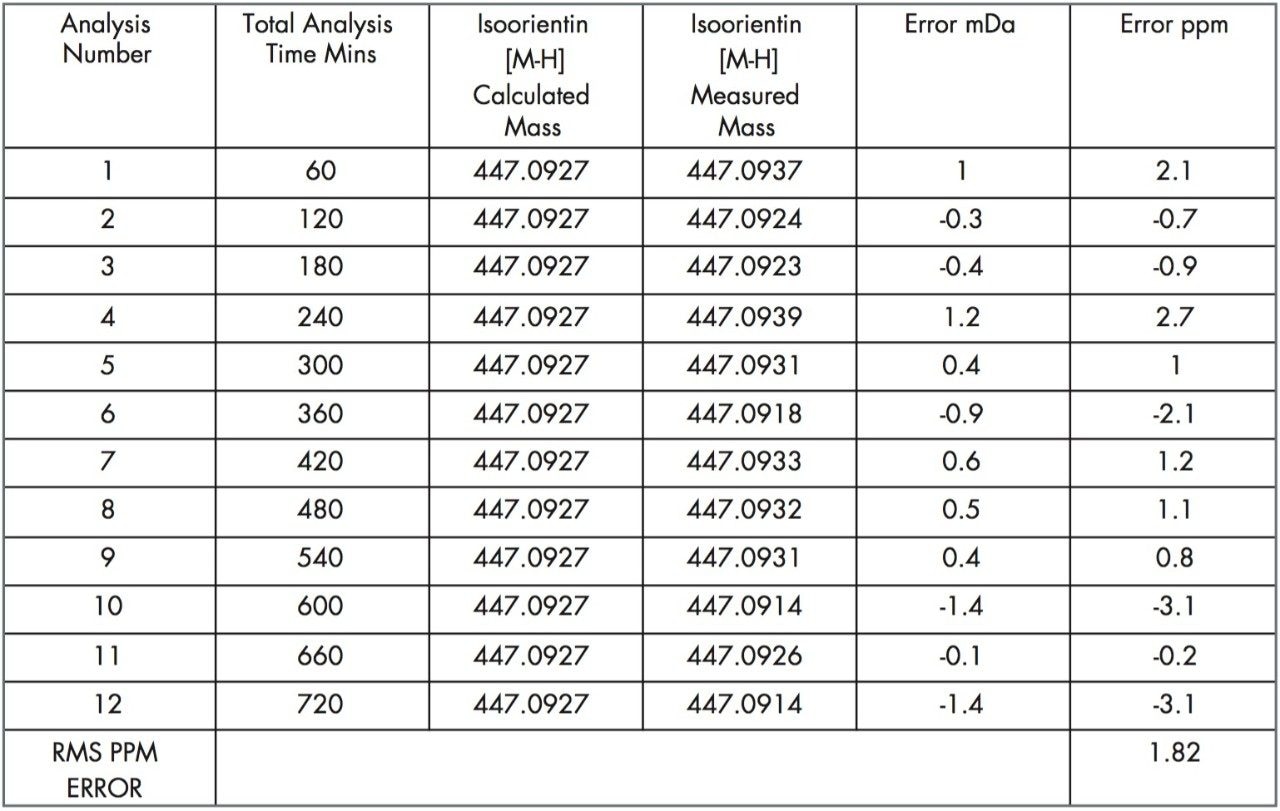
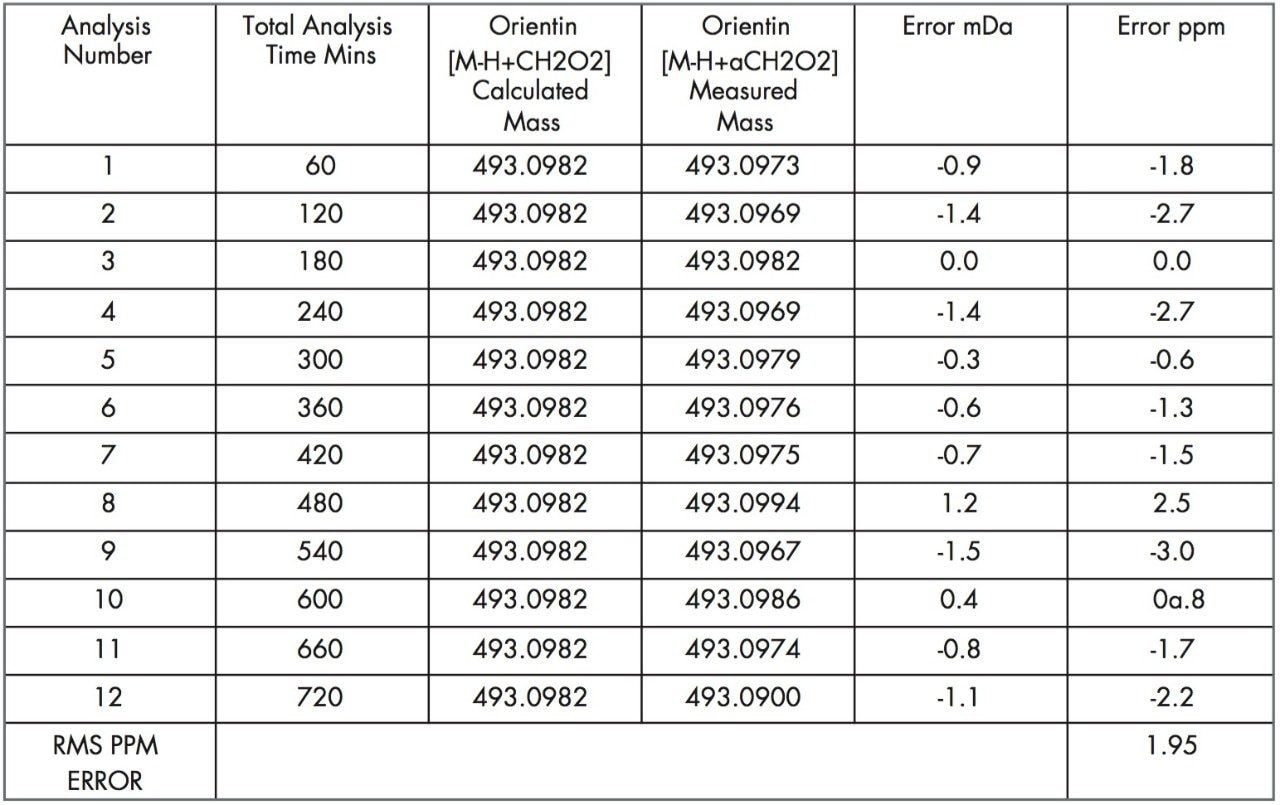
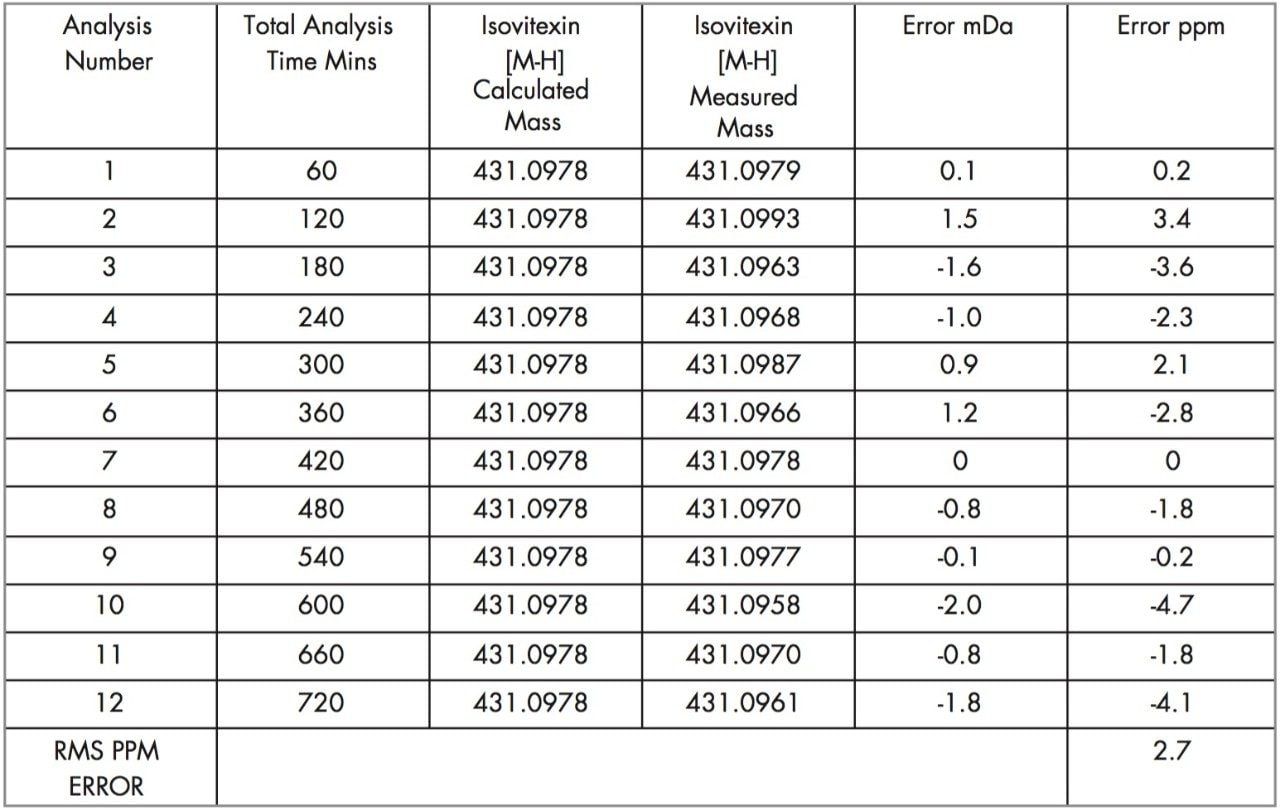
The data was acquired in centroid mode and mass corrected in real time. The reference mass Leucine enkephalin was sampled independently using the integral LockSpray source. The reference compound Leucine enkephalin ionizes in negative mode to produce ([M-H]-=554.2615), and is sampled independently from the analyte spray to provide a lockmass. As shown in Figures 5 and 6, it is not seen in the analyte mass spectrum. Lockmass correction takes place automatically in real time and the independent sampling enhances the mass accuracy obtained. Both plant extracts were consecutively injected six times, each analysis time taking sixty minutes. This allowed the negative ion mode performance of the LCT Premier to be evaluated over a period of twelve hours. In Figure 5, examples of the exact mass spectra acquired over the twelve-hour period are illustrated for isoorientin. The manually selected spectra illustrate data where exact mass measurement has been achieved within –0.1 mDa to 0.2 mDa. In Figure 6, data acquired for orientin in the two plant extracts is shown. Example exact mass spectra acquired over the twelve-hour period are illustrated where exact mass measurement has been achieved within –0.2 mDa to 0.2 mDa range.
Tables 1, 2, and 3 show the masses measured, ppm errors and RMS ppm errors for isoorientin, orientin, and isovitexin respectively. The data processing was performed automatically using OpenLynx. RMS ppm errors of less than 3 ppm were obtained in negative ion mode during the analysis period.
720000979, November 2004