For research use only. Not for use in diagnostic procedures.
This application note demonstrates proof of concept for the rapid, accurate and precise quantification of the protein biomarker, cytochrome C.
Rapid digestion and quantification of a protein biomarker, demonstrating the flexibility, speed, and reproducibility of a generic kit-based approach.
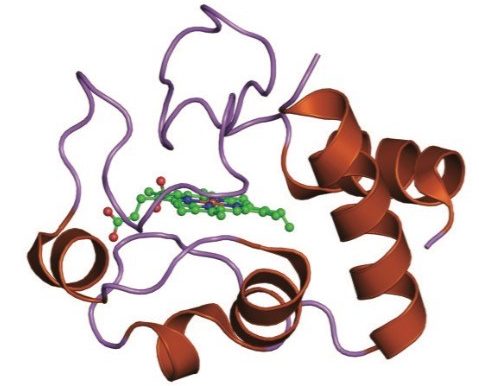
Cytochrome C (Figure 1),1 is a mitochondrial protein (~13kDa) which plays important roles in oxidative phosphorylation and apoptosis, or programmed cell death.2 Elevated plasma concentrations (~2 µg/mL) of circulating cytochrome C have been reported in patients with conditions associated with mitochondrial damage.3 As a result, the ability to accurately quantify cytochrome C as a potential biomarker is of high interest. Historically, cytochrome C has been quantified using ligand binding assays (LBAs) or western blot analysis. However, use of LC-MS analysis for protein quantification has become more popular in the past few years due to the many benefits it offers (e.g., multiplexing, improved specificity, broader linear dynamic range, and faster method development times). For protein quantification by LC-MS, the bottom up approach using enzymatic digestion (usually trypsin) and analysis of resulting tryptic peptides is often employed. However, these protein digestion workflows are complex and time consuming, with enzymatic digestions often taking upwards of 24 hours to achieve sensitive and accurate quantification from complex biological matrices. Thus, there is a strong need for simpler, more standardized LC-MS workflows. In this application note, we describe a fast (10-minute) digestion using the ProteinWorks eXpress Direct Digest Kit and post digest peptide clean-up using ProteinWorks µElution SPE Clean-up Kit for the accurate quantification of cytochrome C in plasma.
To prepare standards and quality control (QC) samples, cytochrome C (derived from bovine heart) was spiked into plasma at various concentrations (0.5–250.0 µg/mL). Plasma samples (35 µL) were digested for 10 minutes using the ProteinWorks eXpress Direct Digest kit. Post digestion purification of signature peptides was completed using the ProteinWorks µElution SPE Clean-up Kit and supplied protocol.
LC system: |
ACQUITY UPLC |
Detection: |
Xevo TQ-S Mass Spectrometer, ESI+ |
Column: |
CORTECS UPLC C18+ Column, 1.6 μm, 2.1 mm x 50 mm |
Temp.: |
55 °C |
Sample temp.: |
10 °C |
Injection volume: |
5 μL |
Mobile phases: |
A: 0.1% Formic Acid in H2O B: 0.1% Formic Acid in ACN |
Time (min) |
Flow rate (mL/min) |
%A |
%B |
Curve |
---|---|---|---|---|
Initial |
0.400 |
98.00 |
2.00 |
6 |
0.50 |
0.400 |
98.00 |
2.00 |
6 |
3.75 |
0.400 |
60.00 |
40.00 |
6 |
3.80 |
0.400 |
10.00 |
90.00 |
6 |
4.35 |
0.400 |
10.00 |
90.00 |
6 |
4.40 |
0.400 |
98.00 |
2.00 |
6 |
5.00 |
0.400 |
98.00 |
2.00 |
6 |
Capillary (kV): |
3 |
Cone (V): |
30 |
Source offset (V): |
50 |
Source temp. (°C): |
150 |
Desolvation temp. (°C): |
600 |
Cone gas flow (L/Hr): |
150 |
Desolvation gas flow (L/hr): |
1000 |
Collision gas flow (mL/min): |
0.15 |
Nebulizer gas flow (Bar): |
7 |
Preliminary digestion experiments in buffer were performed to identify tryptic peptides and corresponding MRM transitions for cytochrome C quantification. Four unique signature tryptic peptides were identified: TGPNLHGLFGR, MIFAGIK, EDLIAYLK, and GITWGEETLMEYLENPKK. The amino acid sequence of cytochrome C and unique signature peptides (highlighted in orange) can be seen in Figure 2.4 With the exception of the GITW tryptic peptide, where the triply charged precursor was used, the doubly charged precursors were determined to be the most intense and generated highly specific y ion fragments. MS conditions are summarized in Table 1.
Chromatographic separation of cytochrome C tryptic peptides was achieved using a CORTECS UPLC C18+, 1.6 µm, 2.1 mm x 50 mm Column. CORTECS C18+ Columns combine the benefits of solid-core particle technology and a low-level positive surface charge, which provides excellent peak shape, narrow peak widths (<3 secs at base), and resolution from matrix interferences. Representative chromatograms for the four cytochrome C tryptic peptides are shown in Figure 3. Here you can also see that the TGPN peptide (2.12 minutes) elutes immediately before the MIFA peptide (2.16 minutes).
These two peptides share a common precursor and fragment pair (390.23>534.6) derived from different charge states and fragment ions. This common MRM pair corresponds to the 3+ precursor and [2H+]1/y10 fragment for the TGPN peptide and the 2+ precursor and [1H+]1/y5 fragment for the MIFA peptide. Use of the CORTECS UPLC C18+ Column ensured chromatographic separation of these peaks that was not obtainable using a BEH C18 300Å (also 2.1 x 50 mm) Column. This is illustrated in Figure 4.
For tryptic peptide purification, use of a mixed-mode sorbent (reversed-phase and ion-exchange retention) provided enhanced specificity, while the µElution plate format minimized peptide loss (eliminating evaporation and reconstitution). This combination provided excellent recoveries (≥90%) for all four cytochrome C tryptic peptides. A comparison of raw area counts for the MIFA (Panel A) and GITW (Panel B) cytochrome C tryptic peptides with and without SPE clean up is shown in Figure 5. For both peptides, the SPE samples exhibited a peptide area increase of more than 2X, without any form of concentration (SPE sample load volume of 100 µL and final SPE eluate volume of 100 µL). This increase could be the result of eliminating salts or phospholipids not seen in the specific transition.
Following digestion of 35 µL of plasma and subsequent SPE clean-up, excellent linearity and single digit RSDs (relative standard deviation) for duplicate calibration curves were readily achieved. Using 1/x2 regression, the curves from all 4 tryptic peptides were linear with R2 values >0.99. A summary of standard curve performance is shown in Table 2. Results from QC analysis are shown in Table 3. For all four peptides, at all QC levels, samples demonstrated excellent accuracy and precision with an average %CV of 2.5%. Figure 6, panels A and B, demonstrate sensitivity for plasma samples at 0.5 and 2.0 µg/mL compared to the blank plasma for the EDLI and GITW peptides. Generally, the limit of quantification (LOQ) and limit of detection (LOD) are the concentrations which yield peak area counts ≥5X and 3X of the blank matrix sample, respectively. In the case of the EDLI and GITW peptides at 2.0 µg/mL, the reported LOQ peptide peak areas were 25X and 31X that of the blank plasma sample. The lowest concentration assessed was 0.5 µg/mL and was reported as the LOD. At this concentration the peptide peak areas were 7.5X and 8.3X that of the blank plasma sample. If one were to extrapolate based on the aforementioned criteria, the approximate LOD would be ~0.2 µg/mL.
This work demonstrates proof of concept for the rapid, accurate and precise quantification of the protein biomarker, cytochrome C. The combination of the ProteinWorks eXpress Digest Kit (10 minute sample digestion) and µElution SPE Clean-up Kit (15 minute SPE) allows sample preparation to be completed in ~40 minutes, while a fast, 5 minute LC-MS method allows analysis of a full 96-well plate in 8 hours. Using this kitted approach for protein quantification eliminates the need for method development and allows both inexperienced and experienced bioanalytical labs to quickly generate robust, accurate and precise data while also achieving low, single digit reproducibility.
720005699, May 2016