Expanding Detection Capabilities by Coupling Charged Aerosol Detection with the Alliance iS HPLC System for Analysis of Gadobutrol
Jennifer Simeone, Paula Hong
Waters Corporation, United States
Published on October 13, 2026

Abstract
Charged Aerosol Detectors (CADs) are increasingly used in compendial liquid chromatography methods for the quantitation of nonvolatile and semi-volatile analytes, particularly when analyte response by optical detection is limited. Implementation of the United States Pharmacopeia (USP) monograph method for gadobutrol on the Alliance™ iS HPLC System with Waters™ CAD configured as a secondary detector was evaluated. The monograph specifies ultraviolet (UV) detection for the assay and CAD detection for the analysis of organic impurities. Although the organic impurity test specifies CAD, detector-specific parameters require optimization to ensure suitable sensitivity, reproducibility, and method robustness. Key CAD parameters including evaporation temperature, data rate, and data filtering, will be assessed to establish appropriate operating conditions for the gadobutrol analysis. In addition, seamless integration of CAD within Empower™ Chromatography Data System (CDS), designed for use in regulated chromatography environments, enables streamlined instrument control, data acquisition, processing, and reporting within a compliance-ready workflow. The study will support implementation of the compendial method onto the Alliance iS HPLC System platform and provide practical guidance for optimizing CAD performance in regulated pharmaceutical analysis.
Benefits
- Successful implementation of the USP gadobutrol monograph method on the Alliance iS HPLC System with Waters CAD
- Optimized CAD conditions to improve sensitivity and method robustness while maintaining robust detection of the organic impurities
- System suitability requirements, including precision, resolution, tailing and sensitivity, were readily met using both UV and CAD
Introduction
Gadobutrol is a gadolinium-based contrast agent used in diagnostic magnetic resonance imaging1 and is subject to compendial quality testing to ensure identity, assay, and impurity control. The USP monograph for gadobutrol2 includes liquid chromatographic procedures that specify UV detection for the assay and a CAD for the evaluation of organic impurities. Because CAD provides response for nonvolatile and many semi-volatile analytes independent of strong chromophoric activity, it is well suited for impurity monitoring in applications where UV response may be limited or structurally dependent.3-5
As with any high-performance liquid chromatography (HPLC) detector, optimization of detector specific parameters is an important aspect of method development due to the impact on method performance. Parameters such as evaporator temperature, data rate, and data filtering can affect baseline behavior, sensitivity, reproducibility, and quantitative response. Therefore, successful implementation of a compendial CAD method requires careful optimization of detector parameters and verification that the method remains robust when transferred to a specific HPLC platform.
The Alliance iS HPLC System provides a modern platform for routine regulated LC analysis, and the addition of CAD as a secondary detector enables expanded detection capability while preserving conventional UV-based assay workflows. Recent updates in the Alliance iS HPLC System, data acquisition enable the user to disable collection of UV channels from the integrated UV detector. This means extraneous channels are not collected when only the data from the second detector, in this case a CAD, is needed for the organic impurities method. Integration of CAD within Empower CDS further supports regulated laboratory requirements by enabling instrument control, acquisition, processing, reporting, and data review within a familiar compliance-ready environment.
This study focuses on translating the USP gadobutrol monograph method onto the Alliance iS HPLC System, which includes the use of CAD specifically for organic impurity analysis. The objective is to identify appropriate CAD operating conditions, assess method suitability, and demonstrate how the Alliance iS HPLC System with CAD can support efficient and reliable implementation of compendial methods in regulated pharmaceutical environments.
Experimental
Sample Preparation
All samples and mobile phases were prepared according to the USP monograph for gadobutrol assay and organic impurities.2 The method was scaled from the monograph prescribed 3 µm column to a 3.5 µm column using the Waters Columns Calculator.
Gadobutrol Reference Standard (RS) (catalog #1287449) and Gadobutrol System Suitability Mixture (catalog #1287450) were obtained from the USP. Gadobutrol sample was obtained from LGC standards (product #TRC-G125705). LC/MS grade formic acid (catalog #60-048-227) and LC/MS grade acetonitrile (catalog # LC015-4) were obtained from Fisher Scientific. Samples were prepared as follows: Gadobutrol RS solutions were prepared in mobile phase A at 1 mg/mL (Assay Standard Solution), 0.005 mg/mL (Organic Impurity Standard Solution), and 0.003 mg/mL (Organic Impurity Sensitivity Solution). To a bottle containing 30 mg/mL of Gadobutrol System Suitability Mixture, 3 mL of mobile phase A was added to give a final concentration of 10 mg/mL. Gadobutrol sample solutions were prepared in mobile phase A at 1 mg/mL (Assay Sample Solution) and 10 mg/mL (Organic Impurity Sample Solution).
LC Conditions
|
LC systems: |
Alliance iS HPLC System with Tunable Ultaviolet (TUV) Detector and Waters CAD |
|
Detection: |
TUV Detector: 195 nm, Data Rate = 1 Hz CAD: Evaporator Temperature: 50 °C, Data Rate: 1 Hz |
|
Vials: |
LCGC Certified Clear Glass 12 x 32 mm Screw Neck Vial, Total Recovery, with Cap and Preslit PTFE/Silicone Septum (p/n: 186000385C) |
|
Column: |
XBridge™ BEH™ Phenyl Column, 4.6 x 250 mm, 3.5 µm (p/n: 186003965) |
|
Column temperature: |
50 °C (with preheating) |
|
Sample temperature: |
10 °C |
|
Injection volume: |
40 µL |
|
Flow rate: |
0.86 mL/min |
|
Mobile phase A: |
995:5 Formic Acid in Water, pH = 3.6: Acetonitrile |
|
Mobile phase B: |
Acetonitrile |
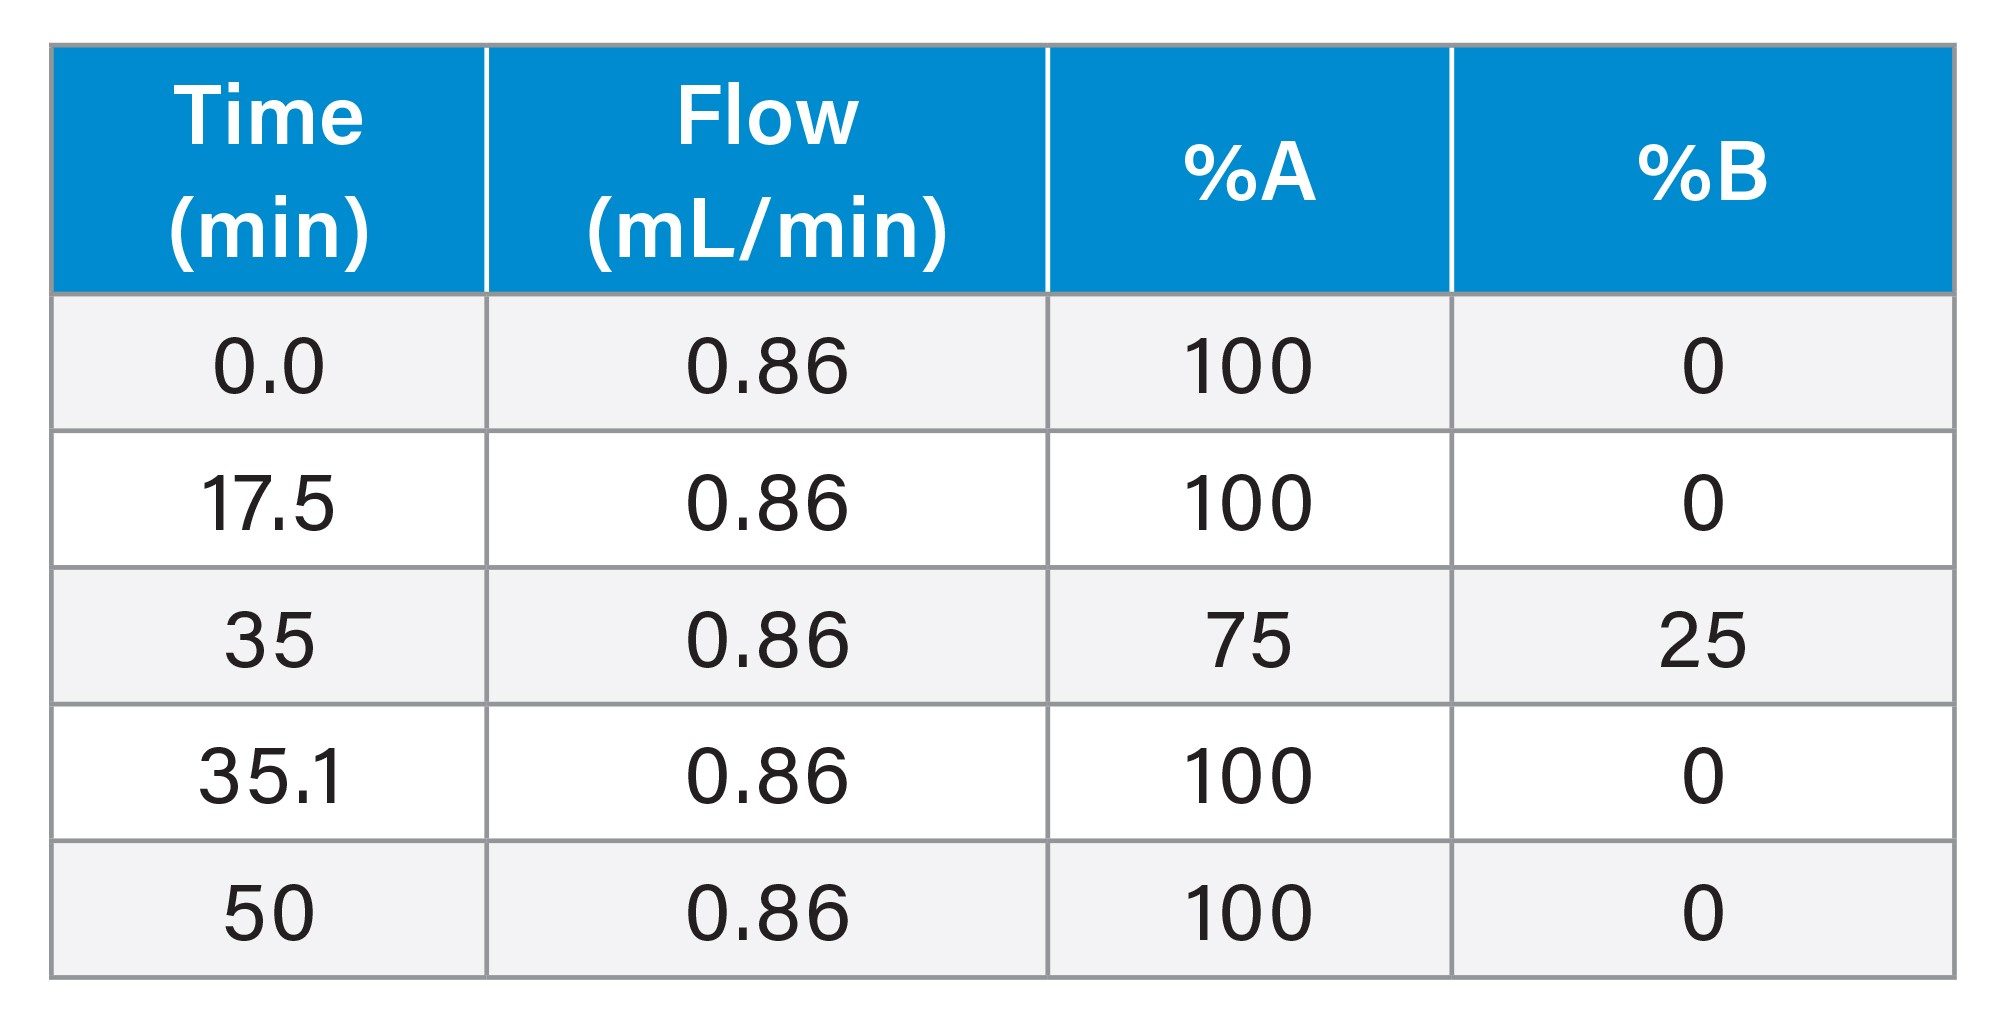
Gradient Table
Data Management
|
Chromatography software: |
Empower 3.10 Software |
Results and Discussion
The USP gadobutrol monograph is notable because it specifies UV detection for the assay and CAD for organic impurity analysis. The method also includes a peak-to-valley system suitability requirement, indicating the presence of a critical pair that must be adequately resolved. The low-dispersion design of the Alliance iS HPLC System, along with the ability to add CAD as a second detector, makes it well suited to support the chromatographic performance required for this application.
The monograph specifies the use of CAD for the organic impurity procedure, however, it does not provide any additional information on detector-specific parameters to be used. Therefore, key parameters including evaporator temperature, data rate, and data filtering were optimized to ensure adequate performance.
Optimization of Evaporator Temperature
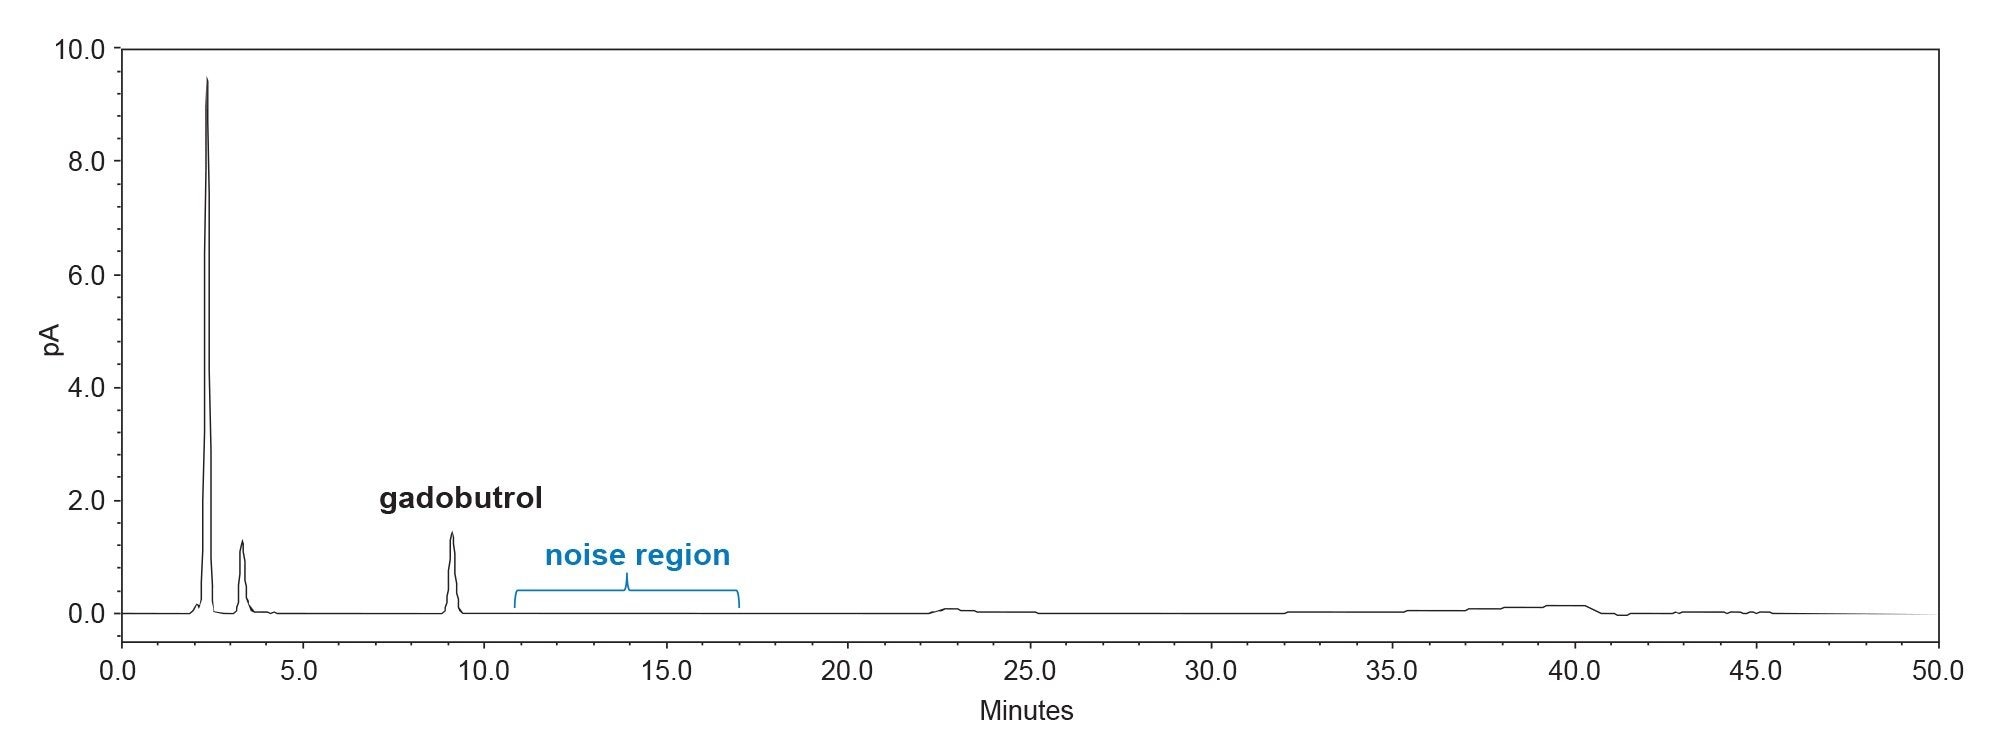
Evaporator temperature was evaluated to achieve the required signal to noise (S/N) performance set forth as a system suitability requirement of the organic impurity method, which requires a S/N value of not less than 10 for the sensitivity solution. Evaporator temperature optimization is important as it can impact analyte detection. Higher temperatures can reduce background noise due to better desolvation of the mobile phase but must be evaluated carefully as volatile or semi-volatile compounds may experience signal loss under elevated-temperature conditions. Evaporator temperatures ranging from 35 to 100 °C were evaluated, with performance assessment based on peak signal (height), peak-to-peak noise, and overall S/N. For noise calculations, peak-to-peak noise was calculated over a flat portion of the baseline (11 to 17 minutes) during the initial isocratic portion of the method (Figure 1). Although the monograph requires USP S/N be calculated, for optimization purposes, S/N was calculated using peak-to-peak noise over 11 to 17 minutes. This provides a more robust noise calculation, since USP noise is based on a single blank injection and can be skewed based on any unexpected perturbations in the baseline. The sensitivity solution was used for assessment of evaporation temperature (Figure 2).
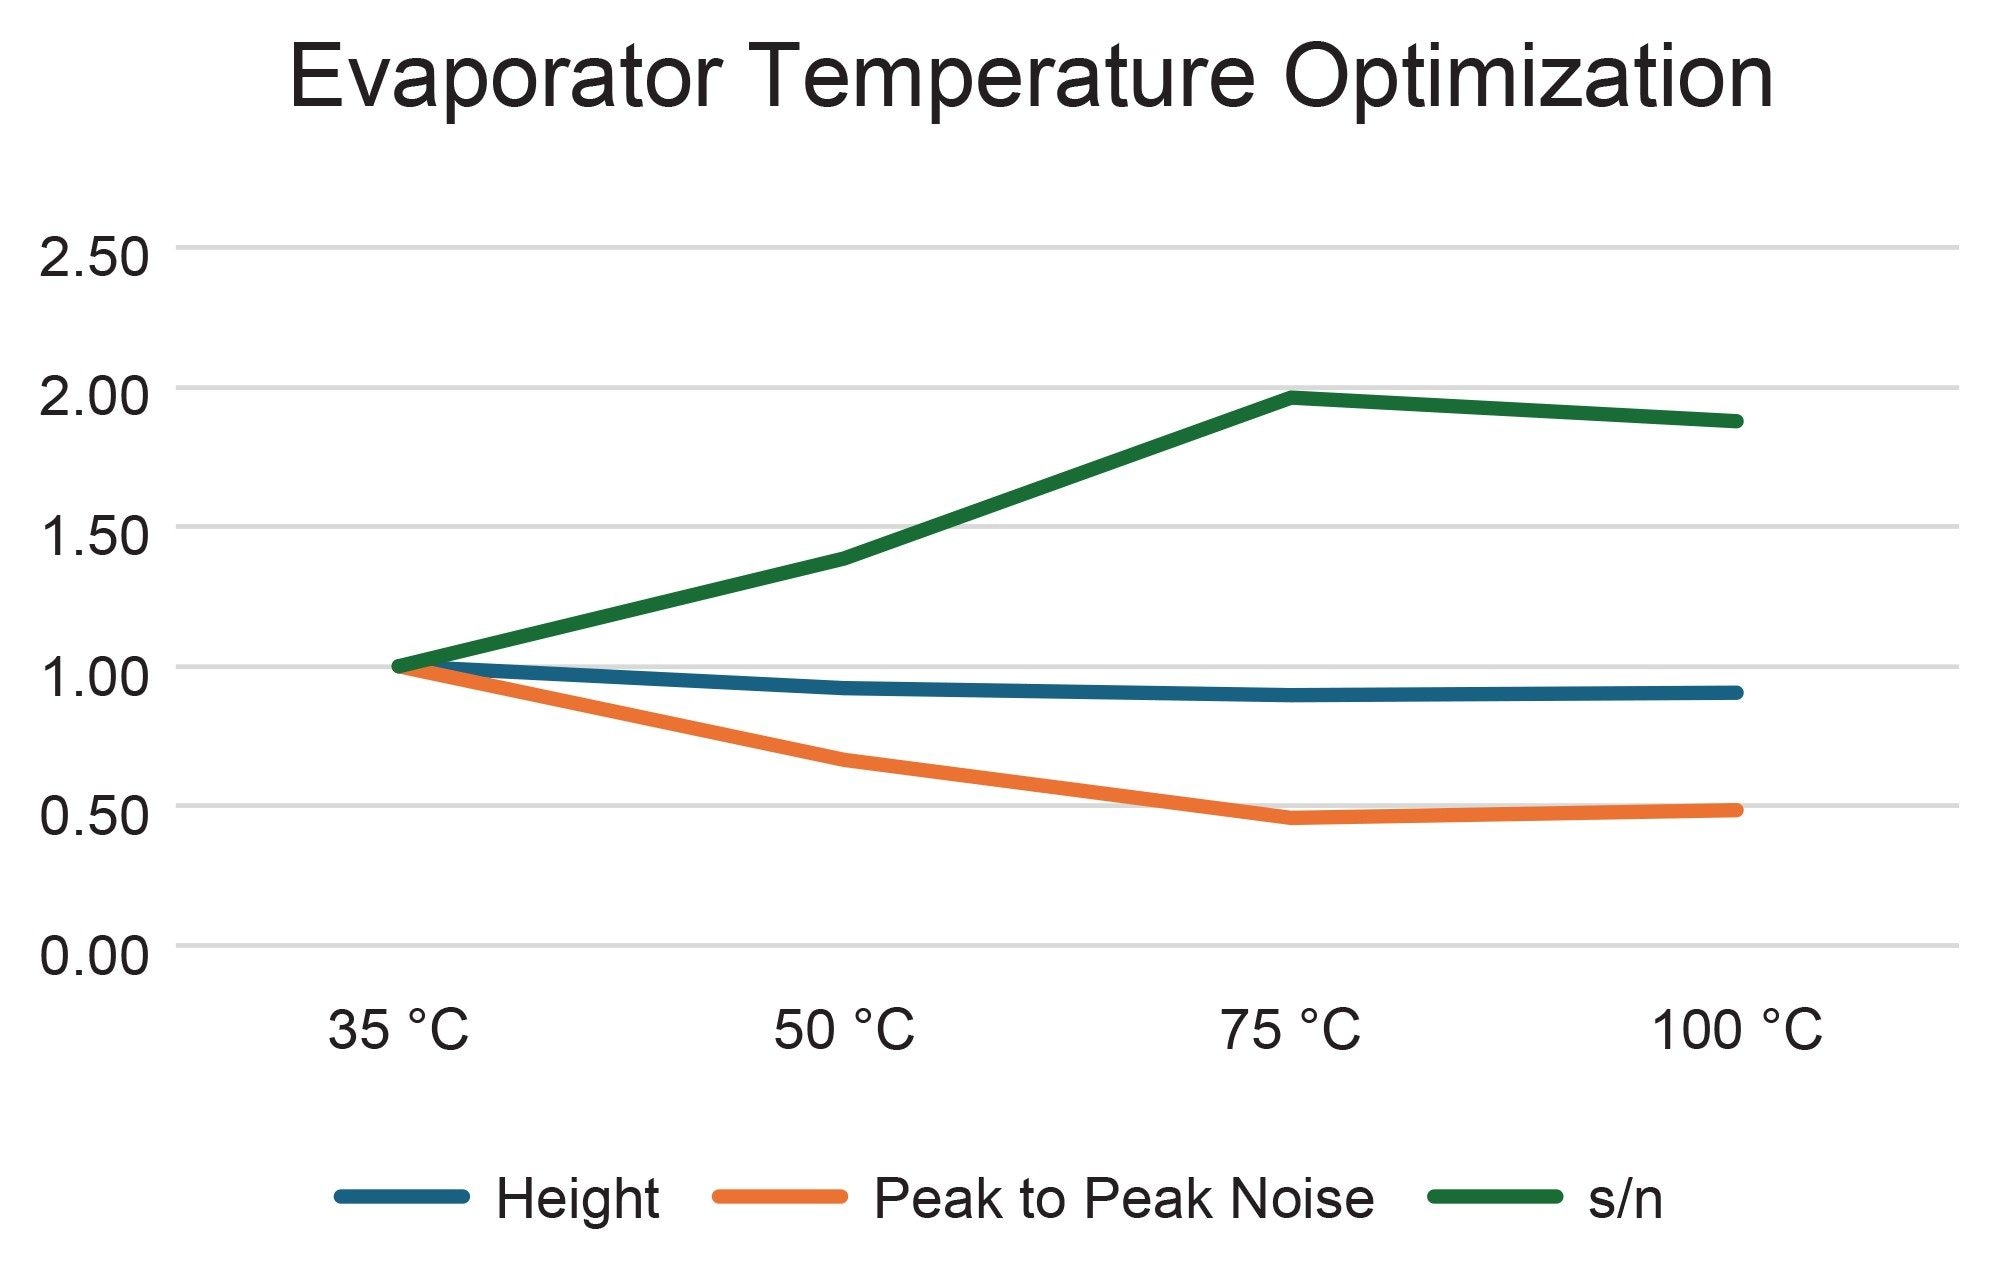
Results from varying the evaporation temperature from 35 to 100 °C show that increasing temperature does in fact decrease noise levels, as shown in Figure 2. There is a slight decrease in the gadobutrol signal as well, however the overall impact is an increase in S/N. While 75 °C provided the highest S/N, a lower temperature of 50 °C was chosen because the method is intended for impurity analysis. This lower temperature minimizes the potential loss of volatile organic impurities that could otherwise result in their under-quantification. Additionally, all S/N values in this assessment were at least 10x greater than the required S/N value of 10, demonstrating that any of the evaporator temperatures evaluated likely would be suitable for this analysis.
Data Rate and Filter Optimization
Data rate should be optimized to provide sufficient data points across the peak with a minimum recommended value generally being around 30 points.6 Keeping in mind that a data rate which is too high will result in excessively high noise which will cause a decrease in S/N. Collecting an adequate number of data points is important for accurately defining the peak shape, which can improve precision and quantitative accuracy. Assessment metrics chosen were points across the peak, peak area RSD (n = 3), peak-to-peak noise (11–17 minutes) and S/N.
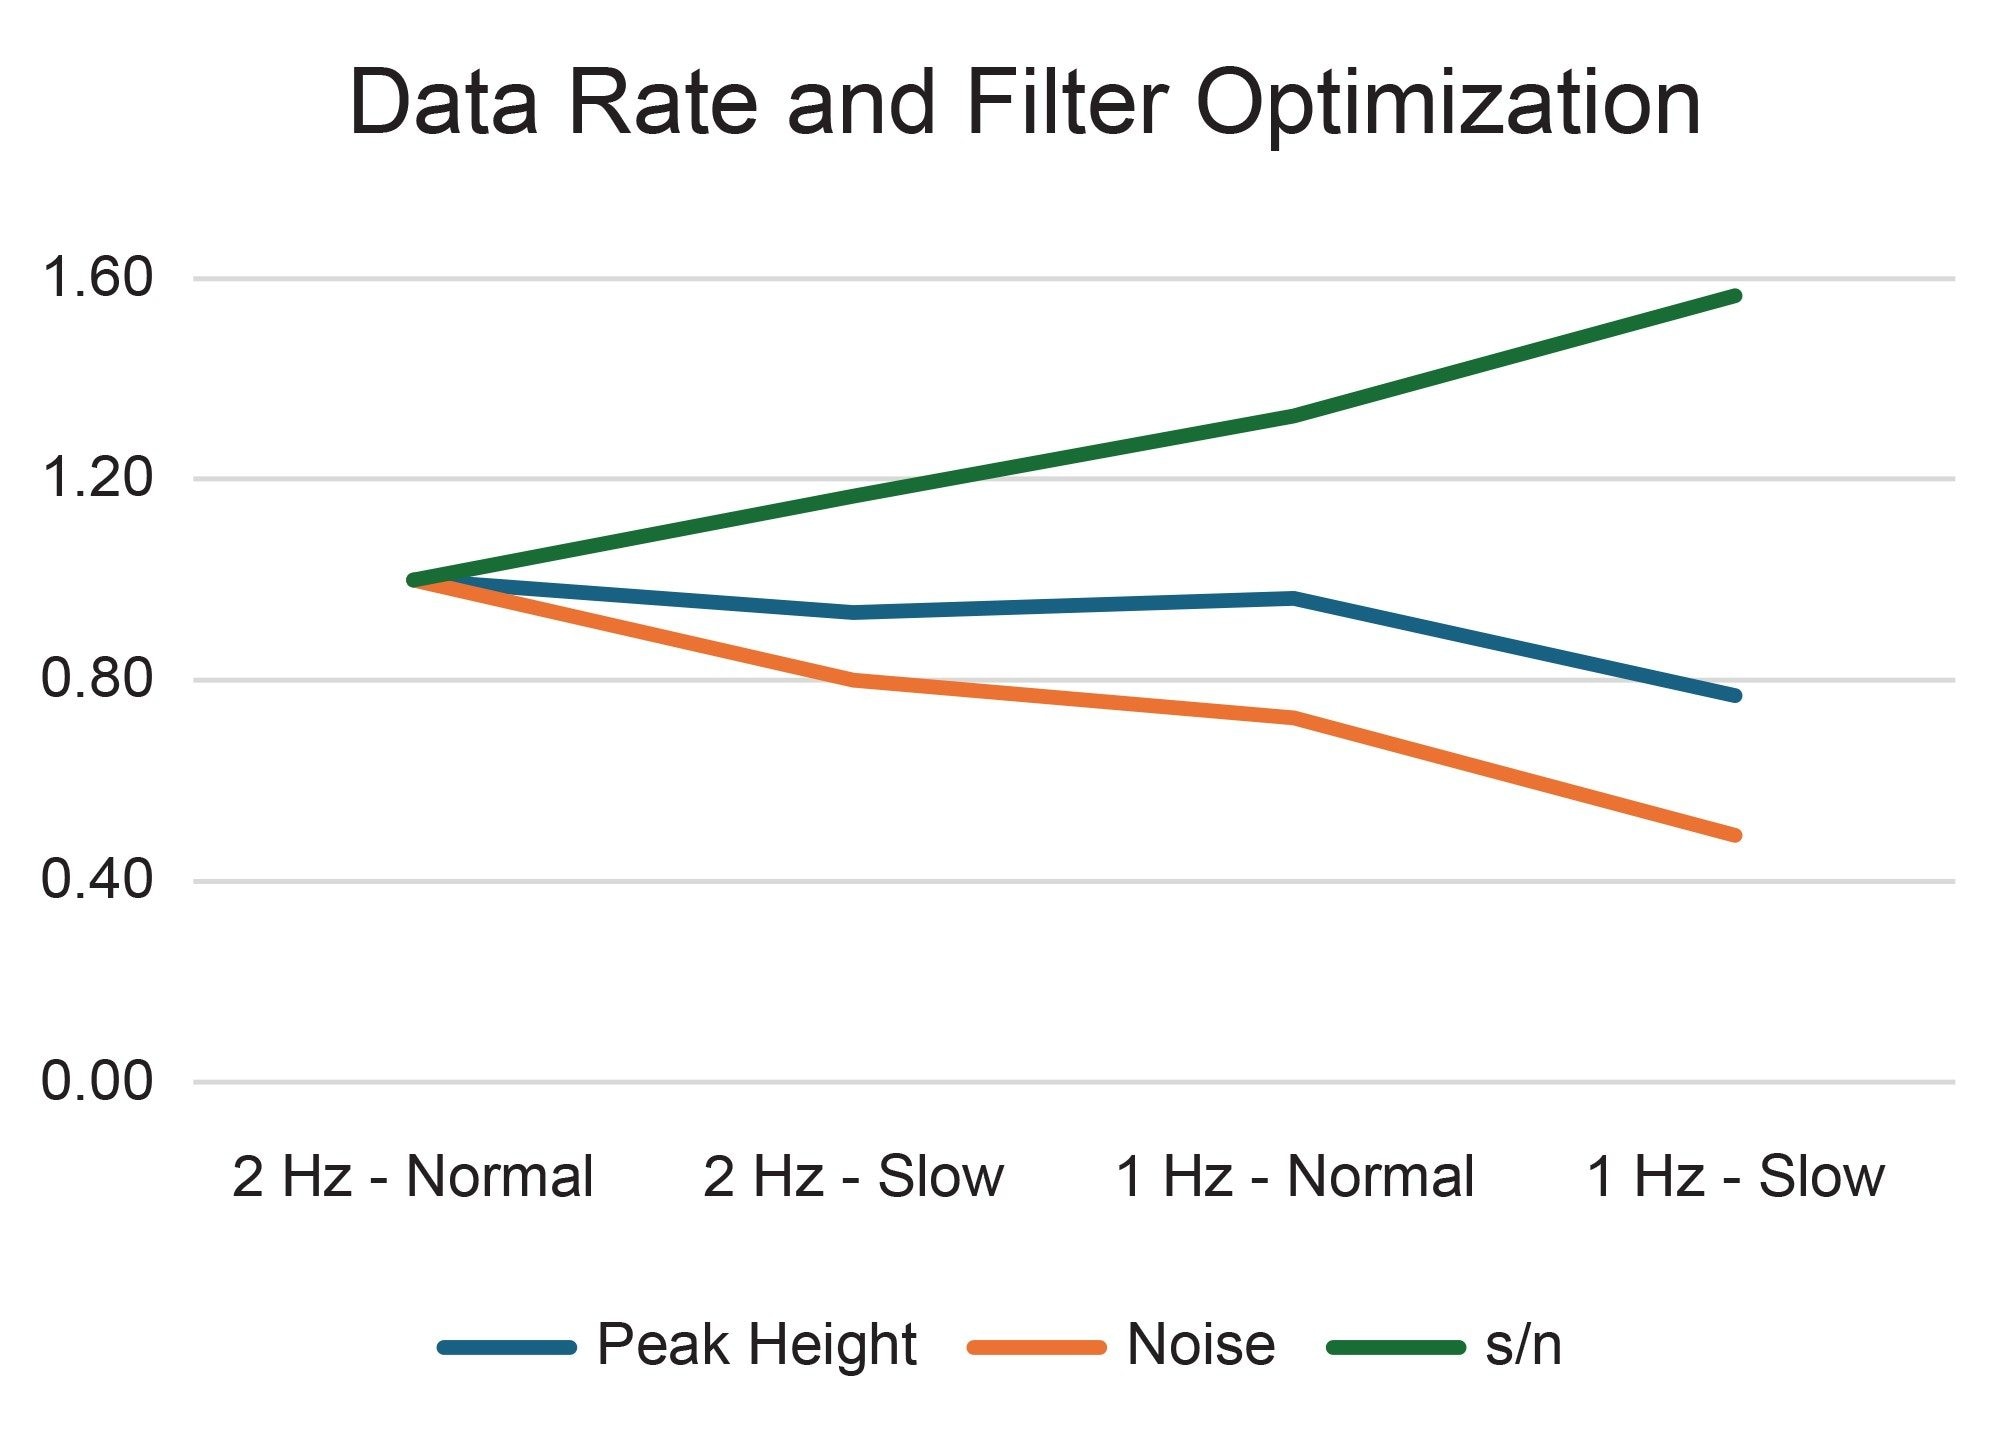
The resulting peak area RSDs for the four data rate/data filter settings evaluated ranged from 0.2 to 1.2% (data not shown), all of which are well below the requirement of not more than 10%. The measured points across the peak ranged from 34–68 (data not shown), all of which are suitable for quantitative analysis. Therefore, the final detector conditions chosen were 1 Hz with a slow filter time constant (4 seconds), since this yielded the highest S/N, largely due to the decrease in noise, which outpaced any decrease in peak height.
The final method conditions used for the gadobutrol analysis included a CAD evaporator temperature of 50 °C, a data rate of 1 Hz, and a filter time constant of slow (4 seconds).
Gadobutrol Assay (UV)
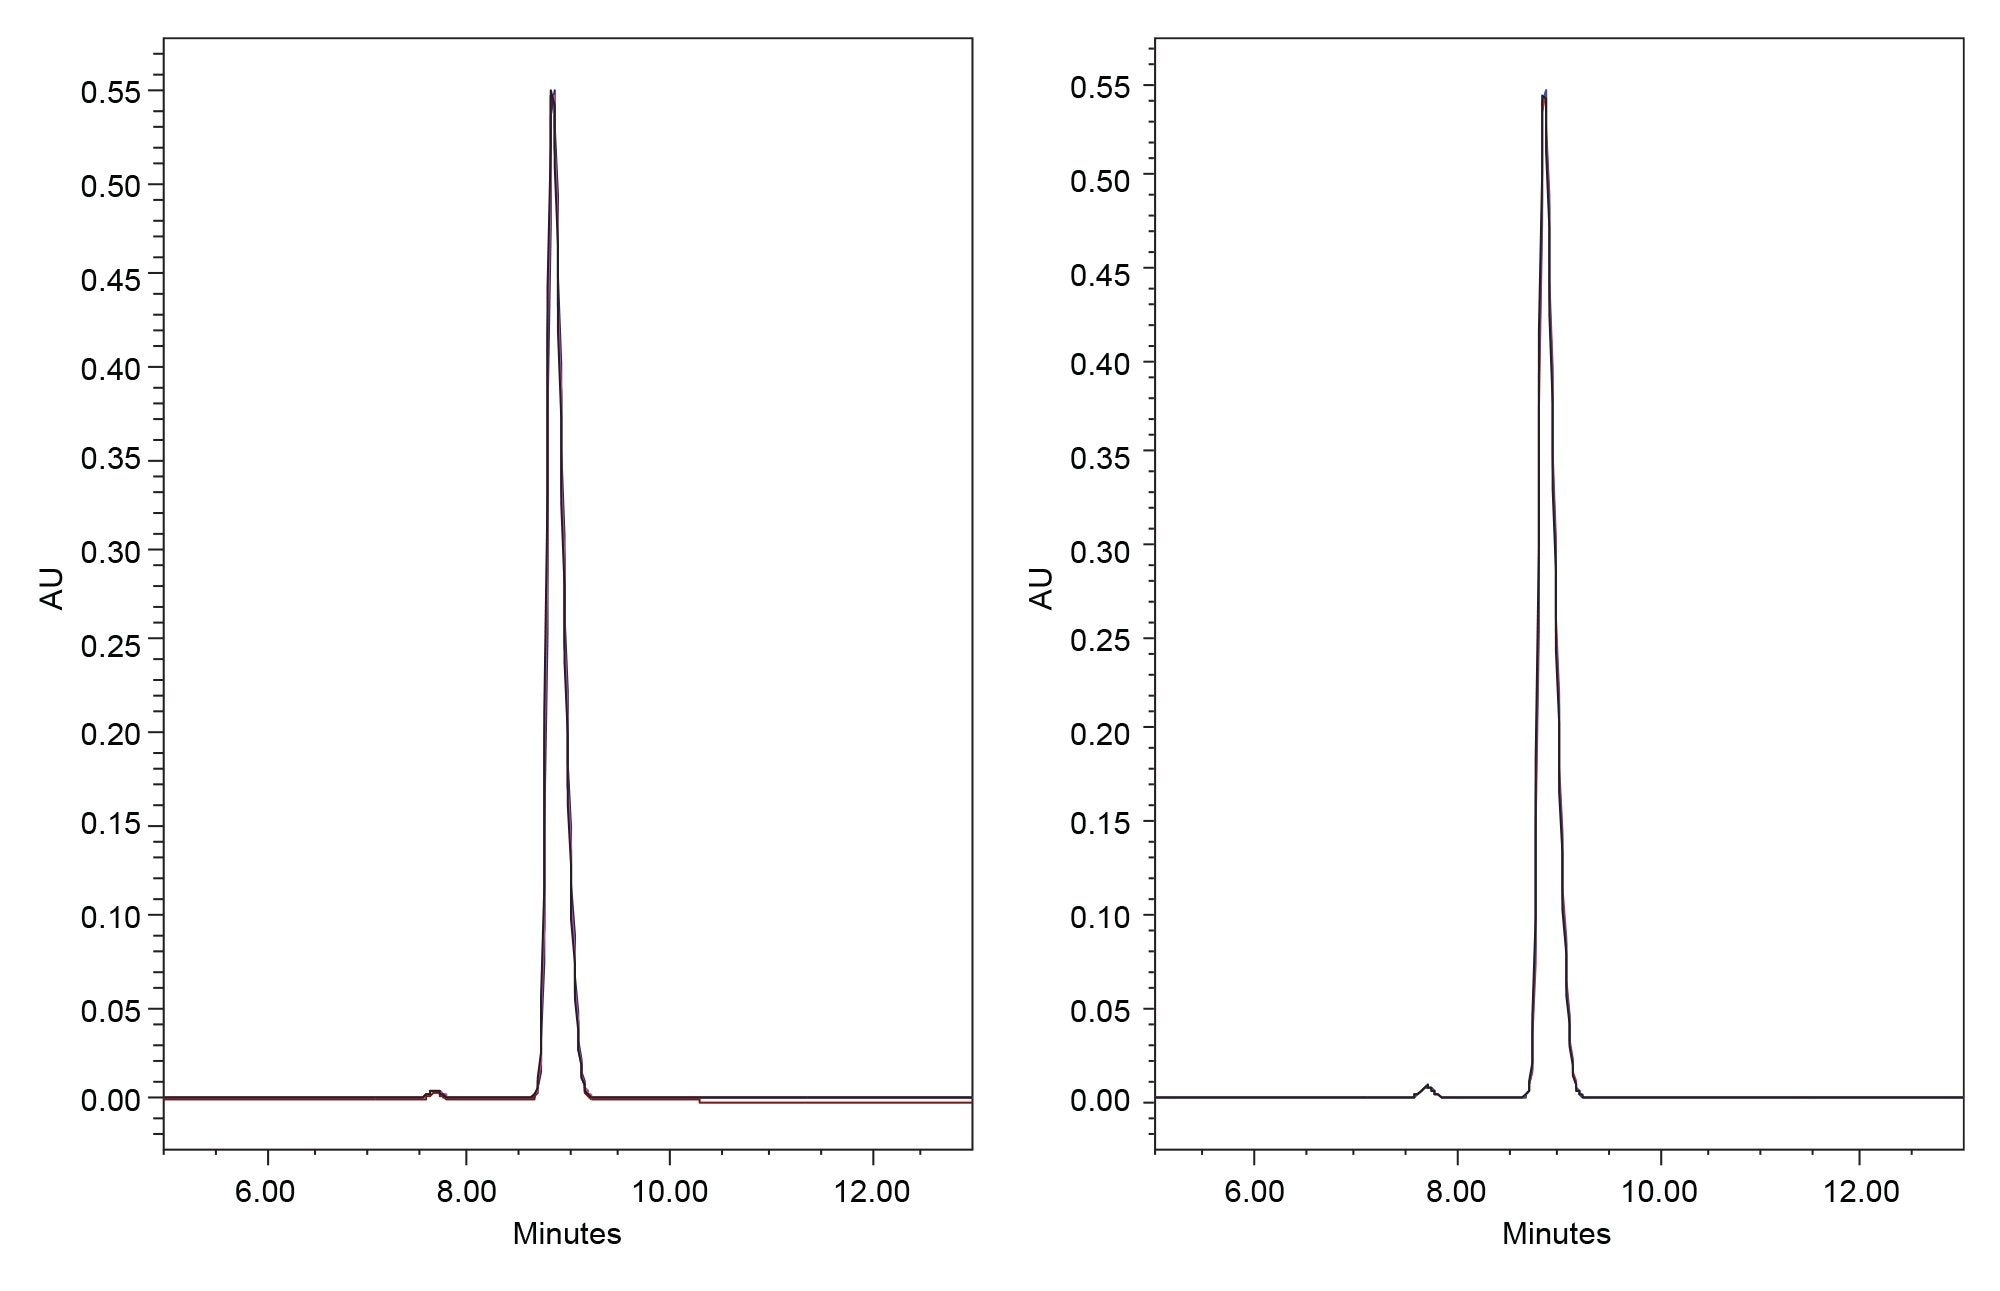
Using the optimized method, the following results were obtained for the gadobutrol assay. Overlaid chromatograms for the Assay Standard Solution and the gadobutrol Assay Sample Solution are shown in Figure 4. The monograph sets system suitability criteria, specifically peak area RSD and USP tailing factor for the Standard Solution. Both criteria were easily met (Table 1), with an observed area RSD of 0.1%, which highlights the exceptional precision of the Alliance iS HPLC System. Additionally, the peak tailing met the required value of not more than 2.5, with a measured value of 1.6. Using the calculation supplied in the monograph, the % API was measured to be 102.1%.

Gadobutrol Organic Impurities (CAD)
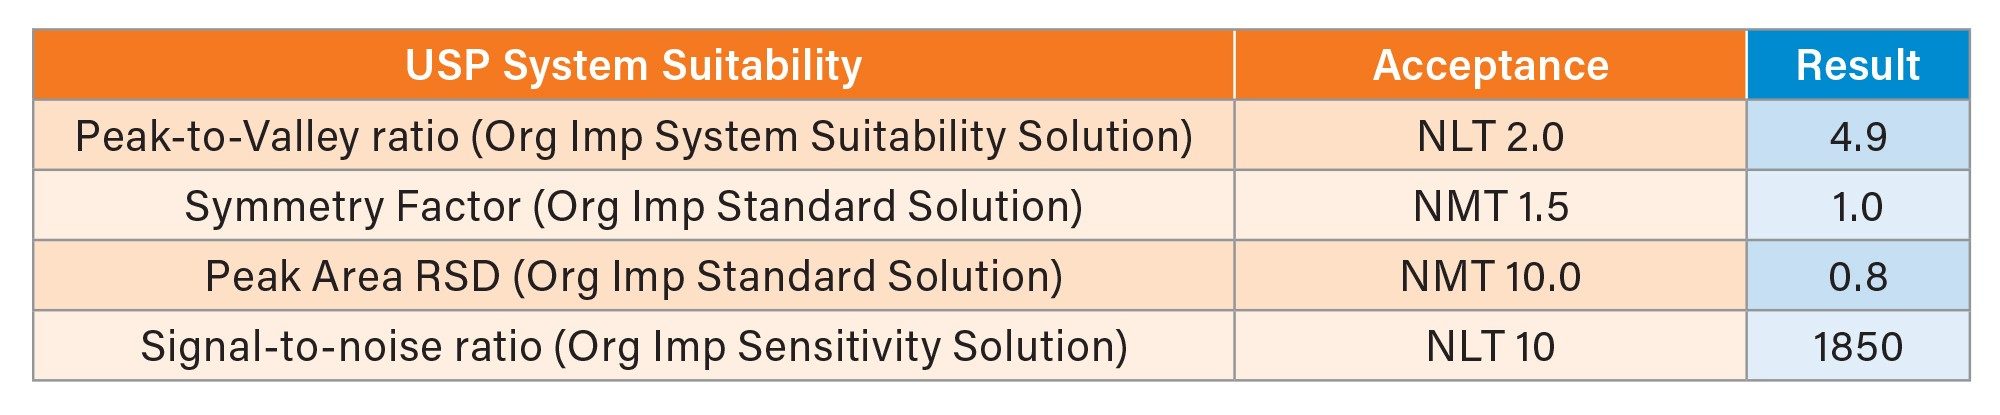
Using the optimized method, the following results were obtained for determination of organic impurities. All system suitability criteria were met (Table 2), which includes peak-to-valley ratio (System Suitability Mixture), tailing factor and peak area RSD (Organic Impurity Standard Solution), and USP S/N (Organic Impurity Sensitivity Solution). The peak tailing, which is a measure of the gaussian nature of the eluting peaks, with an ideal value of 1, was measured to be 1.0, which meets the requirement of NMT 1.5. The peak area RSD for six replicate injections was found to be less than 1%, with an allowable limit of up to 10%. Finally, the S/N value observed for the sensitivity sample was 1850. This highlights the consistent performance of both the Alliance iS HPLC System and the Waters CAD (Table 2).
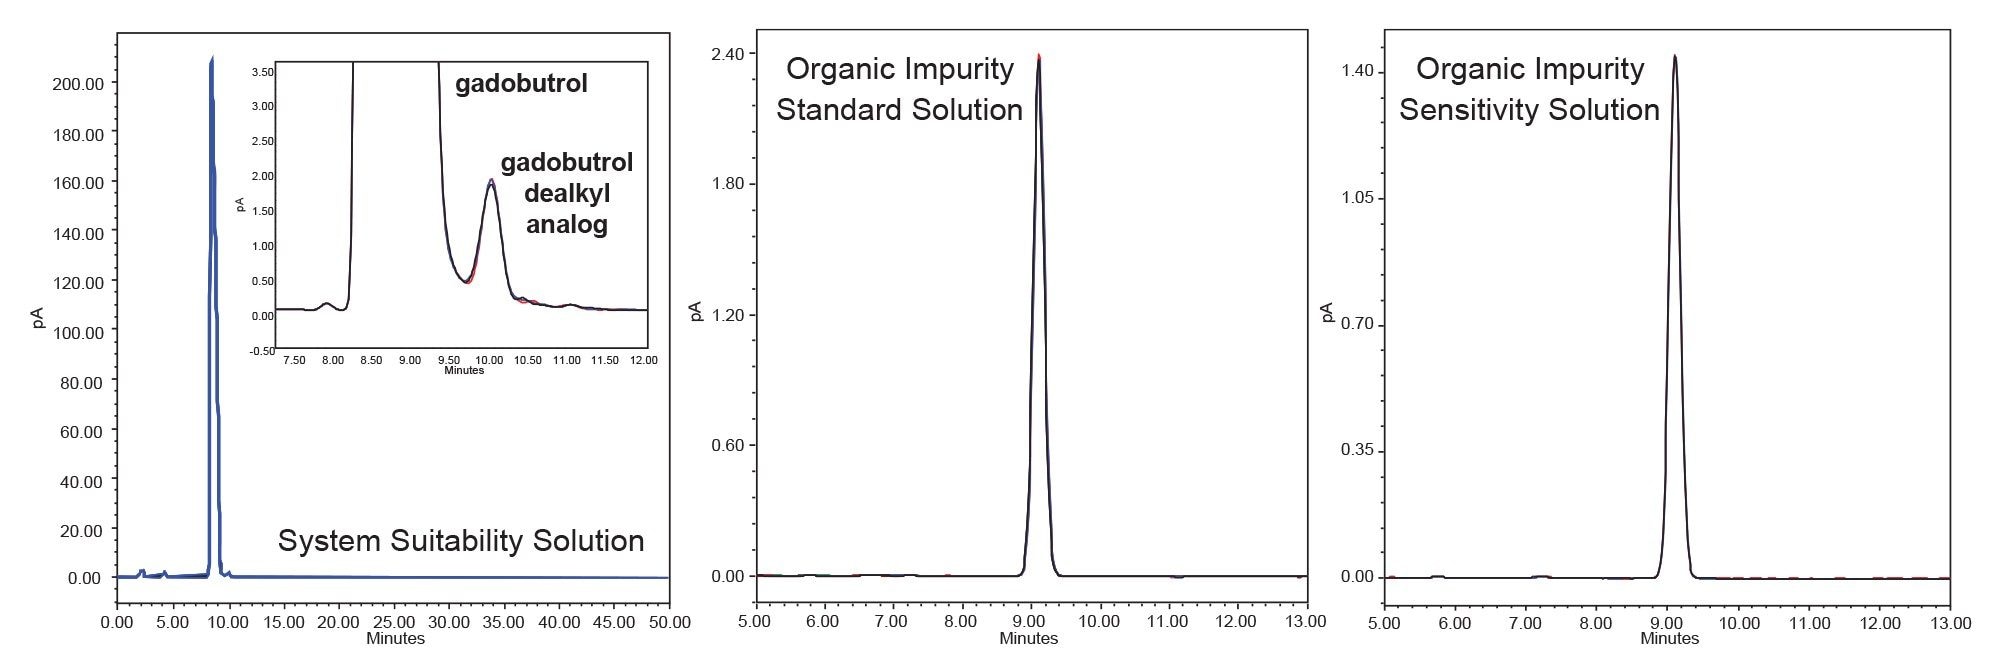
Example chromatograms for the system suitability mixture, standard, and sensitivity solutions can be seen in Figure 5. The peak-to-valley ratio is an important resolution measurement for the gadobutrol/gadobutrol alkyl analog because of their close elution, shown in the inlay of Figure 5. Bolstered by the very low dispersion of the Alliance iS HPLC System, the requirement was readily met with an observed value of 4.9 (Table 2).
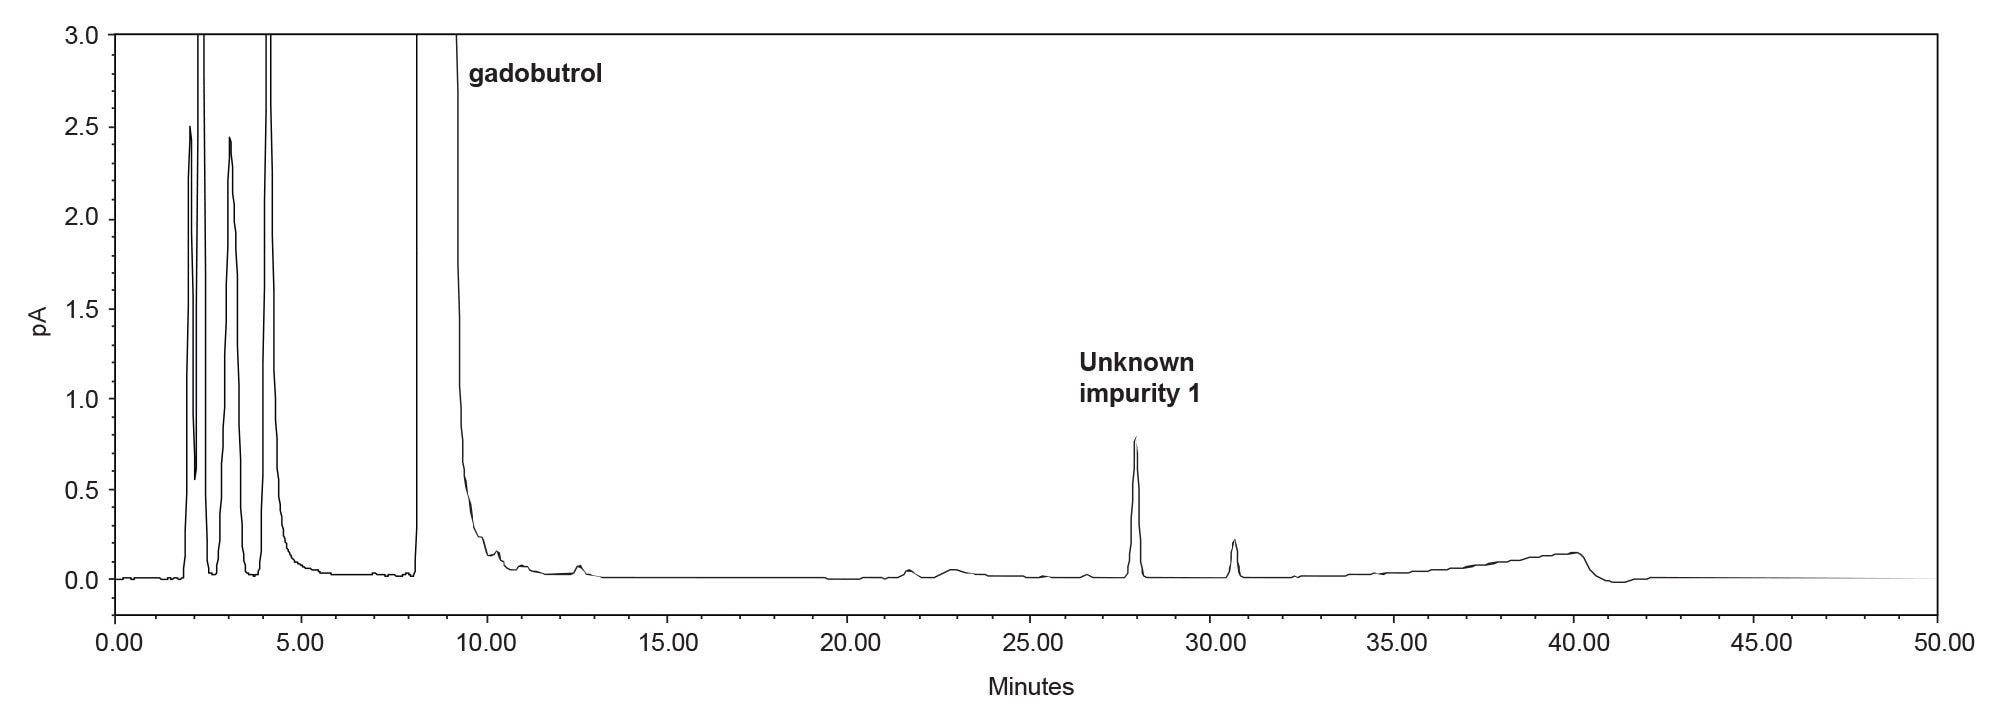
An example chromatogram for the gadobutrol organic impurity sample solution is shown in Figure 6. All peaks eluting before 5 minutes are not considered to be sample impurities as they are part of the solvent front and are observed in the standard solutions. A peak eluting at approximately 28 minutes was observed and calculated to be 0.017% relative area which is below the monograph reporting threshold of 0.03%. However, the ability to detect these low-level impurities highlights the excellent sensitivity of the method developed using the Alliance iS HPLC System coupled with the Waters CAD.
Conclusion
The USP gadobutrol monograph method was successfully translated to the Alliance iS HPLC System with a Waters CAD, demonstrating reliable performance for both UV-based and CAD-based analysis. Optimization of key CAD parameters, including evaporator temperature, data rate, and data filtering was assessed. An optimal evaporator temperature allowing for sufficient desolvation while minimizing impurity loss was determined to be 50 °C. A data rate of 1 Hz with a slow filter time constant was used as this provided the optimal S/N. Using these settings enabled sensitive and reproducible detection of gadabutrol along with impurities. System suitability requirements were readily met, with excellent assay precision, robust chromatographic resolution, low CAD peak area variability, and high sensitivity performance. These results demonstrate that the Alliance iS HPLC System with Waters CAD provides a streamlined, compliance-ready platform for implementing compendial CAD methods in regulated pharmaceutical laboratories.
References
- Scott, L.J. Gadobutrol: A Review of its Use for Contrast-enhanced Magnetic Resonance Imaging in Adults and Children. Clin. Drug Investig. 33 (2013) 303-314.
- United States Pharmacopeia. (2020). Gadobutrol. In USP-NF. DOI: https://doi.org/10.31003/USPNF_M7216_02_01
- Barnhart, W. W.; Farooq, M. Q.; Ahmad, I. A. H. A Simplified Tutorial on Charge Aerosol Detection: Understanding the Basics, Optimization, and Troubleshooting. Journal of Chromatography Open, (2024) 100181.
- Schilling, K.; Holzgrabe, U. Recent Applications of the Charged Aerosol Detector for Liquid Chromatography in Drug Quality Control. Journal of Chromatography A, 1619 (2020) 460911.
- Vehovec, T.; Obreza, A. Review of Operating Principle and Applications of Charged Aerosol Detector. Journal of Chromatography A, 1217 (2010) 1549-1556.
- Gauthier, L; Hong, P. Optimization of Detector Parameters to Improve Sensitivity using the Alliance iS HPLC System with PDA Detector. 720008901, June 2025.
720009606, October 2026