Advancing Sensitivity and Efficiency in Released N-Linked Glycan Analysis With the ACQUITY™ QDa™ II Mass Detector
Abstract
Single quadrupole mass detectors (MS) are becoming increasingly prevalent in quality control (QC) labs. These small compact detectors offer the sensitivity and specificity of mass analysis while maintaining the robustness, reliability, and ease of use that is required of detectors in regulated environments. Complementing optical detection, single quadrupole mass detectors offer an extra dimension of data without adding additional complexity into the analytical workflow. Waters has recently launched the next generation of single quadrupole mass detection, the ACQUITY QDa II Mass Detector, as a cost-effective tool for enhancing analytical capabilities for the modern manufacturing lab. Designed for ease of use and robustness, the ACQUITY QDa II Mass Detector offers an extended mass range for enhanced sensitivity and specificity. Its compact design allows for seamless integration with existing lab setups, while its greater energy efficiency supports sustainable lab practices and reduces operational costs.
In this application note, the ACQUITY QDa II Mass Detector will be used with the ACQUITY Premier System and an ACQUITY Premier Glycan BEH™ Amide Column (130 Å, 1.7 µm, 2.1 x 150 mm) to analyze common glycan assays as part of manufacturing activity for monoclonal antibodies (mAbs). Complementing fluorescence detection (FLR), the ACQUITY QDa II Mass Detector enables the detection of low-level impurities, such as mannose-5 glycans, and provides comprehensive glycan profiling without compromising operational simplicity.
Benefits
- The ACQUITY QDa II Mass Detector can complement FLR workflows for routine analysis of glycans from mAb drug products
- The ACQUITY QDa II Mass Detector combines an extended mass range with compact, robust design and Empower™ Software control, making it ideal for QC labs aiming to streamline glycan workflows
- The ACQUITY QDa II Mass Detector provides improved sensitivity for quantitating and identifying impurities
Introduction
Glycosylation is a post-translational modification in which carbohydrate structures are attached to proteins. These carbohydrates play a pivotal role in protein folding, stability, and function. Glycosylation is a naturally occurring process that can be influenced by various factors, including the choice of cell line, culture conditions, and purification processes.1 Consequently, with various parameters influencing glycosylation, glycosylation profiles can vary between manufacturing batches of protein-based therapeutics, leading to variations in product quality. These profiles are closely monitored throughout the manufacturing process to maintain process control and are recognized as a critical quality attribute (CQA) for therapeutic mAbs as the glycan profile can affect efficacy and immunogenicity.
Analytical assessment of glycosylation is typically performed by enzymatically or chemically releasing the glycans from the protein, labeling them with a fluorescent tag, and analyzing them with a FLR. Hydrophilic interaction chromatography (HILIC) is often used as the separation technique of choice because it can effectively separate highly polar and hydrophilic compounds. Waters has commercialized a labeling kit called RapiFluor-MS™ N-Glycan Kit for the analysis of released N-glycans. This reagent enhances the sensitivity for both FLR and MS detection with derivatization being performed in as little as thirty minutes, creating a seamless workflow for rapid, sensitive glycan analysis when paired with the ACQUITY QDa II Mass Detector. As part of its offering, the RapiFluor-MS labeling kit is designed to support labs across the drug pipeline allowing scientists to utilize orthogonal mass information as part of characterization and monitoring workflows while facilitating easier method transfer between labs.
In this study, several RapiFluor-MS test standards were analyzed using the ACQUITY FLR Detector and ACQUITY QDa II Mass Detector. A dextran calibration ladder was used to generate a glucose unit (GU) calibration curve. GU measurements were used to standardize retention times of glycans to identify glycans quickly and accurately. This dual detector configuration was also used to assess mannose-5 glycan impurities, which are a known CQA that directly impacts efficacy and immunogenicity of mAbs.
Experimental
RapiFluor-MS Glycan Performance Test Standard (p/n: 186007983), RapiFluor-MS Dextran Calibration Ladder (p/n: 186007982), and RapiFluor-MS High Mannose Test Standard (p/n: 186008317) were dissolved in 9 µL of water, 10 µL of dimethylformamide (DMF), and 21 µL of acetonitrile. Intact mAb Mass Check Standard (p/n: 186006552) was reconstituted in 100 µL of 0.1% formic acid in water.
LC System Conditions
|
LC system: |
ACQUITY Premier System |
|
Detection: |
ACQUITY FLR Detector (λexcitation=265 nm, λemission=425 nm) |
|
Column: |
ACQUITY Premier Glycan BEH Amide Column, 1.7 µm, 130 Å, 2.1 x 150 mm (p/n: 186009524) |
|
Vials: |
QuanRecovery™ with MaxPeak™ HPS Vial and pre-slit PTFE silicone cap (p/n: 176004434) |
|
Column temperature: |
60 °C |
|
Sample temperature: |
10 °C |
|
Injection volume: |
1 µL |
|
Mobile phase A: |
50 mM ammonium formate in water |
|
Mobile phase B: |
Acetonitrile |
|
Chromatography software: |
Empower 3.8.1 |
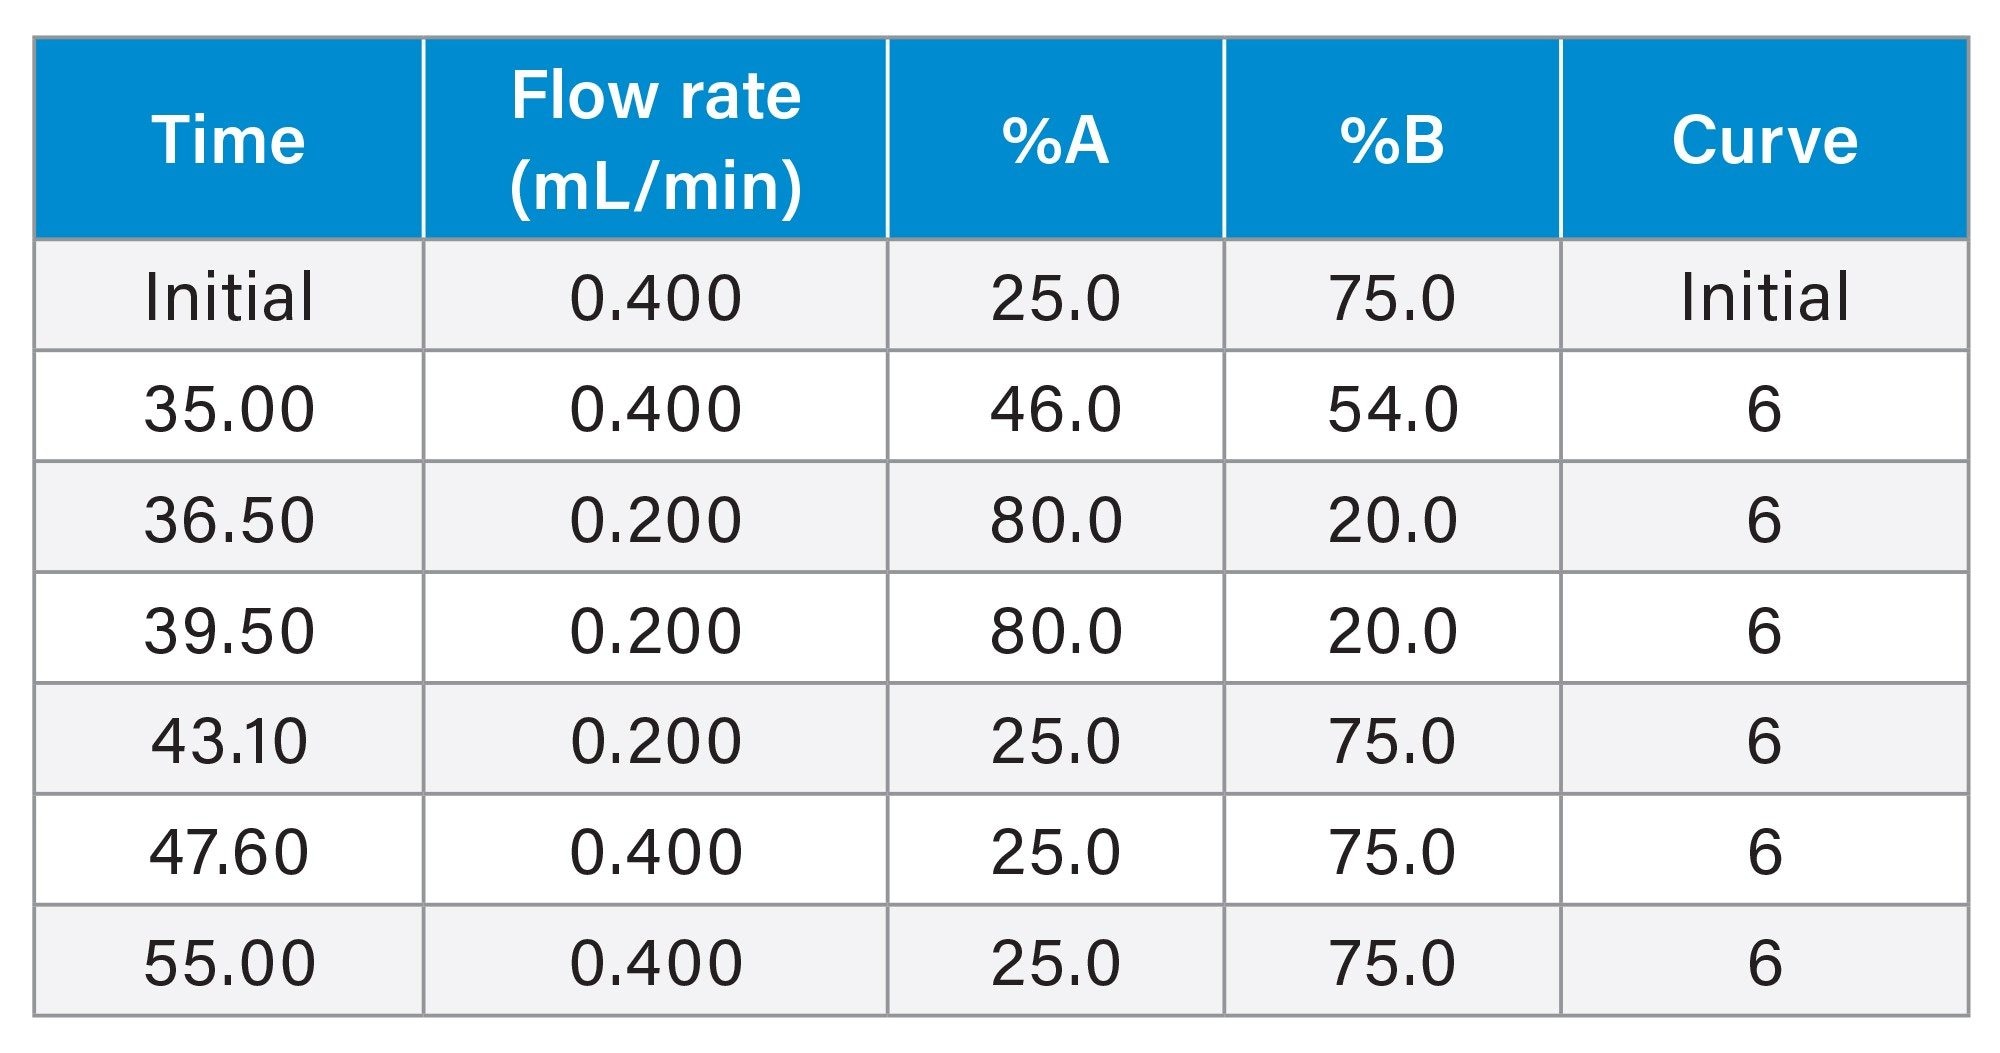
LC Gradient
MS Detector Settings
|
LC system: |
ACQUITY QDa II Mass Detector |
|
Ionization mode: |
ESI + |
|
Scan rate: |
5 Hz |
|
Acquisition range: |
350–1500 m/z |
|
Capillary voltage: |
1.5 kV |
|
Cone voltage: |
20 V |
|
Probe temperature: |
500 °C |
|
Chromatography software: |
Empower 3.8.1 |
Results and Discussion
GU Values
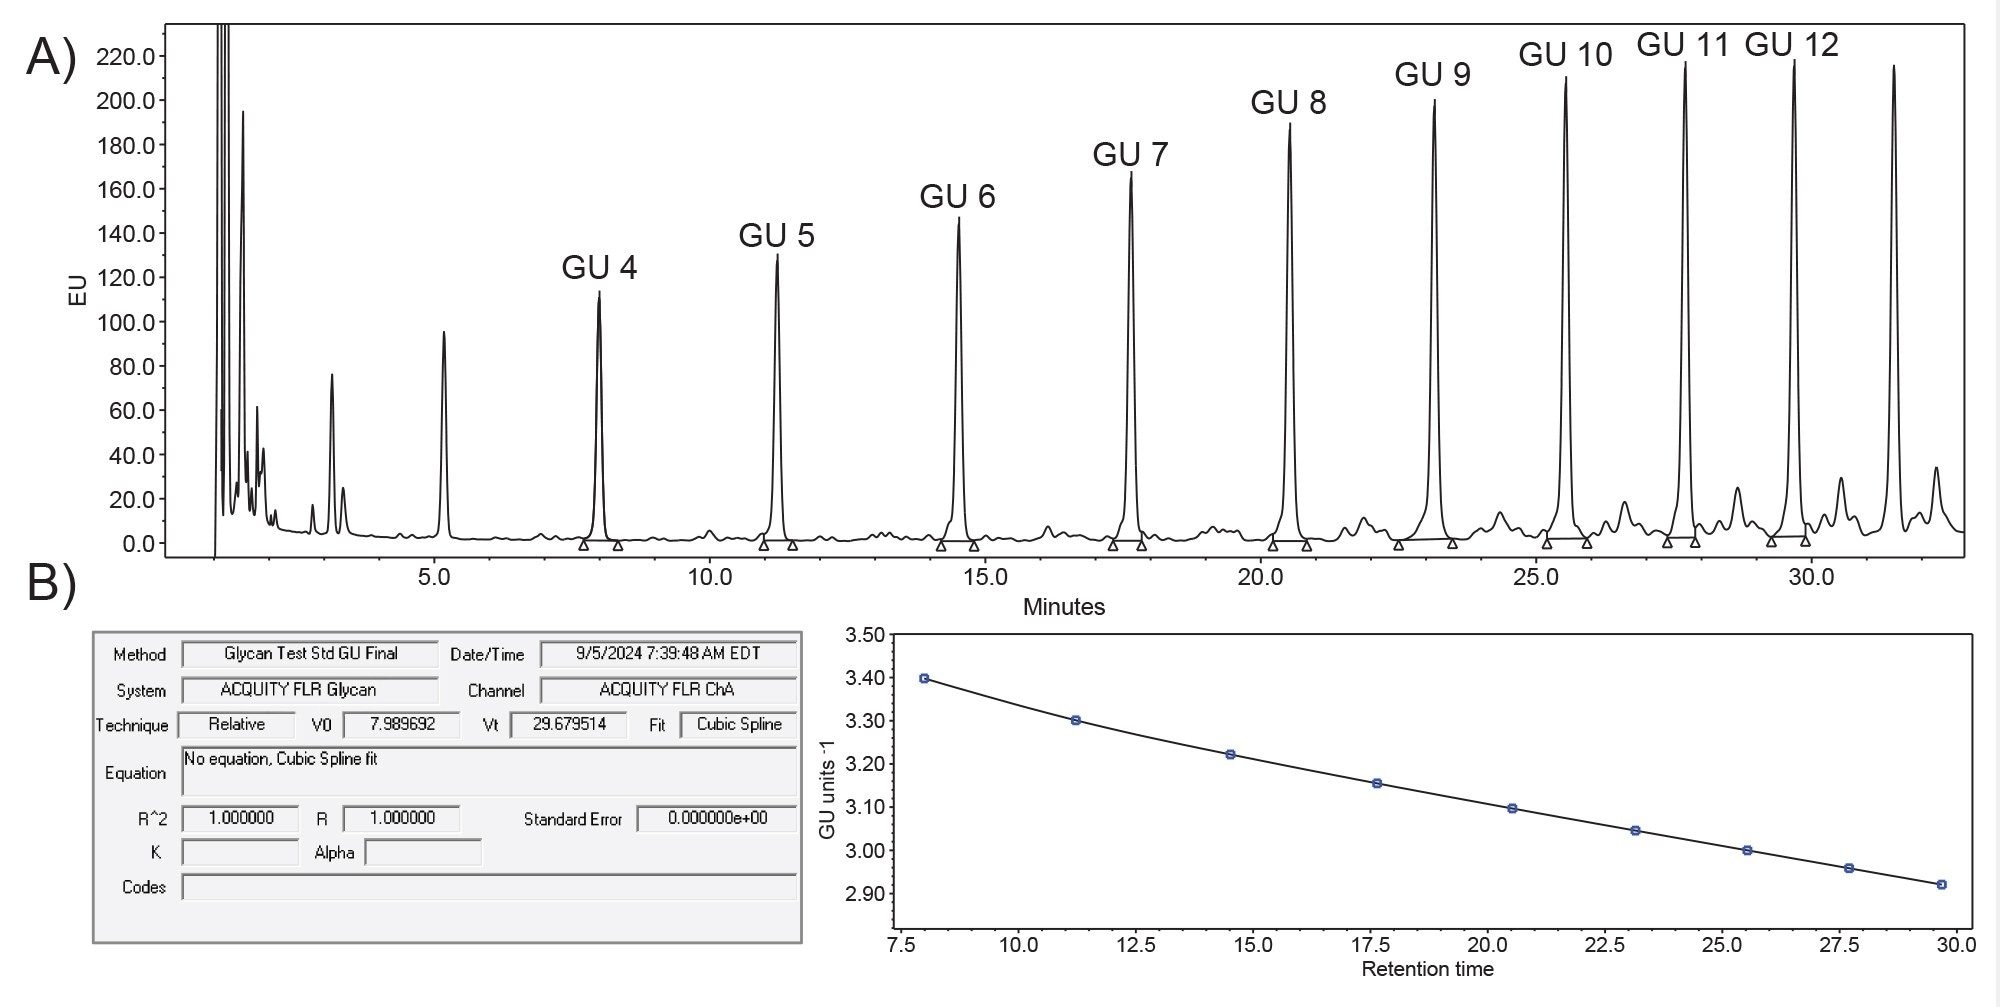
Chromatographic reproducibility is crucial in QC analysis to ensure regulatory compliance, data integrity, and product quality. One application where consistency and reproducibility are of importance in glycan analysis is in generating glucose unit (GU) values. GU values standardize and compare retention times of glycans to a known database, which allows scientists to identify unknown glycan species by their retention time.2 When combined with mass data, this assay can quickly provide insight into identifying specific glycans. To assign GU values, an external calibrant, such as the RapiFluor-MS Dextran Calibration Ladder, was used to generate a GU calibration curve based on retention time and molecular weight. To maintain compliance, the calibrant data was acquired and processed using Empower for a software generated calibration curve using a cubic spline fit (Figure 1). This fit adjusts the calibration curve on a point-by-point basis to a cubic polynomial fit. The GU values selected ranged from 4–12 GU in order to encompass a wide range of glycans that can be present in the sample.
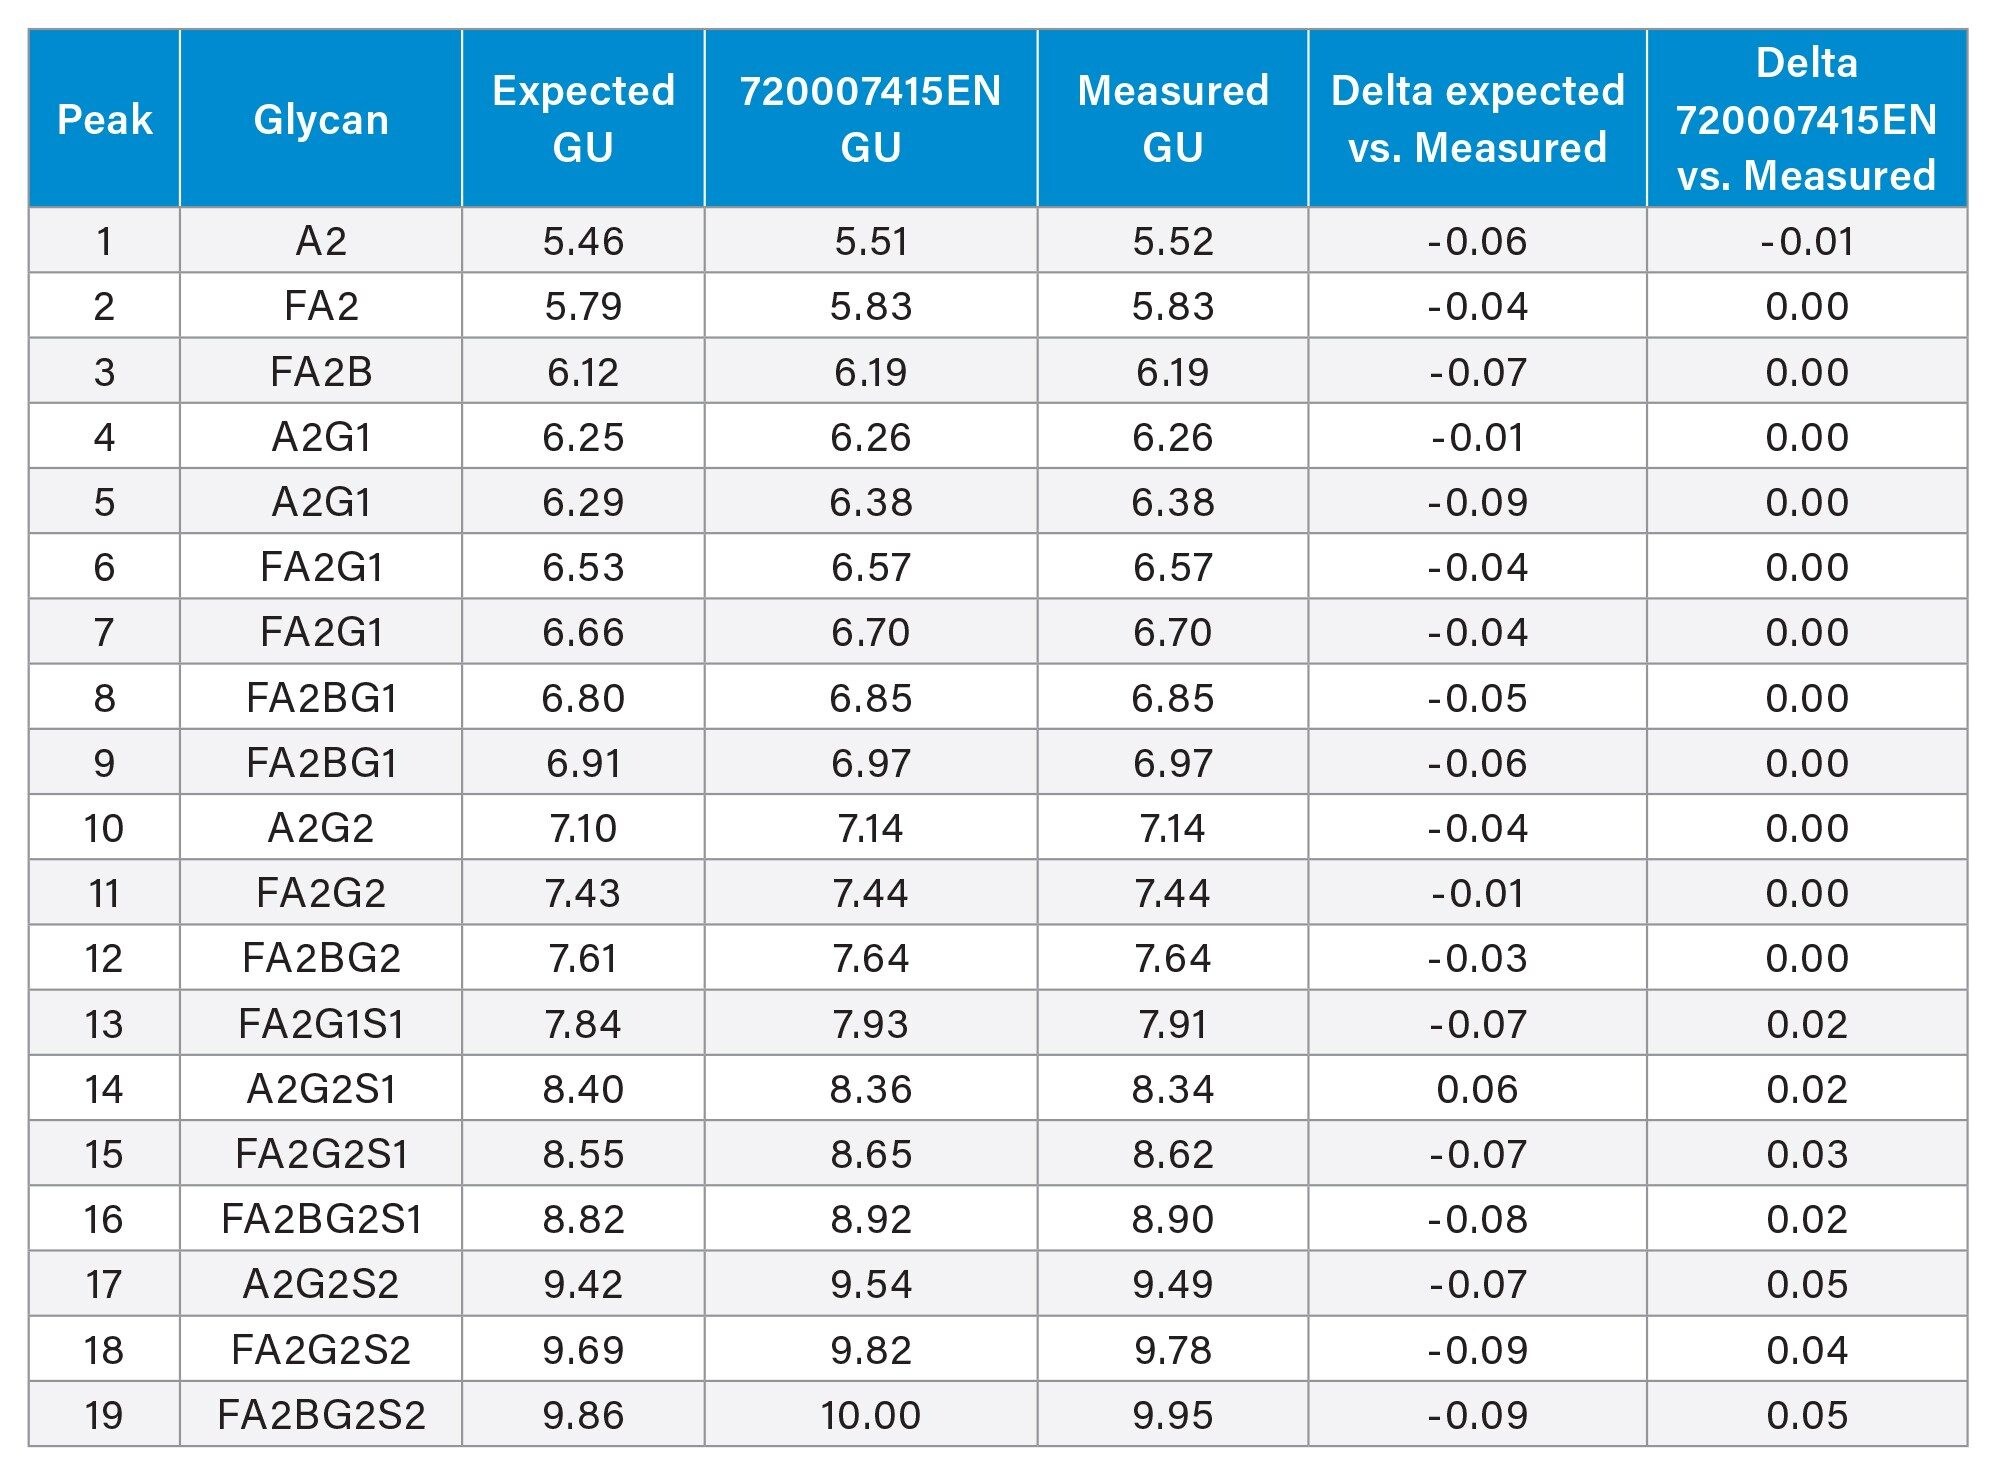
In regulated labs, consistent and robust data is critical for maintaining production processes and ensuring product consistency in adherence to regulatory guidelines and standards. To evaluate the consistency of the GU calibration curve, the RapiFluor-MS Glycan Performance Test Standard was analyzed and compared to GU values determined in a previous application note.3 The RapiFluor-MS Glycan Performance Test Standard contains 19 glycans and their expected GU values and average mass are listed in Table 1. Comparing the expected GU values to the experimental GU values, the delta is within 0.1 GU which shows results are in-line with specifications. Comparing the experimental GU values with results from the previous application note, the delta is within 0.05 GU which illustrates superb reproducibility, even in samples analyzed several years apart by different instruments, analysts, and labs.
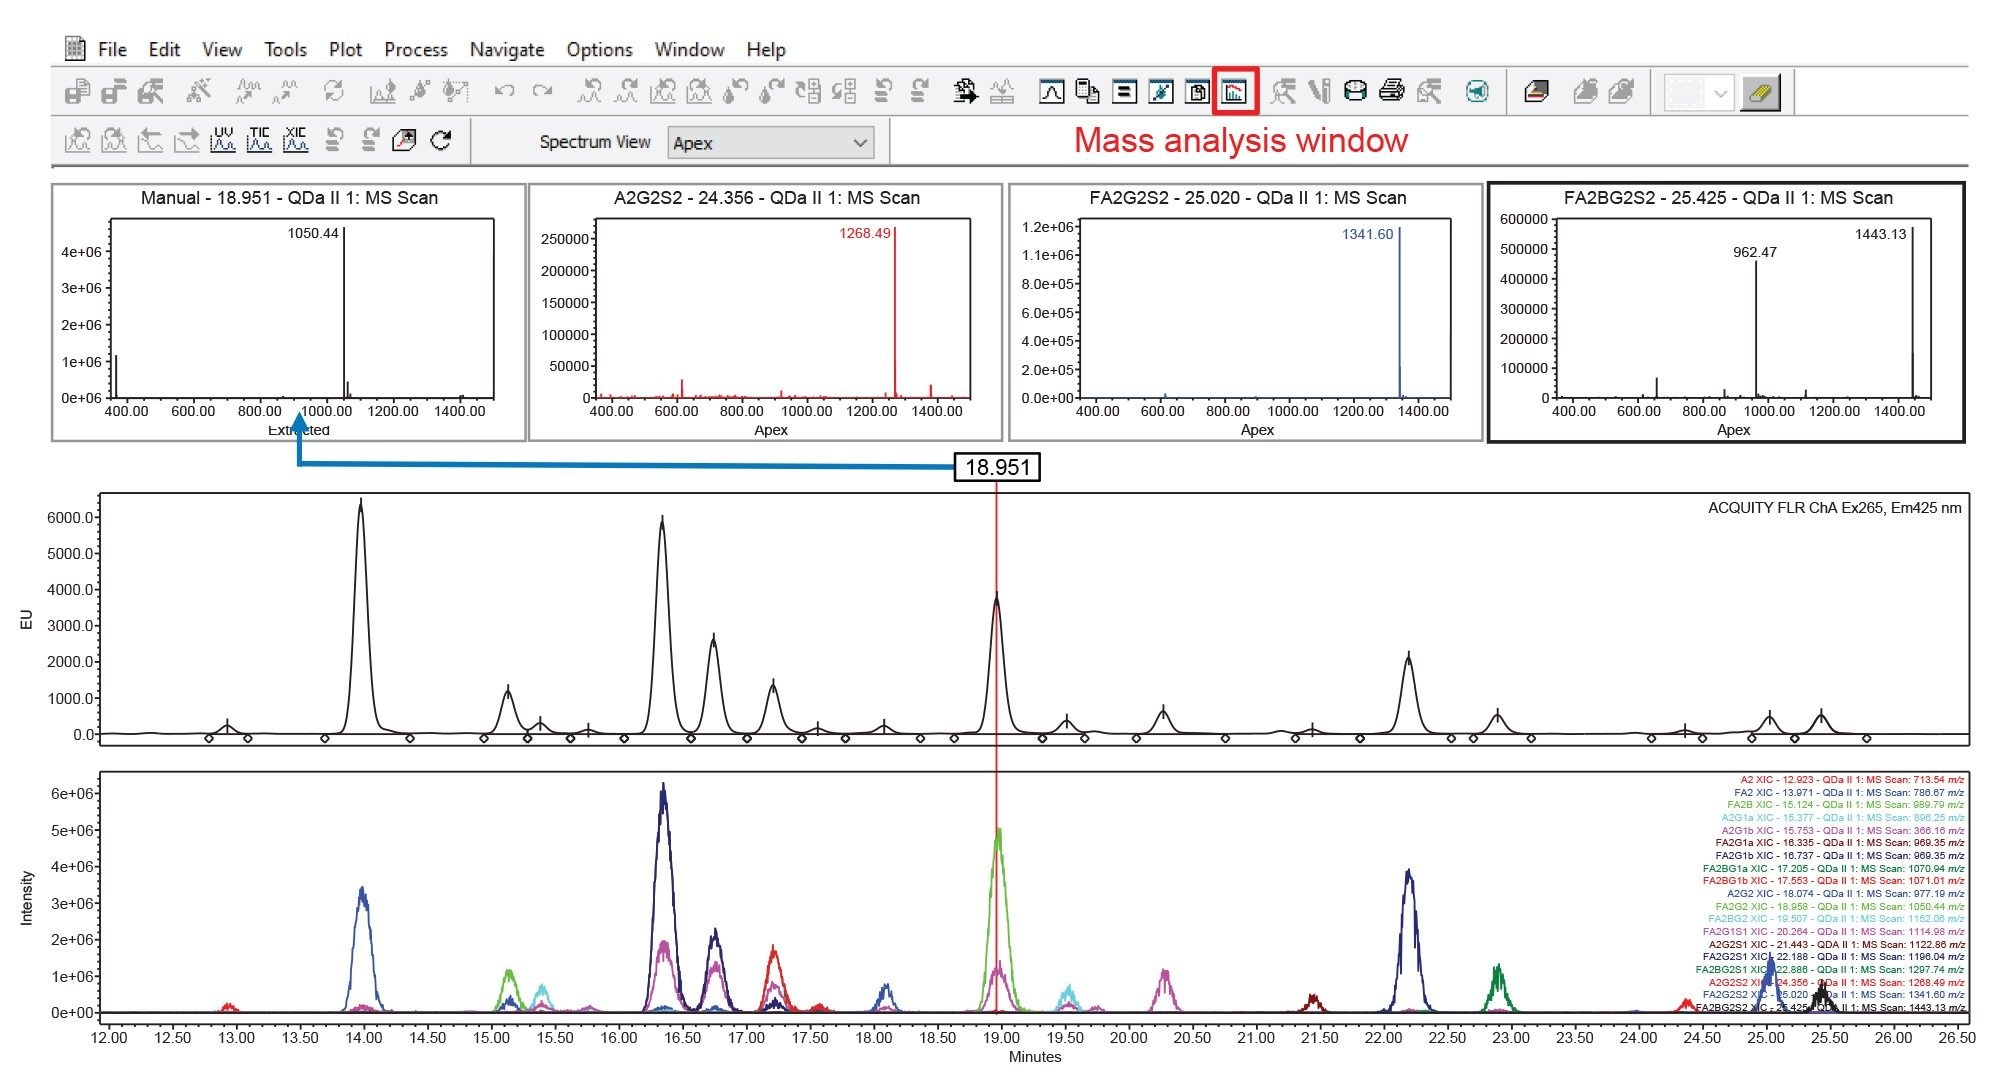
The ACQUITY QDa II Mass Detector is fully compatible with Empower 3 Software control, ensuring seamless integration and compliance with optical workflows. This allows users to leverage Empower’s capabilities for acquisition, processing, and data reporting for mass analysis, while benefiting from the ACQUITY QDa II Mass Detector’s easy-to-use, energy efficient, and compact design. One notable feature is the mass analysis window in Empowers data processing interface, as shown in Figure 2. The mass analysis window can be used to quickly view and analyze optical and mass spectra data from a single result. This window displays the optical chromatograms, the MS total ion chromatogram (TIC) plot, the MS spectra for every integrated peak, and an overlay of the extracted ion chromatograms (XIC) of the prominent ions. Users can also extract spectra data using a retention time slider to quickly probe mass data related to peaks of interest, an example of which is shown in Figure 2 for the peak eluting at 18.95 minutes.
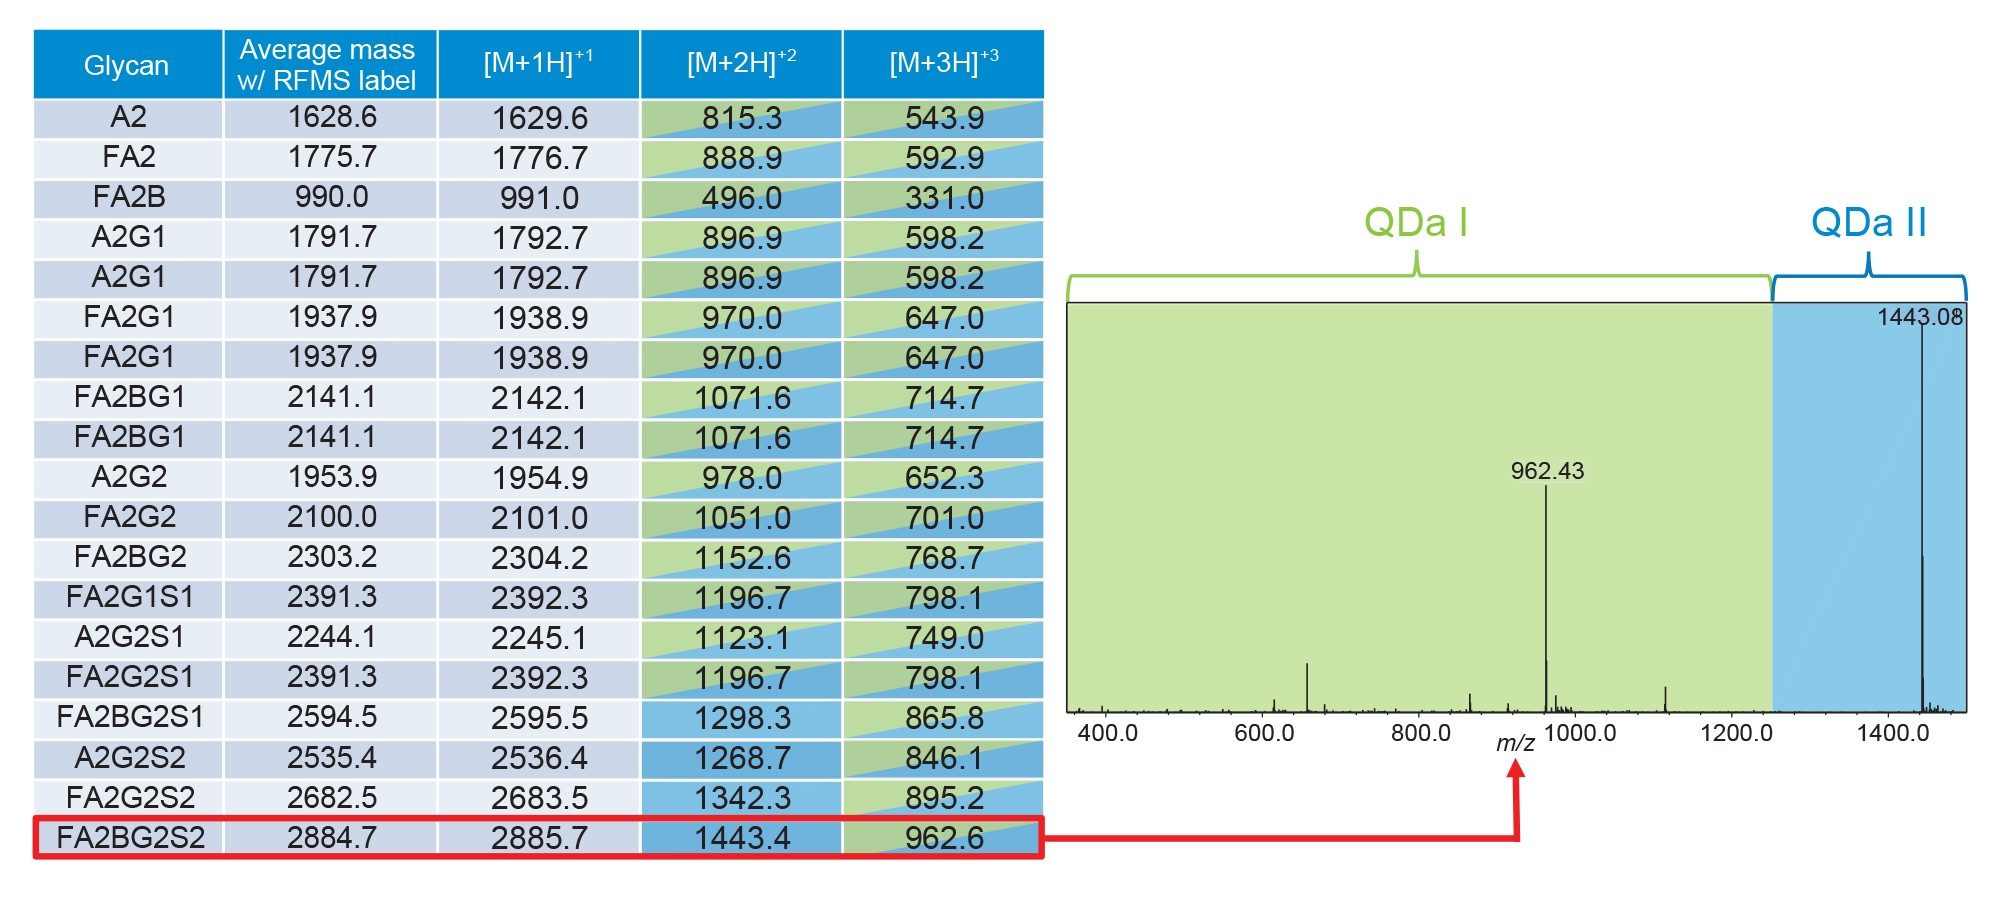
Manufacturing labs prioritize simplicity and efficiency to streamline processes and ensure consistency in analytics. In MS analysis, one way to minimize complexity of data is to analyze the analytes of interest using the same ionization state. One of the notable features of the ACQUITY QDa II Mass Detector is an extended mass range that supports the detection of ions up to 1,500 m/z. This extended range compared to its predecessor allows for more opportunities to analyze larger glycans within the same charge state to simplify data interpretation. For example, in Figure 3, the 19 glycans in the RapiFluor-MS Glycan Performance Test Standard require two charge states to analyze all the glycans of interest using the previous generation single quadrupole mass detector. In contrast, the ACQUITY QDa II Mass Detector can analyze all 19 glycans in the [M+2H]+2 charge state. This improvement is particularly evident in glycans that exhibit ions above 1,250 m/z, resulting in an improved MS response.
Quality Attribute Monitoring
Glycosylation profiles require stringent manufacturing control strategies and monitoring systems to ensure consistency throughout the manufacturing process. As mentioned in the introduction, glycosylation can be influenced by many factors during manufacturing which consequently causes variability in product quality. One of the critical glycan species that necessitates monitoring are high mannose glycans. High mannose glycans, specifically mannose-5 (Man-5), have a significant impact on the pharmacokinetics and efficacy of mAbs due to the rapid clearance from the blood stream by mannose receptors in the liver.4,5 Because Man-5 glycans are generally in low abundance in mAb drug products, MS detectors are utilized to provide high sensitivity and specificity to accurately detect and quantitate these glycans in glycosylation workflows.
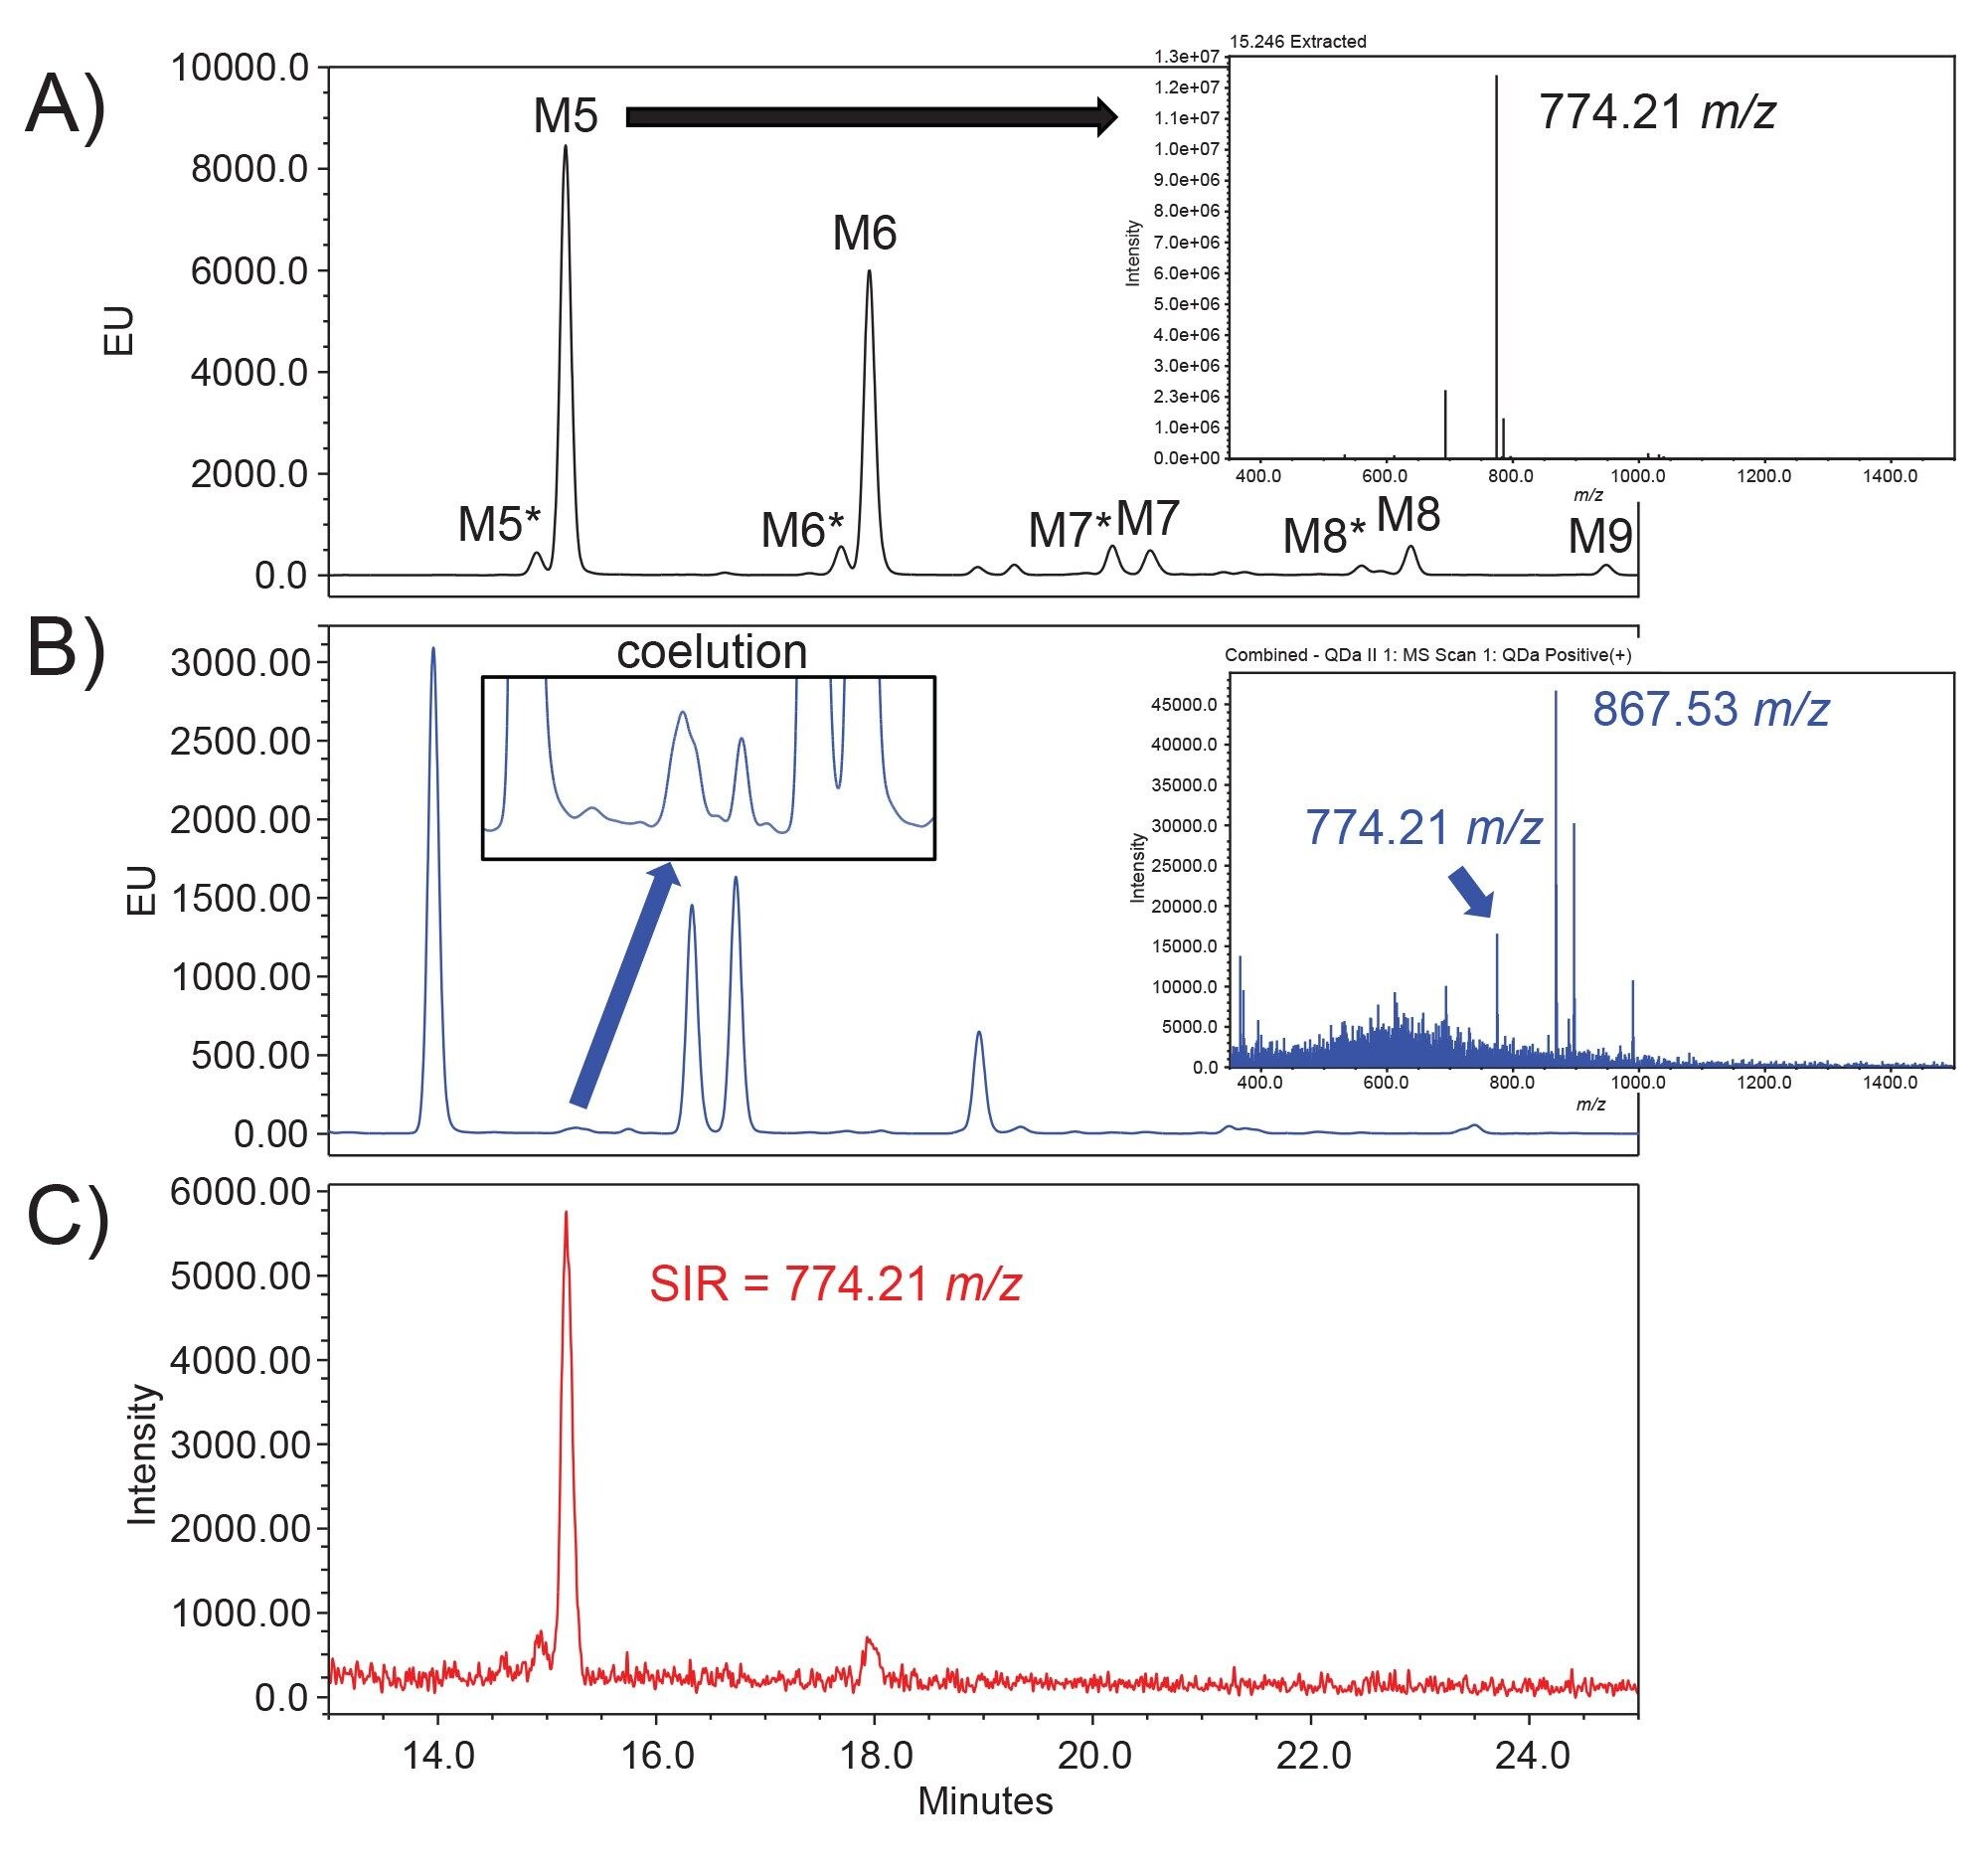
To demonstrate the sensitivity and specificity of the ACQUITY QDa II Mass Detector, Man-5 glycans were analyzed in a representative mAb sample. However, prior to this analysis, a RapiFluor-MS High Mannose Test Standard was injected to determine the retention time and m/z of Man-5 glycans in the instrument configuration. As illustrated in the black chromatogram in Figure 4, the retention time of the Man-5 glycan is ~15.2 minutes with a 774.2 m/z. For the representative mAb sample, an Intact mAb Mass Check Standard was injected, as shown in the blue chromatogram. In the FLR data, there is a small peak present at ~15.2 minutes and when further analyzed by mass spectra, revealed a dominant ion with an m/z of 867.53. This indicates that there is coelution of the Man-5 glycans with another unknown glycan species. To improve the specificity of the mass analysis, selected ion recording (SIR) was used to enhance the detection of specific ions. In this mode, the ACQUITY QDa II Mass Detector will only record the ions of interest and significantly reduce the background noise that can obscure the impurities of interest not visible in the TIC. As shown in the red chromatogram, the SIR at 774.21 m/z showed a low intensity peak at ~15.2 minutes, indicating the presence of Man-5 glycans in the mAb sample. With the enhanced specificity of the ACQUITY QDa II Mass Detector, the Man-5 glycan species could be distinguished from coeluting glycans that would otherwise remain undetected in FLR analysis.
Conclusion
The ACQUITY QDa II Mass Detector significantly enhances the analytical capabilities of QC labs, showing robust, reliable, and efficient results for routine glycan analysis for mAbs. With full integration with Empower 3 Software control, regulated labs can take advantage of mass spectra analysis while maintaining compliance to regulatory standards. The extended mass range that supports detection of ions up to 1,500 m/z allows for improved sensitivity of larger glycans and simplifies data interpretation of glycans in the same charge state. The ACQUITY QDa II Mass Detector also offers enhanced specificity compared to FLR detection and enables accurate detection of low-abundant critical glycan species, such as Man-5 glycans. In conclusion, the ACQUITY QDa II Mass Detector sets a new standard in glycan analysis by delivering advanced capabilities for impurity detection and mass confirmation, ensuring reliable and consistent results to meet regulatory demands and product quality.
References
- Luo S, Zhang B. Benchmark Glycan Profile of Therapeutic Monoclonal Antibodies Produced by Mammalian Cell Expression Systems. Pharmaceutical Research. 2024, 41:29–37.
- Lauber MA, Koza SM, Turner JE, Iraneta PC, Fountain KJ. Amide-Bonded BEH HILIC Columns for High Resolution, HPLC-Compatible Separations of N-Glycans. Waters Application Note. Dec 2013. 720004857.
- Birdsall RE, Kellett J, Zhang X, Yu YQ. Increasing Consistency Across Biopharmaceutical Labs with the ACQUITY Premier LC Platform. Waters Application Note. Nov 2021. 720007415.
- Goetze AM, Liu YD, Zhang Z, Shah B, Lee E, Bondarenko PV, Flynn GC. High-mannose glycans on the Fc region of therapeutic IgG antibodies increase serum clearance in humans. Glycobiology. Jul 2011, 21(7):949–59.
- Yu M, Brown D, Reed C, Chung S, Lutman J, Stefanich E, Wong A, Stephan JP, Bayer R. Production, characterization, and pharmacokinetic properties of antibodies with N-linked mannose-5 glycans. mAbs. Jul-Aug 2012, 4(4):475–87.
720008631, December 2024