• Note d'application

Improving Peptide Mapping Productivity with UPLC-MSE and BiopharmaLynx: Comprehensive Protein Characterization without Time-Consuming Chromatographic Method Optimization

Improving Peptide Mapping Productivity with UPLC-MSE and BiopharmaLynx: Comprehensive Protein Characterization without Time-Consuming Chromatographic Method Optimization

  • Hongwei Xie
  • StJohn Skilton
  • Scott J. Berger
  • Martin Gilar
  • Waters Corporation

Abstract

In this application note, we show how BiopharmaLynx quickly automates assignment of peptide sequence information from MSE fragmentation data, even for cases of coeluting peptides. The ability of the UPLC-MSE approach to reduce mAb peptide mapping run times from 180 to 60 minutes without affecting peptide sequence coverage and fragment pattern interpretation is demonstrated. The application of UPLC-MSE methodology to peptide mapping enables universal and unbiased data acquisition that provides for comprehensive characterization of a therapeutic antibody. 

Introduction

The fundamental ethic of the well-characterized biopharmaceutical is that drug developers can define and monitor the critical attributes of a biotherapeutic, and that they can produce a process that maintains control over these characteristics. The faster you can define the underlying structural variation in a product, the faster you can proceed through product commercialization and implement process improvements.

Peptide mapping by LC-MS is an essential technique used by the biopharmaceutical industry to examine the primary structure of a protein. Mass spectrometry provides an extra dimension of separation over traditional UV detection methods. This removes the absolute reliance on effective chromatographic resolution to enable comprehensive qualitative and quantitative peptide map analysis. In an LC-MS peptide map, peptides can partially or fully coelute without impairing the ability to detect, assign, and quantify them. Thus, an MS detection workflow enables product characterization to proceed independently of the time-consuming efforts to develop the more resolving LC-UV peptide maps that are required for later development and quality control activities. The challenge with implementing LC-MS peptide mapping has been that data processing and interpretation were productivity-limiting.

The introduction of data-independent acquisition approaches such as UPLC-MSE has enabled shorter peptide mapping runs, and simultaneously increased the amount and quality of information available for biotherapeutic characterization. MSE is a technique that acquires accurate peptide and fragment mass data for all peptides within a sample within a single run. The MSE fragmentation data can be used to validate the accurate mass assignment of a peptide and localize assigned modifications within the peptide sequence. Fragmentation information is collected in parallel for all peptide ions, avoiding the bias and analytical irreproducibility that occurs with data-dependent approaches that require serial pre-selection of peptide precursor ions. LC-MSE datasets are acquired with two alternating MS functions: one for MS of peptide precursors acquired at low collision cell energy, and one (MSE) for collecting peptide fragmentation data at elevated collision cell energies.

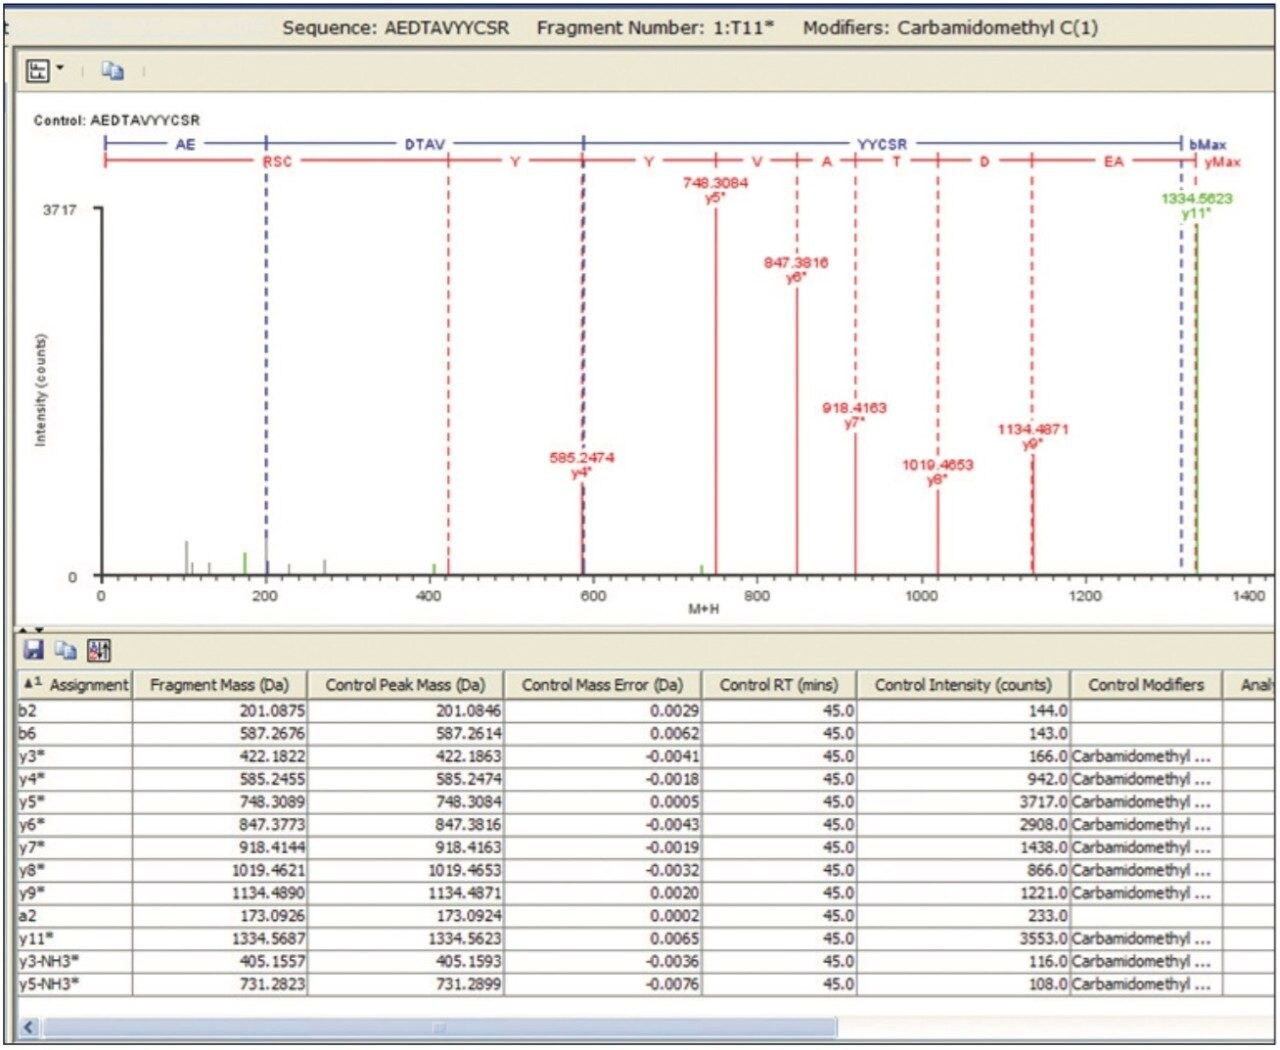
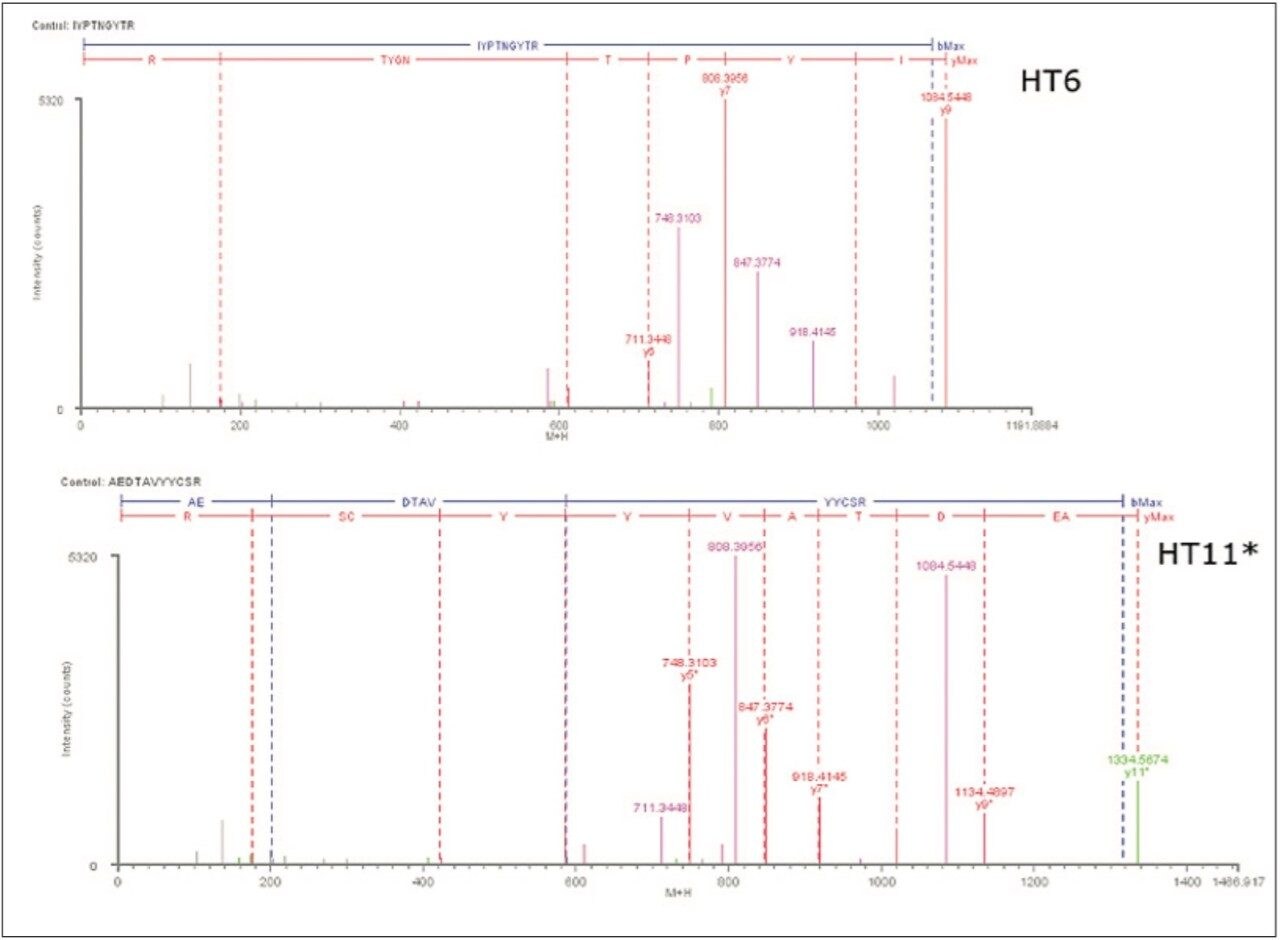
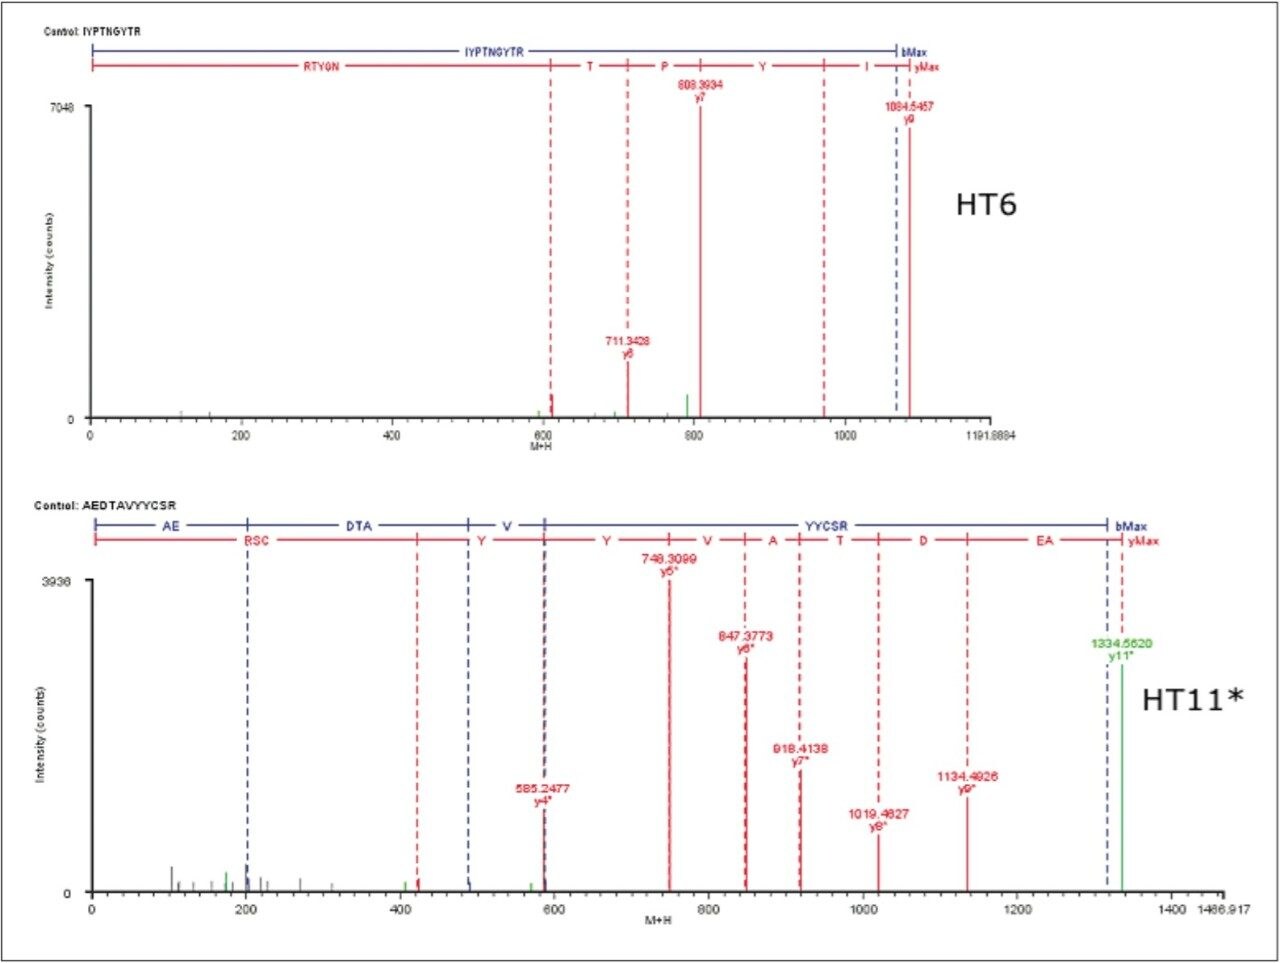
Several publications1-5 have detailed the power of processing such datasets using the chromatographic profiles of detected ions to determine isotopic cluster, charge state, and precursor ion/fragment ion relationships in MSE datasets. Using this methodology, the resulting peptide information included retention time, accurate mass, intensity, and fragmentation profiles for all detected peptides within a peptide map.

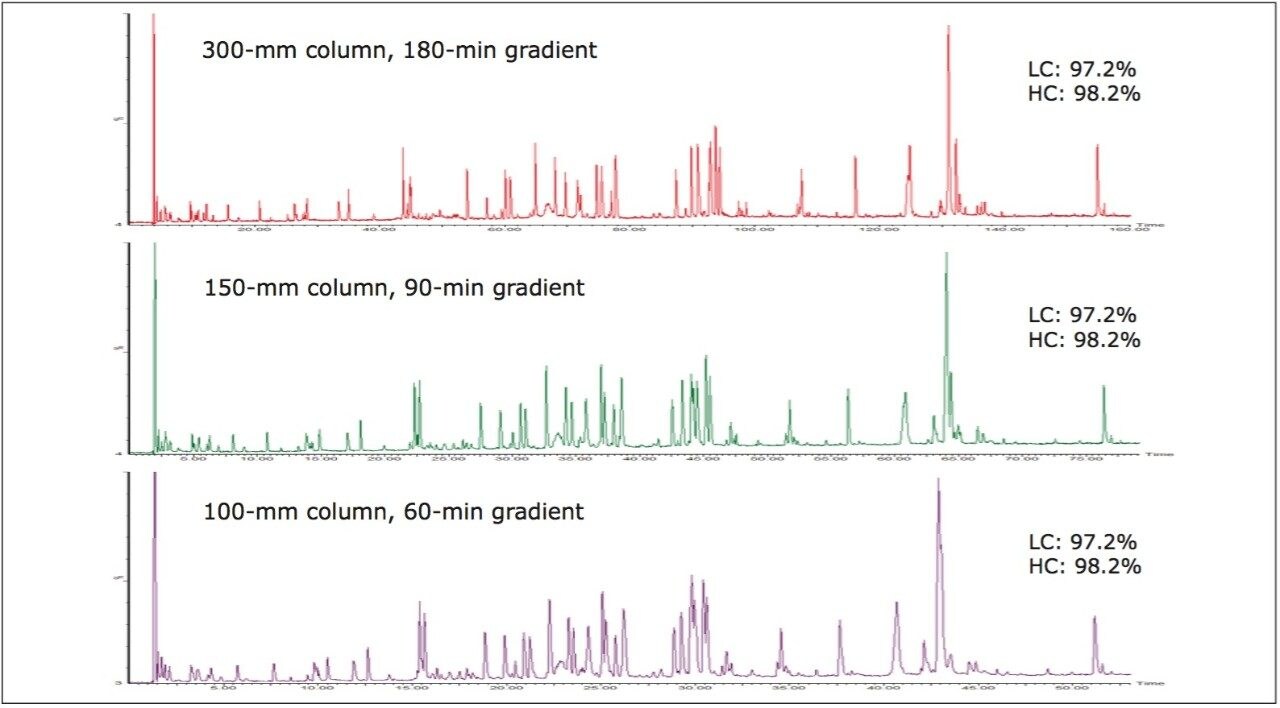
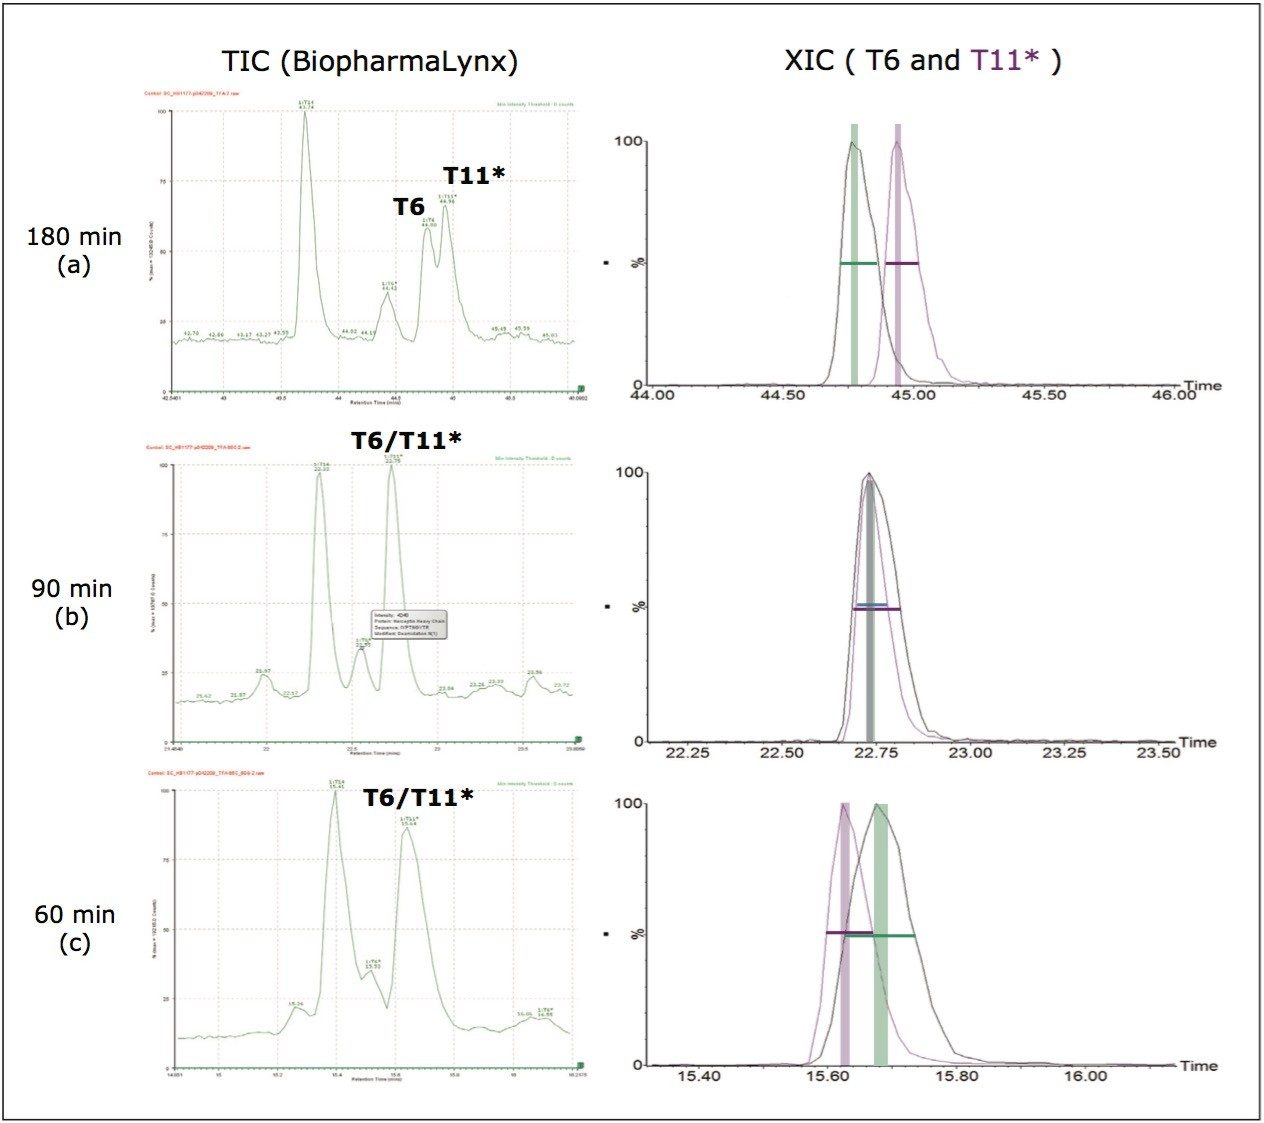
In this application note, we show how BiopharmaLynx software quickly automates assignment of peptide sequence information from MSE fragmentation data, even for cases of coeluting peptides. The ability of the LC-MSE approach to reduce mAb peptide mapping run times from 180 min (300-mm column) to 60 minutes (100-mm column) without affecting peptide sequence coverage and fragment pattern interpretation is demonstrated.

Automating data analysis enables analysts to realize the increased productivity gained from using shorter LC-MS methods for product characterization studies. Furthermore, the ability of the underlying MSE methodology to deal with high-complexity data enables the production of generic LC-MS screening methods for a wide array of biotherapeutic products. Productivity gains on the order of weeks to months can be expected compared to time spent optimizing and analyzing LC-UV peptide maps.

Experimental

Antibody Digest

A commercially available monoclonal antibody (mAb) of approximately 148 kDa was digested with trypsin using a protocol described elsewhere.

Chromatographic System

The Waters ACQUITY UPLC System was configured with a standard peptide mapping mixer (425 μL) and a BEH300 C18 1.7-μm Peptide Separation Technology (PST) Column (2.1 x 100 mm, 2.1 x 150 mm, or two coupled 2.1 x 150 mm columns).

Mass Spectrometer

The Waters SYNAPT MS System was operated in the ESI+ mode with V ion geometry. Conditions: Source temp.: 100 °C, cone voltage:   37 V. MSE acquisition: two alternating MS data functions were collected (1 sec total cycle time) with the collision cell at low energy (4 V) for acquisition of peptide mass spectra, and at elevated energy (linear ramp 20 to 40 V) for the collection of peptide fragmentation spectra. LockSpray: 100 fmol/μL GFP in 50:50 acetonitrile/water containing 0.1% formic acid, sampled once every min.

Informatics

BiopharmaLynx 1.2 Application Manager for MassLynx Software.

Methodology

Triplicate analysis of an mAb tryptic digest was conducted using UPLC configurations with column lengths of 100, 150, and 300 mm. A linear gradient (1 to 40% acetonitrile in 0.1% TFA) was scaled with column length for run times of 60, 90, and 180 min, respectively.

Results and Discussion

Peptide maps are inherently complex. An mAb tryptic digest contains fully-digested peptides, the products of over- and underdigestion, modified peptides, and non-product impurities. The combinations of these factors yield hundreds of unique peptide species for analysis. Coupling high-quality UPLC separations with mass spectrometry offers the ability to detect and monitor these species, even if they possess overlapping chromatographic profiles. Figure 1 shows that peptide coverage of 97%+ of the mAb sequence can be maintained, even when peptide map gradient length is reduced by two-thirds from 180 to 60 min. In this example, column length was scaled in concert with gradient length, maintaining a consistent gradient slope over all three conditions, which preserves the overall peptide separation selectivity across the three methods. Even though separation capacity is reduced using the shorter column methods, and many peaks now partially or fully coelute, protein sequence coverage was not sacrificed.

Example peptides from this antibody peptide map are the Heavy Chain tryptic peptides HT11* (modified with an alkylated Cys) and HT6, which are partially resolved chromatographically (10 sec difference at peak apex) using the most resolving separation configuration (300 mm column length and 180-minute run time). The partially coeluting peptides (Figure 2a) were observed to fully coelute using the 90 min gradient (Figure 2b), and slightly resolve using the 60 min gradient (Figure 2c). Interestingly, the selectivity of the separation was sufficiently altered by the changes in column volume and gradient length to reverse the elution order of the two peptides.

BiopharmaLynx 1.2 was able to correctly assign both peptides and apply MSE fragmentation data for sequence validation when partial and complete peptide coelution were observed. During processing of the MS and MSE data (see reference 5 for greater detail), the chromatographic profiles of all detected ions were used to establish relationships within isotopic clusters, between charge states, and ascertain the correspondence of precursor ions in the MS scan with their cognate fragments in the MSE scan.

The most basic of these relationships is that MSE fragments will exhibit an apex retention time within one-tenth of a chromatographic peak width of the MS precursor ion from which they were generated. Thus, fragments from partially coeluting peptides with peak apex retention times outside this limited time window have no contribution to the fragment list used to validate a peptide assignment. This is visually displayed (Figure 2) as green (T6) and purple (T11*) vertical bars representing the RT range where the chromatographic apex of associated MSE fragments would be detected. For the 180 and 60 min maps, these time regions are clearly distinguished, and no overlapping fragmentation data should be observed. The 90-min map represents a case of near absolute coelution, and it would be expected that these peptides would share a subset of MSE fragment ions.

The MSE data for the MS and MSE traces is automatically processed in BiopharmaLynx 1.2 so that the user is presented with an appropriate time-aligned fragmentation spectra for each peptide (Figure 3). Using this methodology, the validation of peptide sequence in peptide maps becomes automated, simpler, and faster. It is also important to note that the experiment to acquire this confirmatory fragmentation data is no more complex than acquiring the MS data alone. All that was required was the addition of the second MSE acquisition data channel within the MS acquisition method.

Figure 3. BiopharmaLynx 1.2 fragment ion display for the T11* peptide (T11 peptide with a modification) of the Heavy Chain from the 180-min map.

The fragmentation spectrum of HT11* from the 180-min separation depicts a series of y-ions and b-ions that sequence through the site of Cys modification, confirming both the peptide and modification site. As expected, no fragment overlap is observed with the partially coeluting T6 peptide, and all major ions assign to the T11* sequence.

In the 90-min mapping run, the T6 peptide was observed to fully coelute with the HT11* peptide. The use of accurate mass fragmentation data permits BiopharmaLynx 1.2 to automatically and unambiguously assign the correct fragments to each coeluting peptide (Figure 4). The MSE fragmentation data was clearly able to validate the map assignments for both peptides, and with the same level of sequence detail for HT11* as was seen from the longer run. Ions corresponding to the assignments for the indicated peptide are colored in red (y-ions), blue (b-ions), and green (neutral loss ion), while ions assigned to the coeluting peptide are clearly distinguished as pink colored peaks. In both instances, the user can use the pattern of major fragment ions to confirm that the accurate mass assignment of each peptide is correct.

Figure 4. BiopharmaLynx 1.2 fragment ion display of peptide sequence of HT6 and HT11* from the 90-min map. The colors of the assigned peaks indicate that a peak is assigned to the indicated sequence (red y-ion, blue b-ion, green neutral loss ion), or assigned to a coeluting peptide (pink). Grey ions represent peaks that were not assigned.

Even in shorter peptide maps, perfect coelution of peptides is rather rare. The data for the two peptides from a shorter 60-min map show that two peptide peaks are resolved by a ~10% valley (XIC plots in Figure 2c), and that no overlap of MSE fragmentation data is observed (Figure 5.)

Figure 5. Panel (a) BiopharmaLynx 1.2 fragment ion display of peptide sequence of HT6 and HT11* from the 60-min map. The colors of the assigned peaks indicate that a peak is assigned to the indicated sequence (red y-ion, blue b-ion, green neutral loss ion), or assigned to a coeluting peptide (pink). Grey ions represent peaks that were not assigned.

Conclusion

  • The application of UPLC-MSE methodology to peptide mapping enables universal and unbiased data acquisition that provides for comprehensive characterization of a therapeutic antibody.
  • The tolerance of this approach for imperfect chromatographic resolution of components enables users to obtain qualitative and quantitative mapping results without significant investments in chromatographic method development.
  • BiopharmaLynx 1.2 software automates the processing of MSE analyses, and presents the user with information that allows for better decisions to be made faster.
  • The combination of these technologies permits scientists to acquire peptide mapping data using shorter analysis times without sacrificing protein coverage or peptide identification quality.

References

  1. Silva JC, Denny, R, Dorschel CA, Gorenstein M, Kass IJ, Li GZ, McKenna T, Nold MJ, Richardson K, Young P, Geromanos S. Quantitative Proteomic Analysis by Accurate Mass Retention Time Pairs. Anal. Chem. 2005; 77 (7): 2187-200.
  2. Silva JC, Gorenstein MV, Li GZ, Vissers JP, Geromanos SJ. Simultaneous Qualitative and Quantitative Analysis of the Escherichia coli: Proteome: A Sweet Tale. Mol. Cell. Proteomics. 2006; 5: 589-607.
  3. Chakraborty, AB, Berger, SJ, Gebler, JC. Use of an integrated MS-multiplexed MS/MS data acquisition strategy for high-coverage peptide mapping studies. Rapid Commun. Mass Spectrom. 2007; 21 (5); 730-44.
  4. Xie H, Gilar M, Gebler JC. Characterization of protein impurities and site-specific modifications using peptide mapping with liquid chromatography and data independent acquisition mass spectrometry. Anal. Chem. 2009; 81 (14): 5699-708.
  5. Geromanos SJ, Vissers JP, Silva JC, Dorschel CA, Li GZ, Gorenstein MV, Bateman R H, Langridge JI. The detection, correlation, and comparison of peptide precursor and product ions from data independent LC-MS with data dependant LC-MS/MS. Proteomics. 2009; 9 (6): 1683-95.
  6. Xie HW, Gilar M. Improving LC Peak Shape of Proline-Rich Peptides within an Antibody Peptide Map. Waters. 2009; 720003063en.

Related documents

Peer-reviewed publication summary featuring MSE applications. Waters. 2009: 720002330en.

Waters Biopharmaceutical Applications Notebook. Waters. 2009; 720002487en.

High Sequence Coverage Peptide Mapping of a Monoclonal Antibody with UPLC-MSE. Waters. 2009; 720002821en.

Identification and Quantification of Protein Modifications by Peptide Mapping with UPLC-MSE. Waters. 2009; 720003009en.

An Automated Data Analysis of Therapeutic Interferon Protein using BiopharmaLynx Application Manager. Waters. 2009; 720002950en.

Monitoring Deamidation Progression in an Antibody Tryptic Digest using UPLC-MSE with BiopharmaLynx 1.2 and Xevo QTof MS System. Waters. 2009; 720003168en.

Waters Biopharmaceutical Solutions, www.waters.com/biopharm.

Acknowledgement

The authors wish to thank Aviva De Beer-Heidt for her insightful contributions to this application note.

720003227, September 2009

Haut de la page Haut de la page