For forensic toxicology use only.
This application note demonstrates the sensitivity and selectivity of the Forensic Toxicology Application Solution with UNIFI in providing comprehensive screening of beta-blockers at low levels of concentration in human urine and achieving the MRPL with minimal sample preparation.
Propranolol was the first, clinically successful beta-blocker. Synthesized by JW Black in the early 1960s,1 it revolutionized the management of angina pectoris and spawned the development of additional beta-blockers. Beta-blockers competitively block the action of beta-adrenergic agonists at the beta-receptors in the cells of heart muscle and other tissues of the sympathetic nervous system. They are legally prescribed and used primarily for the management of hypertension, angina, and cardiac arrhythmias. These substances however, can be abused by athletes who want to decrease their heart rate, lower their blood pressure, or improve their fine motor skills. Consequently, the World Anti-Doping Agency (WADA) includes beta-blockers in its 2014 Prohibited List2 (Category P2), limiting the prohibition to sports like archery, golf, and shooting.
Recent advances in liquid chromatography and mass spectrometry can help determine the presence of beta-blockers in urine.
A mixed, methanolic standard containing the following beta-blockers was prepared at a concentration of 50 µg/mL: acebutolol, alprenolol, atenolol, bunolol, bisoprolol, carazolol, celiprolol, levobunolol, metipranolol, metoprolol, nadolol, nebivolol, oxprenolol, pindolol, sotalol, and timolol. Blank human urine was spiked with the mixed standard, resulting in final concentrations of 50, 100*, 250, and 500 ng/mL. A simple five-fold dilution with mobile phase A was used to prepare each spiked urine sample for injection.
* Minimum required performance level (MRPL) for a WADA-accredited laboratory.
LC system: |
ACQUITY UPLC I-Class (FTN) |
Run time: |
15 min |
Column: |
ACQUITY UPLC HSS C18 2.1 x 150 mm, 1.8 μm |
Vials: |
Waters Maximum Recovery Vials |
Column temp.: |
50 °C |
Sample temp.: |
10 °C |
Injection vol.: |
10 μL |
Flow rate: |
0.4 mL/min |
Mobile phase A: |
5 mM aqueous ammonium formate, adjusted to pH 3.0 |
Mobile phase B: |
Acetonitrile with 0.1% formic acid |
Gradient: |
87% A to 50% A over 10 min, reduce to 5% A and hold for 1.5 min before returning to 87% A |
MSE conditions |
|
---|---|
MS system: |
Xevo G2-S QTof |
Ionization mode: |
ESI+ |
Source temp.: |
150 °C |
Desolvation temp.: |
400 °C |
Desolvation gas: |
800 L/h |
Reference mass: |
Leucine enkephalin [M+H]+ = 556.2766 |
Acquisition range: |
m/z 50–1000 |
Scan time: |
0.1 s |
Capillary voltage: |
0.8 kV |
Cone voltage: |
25 V |
Collision energy: |
Function 1: 6 eV Function 2: ramped 10 to 40 eV |
The diluted spiked urine samples were injected and data was acquired using the standard MSE -based toxicology screen.3,4 Data were subsequently processed using the UNIFI Forensic Toxicology Library comprising more than 1,000 toxicologically-relevant substances. Qualitative identification was achieved through a combination of mass accuracy, retention time (RT) and the presence/absence of expected fragment ions. In the same processing step, UNIFI Scientific Information System also generates and displays any quantitative data.
UNIFI uses a simple workflow approach to guide the user through the sample results; data is automatically filtered and presented to the user according to the degree of confidence in the identification, thereby decreasing the requirement for analyst’s review. Workflows are fully customizable - an example of the criteria that may be used is shown in Figure 1.
All of the beta-blockers were successfully identified at the lowest concentration investigated in this study (50 ng/mL) and met the user-defined criteria for a “Positive” drug finding. Figures 1 through 4 provide an illustrative example of some of the data that is automatically-displayed or available to the user on a “single-click” from the Review pane.
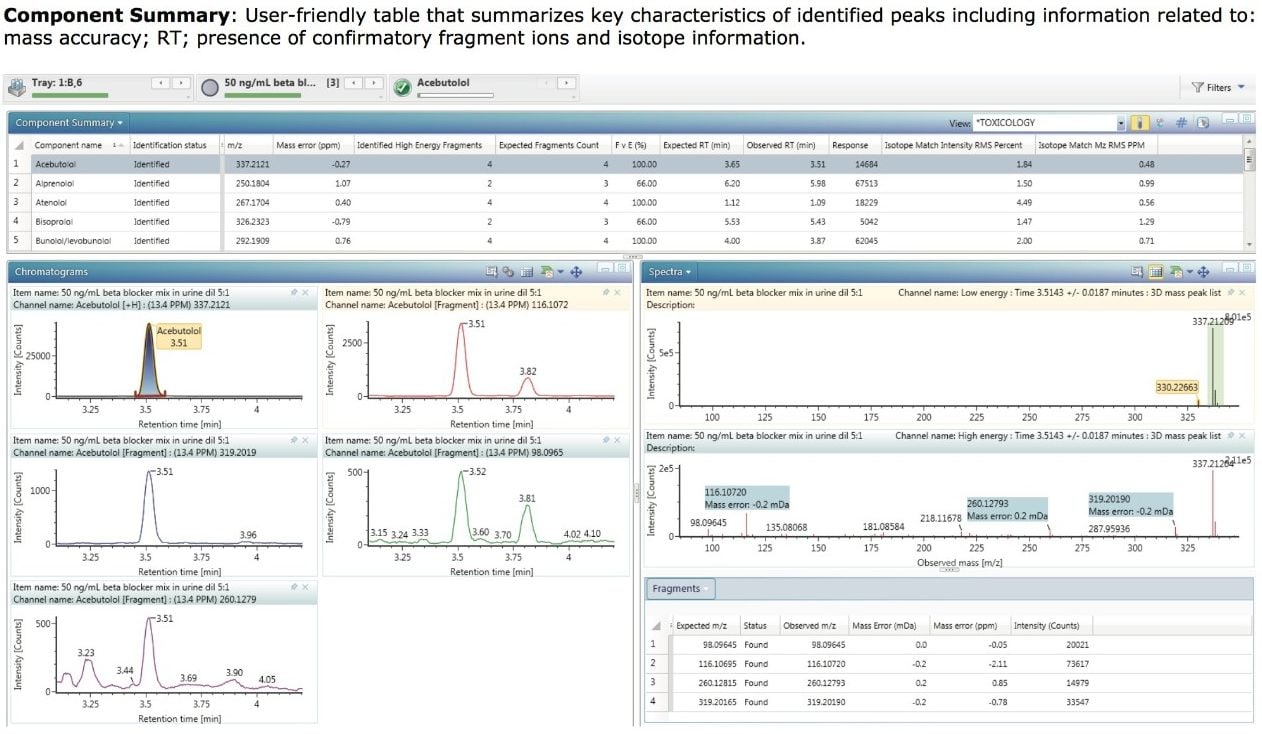
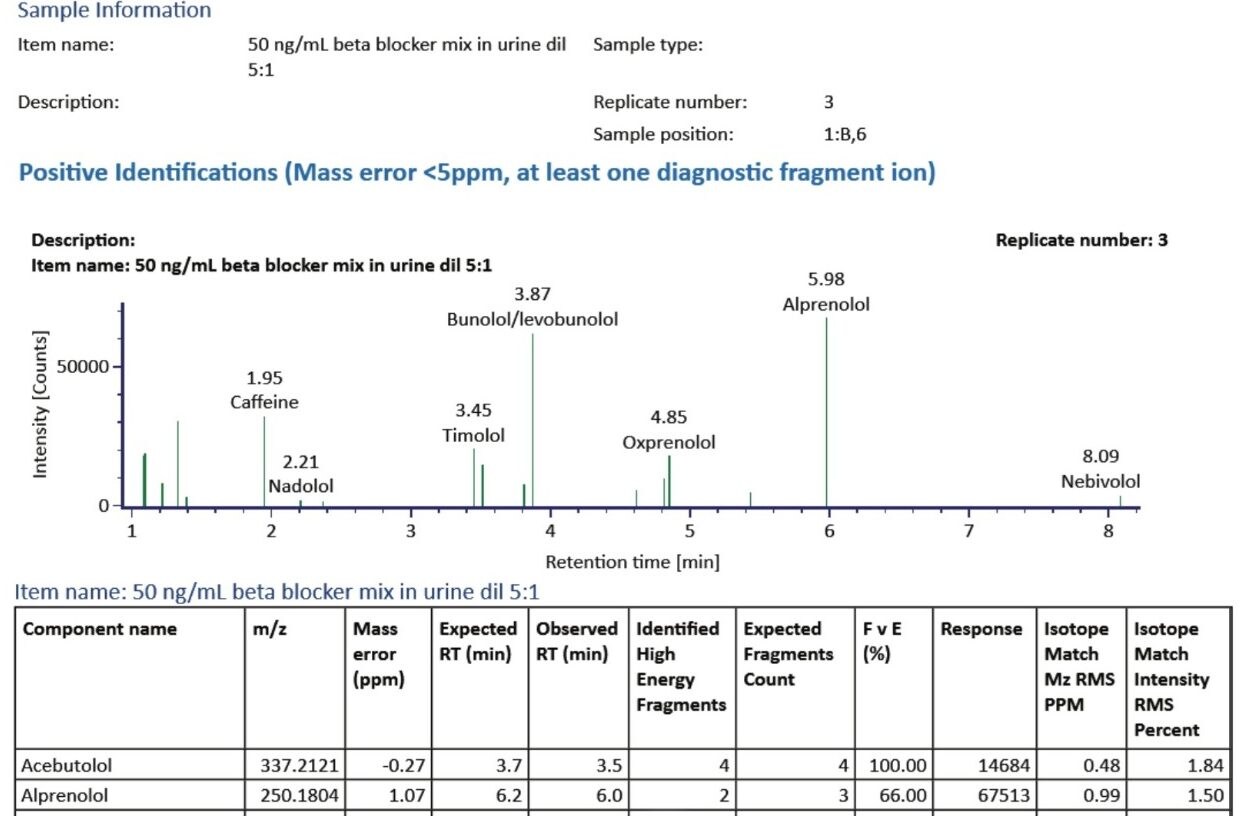
In contrast to the plot view, which provides a very simple graphical display of detected components, full details of each identification can be viewed by selection of the Component Summary (Figure 2). This is a user-friendly table that summarizes key characteristics of identified peaks including mass accuracy, confirmatory fragment ions and isotope information (in this example, only those components that matched the “Positive” criteria are shown).
The extracted mass chromatograms for the precursor ion and all of the high collision energy fragment ions for a particular component can also be displayed if required, as shown in the Chromatograms window (lower left of Figure 2).
Further information is available by viewing the low and high energy spectra for a component as shown in the Spectra window. This view highlights the precursor ion in the top trace and the found fragment ions in the bottom trace. UNIFI provides improved three-dimensional (3D) chromatographic peak detection with its integrated ApexTrack algorithm, which facilitates the generation of cleaner mass spectra, enabling better library matching of fragment ions.
In addition to viewing the spectra, it is often useful to display a summary of the confirmatory fragment ion data. Figure 2 also shows the Fragments table which contains details for the expected fragments for acebutolol, the mass error associated with each detected fragment, and the detected fragment intensity.
The isotopic pattern obtained for each component can also be an aid in identification. Figure 3 shows the mass spectrum of the low collision energy trace for sotalol, a sulphur-containing compound. The two most abundant stable isotopes of sulphur are 32S and 34S which are present at a ratio of 95:4. An algorithm within UNIFI can be used to indicate the degree of matching between the theoretical and observed isotopic patterns for a component, with a low score indicating a good match. This “Isotope Match Intensity RMS Percent” column can be added to the Component Summary table as an extra point of confirmation. A further UNIFI algorithm is used to evaluate the level of agreement between the expected m/z and found m/z of each isotopic peak and these results are shown in the Isotope Match Mz RMS PPM, again with a low score indicating a good match as shown in the rightmost columns of the Component Summary window of Figure 2.
In particular, Figure 4 shows, for each beta-blocker, a semi-quantitative calibration plot that draws data from three replicate injections made at each concentration (50, 100, 250, and 500 ng/mL). The calibrations are calculated from the response value for each analyte, a value that originates with the 3D integration of the monoisotopic precursor-ion peak. Because no internal standards were used in this study, this semi-quantitative data demonstrates only the typical dynamic range of the instrument.
Figure 5 illustrates a fully customizable report generated by the UNIFI Software from the results that provided the key details of the identifications made for this sample. A section from this report is shown in Figure 5 and provides a Component Plot as well as a Component Summary for each identification category.
This application note demonstrates the sensitivity and selectivity of the Forensic Toxicology Application Solution with UNIFI in providing comprehensive screening of beta-blockers at low levels of concentration in human urine and achieving the MRPL with minimal sample preparation. Despite the complex nature of accurate mass MSE data, the UNIFI Software enables user-friendly, comprehensive data analysis, interpretation, and reporting. The excellent linear dynamic range of this system is demonstrated in four, simple, automatically generated calibration plots.
720005188, September 2014