
Extending PFAS Analytical Workflows with APGC-MS/MS Analysis: Analysis of Environmental and Food Packaging Samples
Kari Organtini, Ken Rosnack, Frank Dorman, Kevin Stup
Waters Corporation, United States
Published on October 13, 2026

Abstract
An atmospheric pressure gas chromatography tandem quadrupole mass spectrometry (APGC-MS/MS) method was evaluated for the analysis of 35 GC-amenable per- and polyfluoroalkyl substances (PFAS) in environmental and food packaging matrices. The method successfully identified fluorotelomer alcohols (FTOHs) in wastewater and soil samples, while comparison with LC-MS/MS data provided evidence of precursor transformation to perfluoroalkyl carboxylic acids (PFCAs) during wastewater treatment. Analysis of food packaging materials detected none of the targeted PFAS, and post-spike experiments demonstrated accurate quantification at concentrations relevant to current and emerging regulatory limits. Overall, the method proved to be a sensitive and complementary tool to LC-MS/MS for PFAS characterization, enabling more comprehensive assessment of samples.
Benefits
- An APGC-MS/MS method for the analysis of 35 GC-amenable PFAS allowing for characterization of PFAS samples beyond the suite of commonly targeted LC-MS/MS compounds, enabling a more complete assessment of PFAS burden
- Sensitive and robust analysis to detect GC-amenable PFAS in complex sample matrices, supporting reliable data generation across diverse sample types
- Provides complementary information to LC-MS/MS workflows by identifying PFAS precursor compounds and transformation pathways, helping laboratories better understand contamination sources, environmental fate, and treatment outcomes
- Enables confident monitoring of food contact materials at concentrations well below emerging European regulatory limits, supporting compliance testing and regulatory preparedness
- Expands laboratory capabilities beyond routine targeted PFAS analysis, allowing customers to deliver comprehensive investigations, differentiate their analytical services, and generate deeper insight into PFAS occurrence in environmental samples
Introduction
While liquid chromatography coupled with mass spectrometry (LC-MS) remains the dominant approach for routine PFAS analysis, it is not well suited for all PFAS classes. A subset of PFAS compounds, particularly volatile and semi-volatile species, exhibit chromatographic and analytical characteristics that favor gas chromatography (GC)-based methods. These include fluorotelomer alcohols (FTOHs), fluorotelomer acrylates (FTAcrs), fluorotelomer methacrylates (FTMACs), fluorotelomer acetates (FTOAcs), and several related precursor compounds. Other PFAS classes, such as sulfonamides and sulfonamidoethanols, can be successfully analyzed using either LC or GC platforms.
Many GC-amenable PFAS are recognized as precursor compounds because they can undergo environmental and biological transformation to form PFCAs and perfluoroalkyl sulfonates (PFSAs), the terminal degradation products that have been the focus of most PFAS monitoring and toxicological studies. In addition to their role in PFAS manufacturing processes, these compounds have historically been incorporated into commercial products, including food contact materials and textile treatments, where they provide oil, stain, and water-resistant properties.
The environmental behavior of these precursor compounds differs from that of many ionic PFAS due to their increased volatility, which enables atmospheric transport and deposition over long distances. As a result, they can contribute to PFAS contamination through pathways that are not fully captured by conventional LC-based analytical approaches. Although toxicological information for many of these compounds remains limited, their potential health impacts and their ability to generate persistent PFCA and PFSA transformation products have increased interest in their measurement and environmental occurrence.
FTOH, FTAcr, FTMAC, PFSA, N-xFOSA, and N-xFOSE compounds are known to have been used as raw materials in the synthesis of surface protectants, such as those used to grease proof paper and paperboard food packaging materials.1 In recent years, global efforts have been made to phase out and ban their use in food contact materials. In 2020, the US Food and Drug Administration (FDA) announced the voluntary removal of 6:2 FTOH for use in food contact materials with complete removal of all packaging containing this compound in 2025.2,3 Furthermore, in 2025, 35 Food Contact Notifications (FCNs) for PFAS compounds that declare the use of a substance safe in food contact materials were revoked by the FDA.4 Concurrently, from August 12, 2026, Regulation (EU) 2025/40 restricted PFAS in food contact packaging enforcing strict limits for individual targeted PFAS, the sum of targeted PFAS, and total PFAS content.5 In accordance with this regulation, a limit of 25 ppb was set for individual targeted PFAS in any food packaging material.
As discussed in a previous application note, atmospheric pressure gas chromatography coupled with tandem quadrupole mass spectrometry (APGC-MS/MS) provides a sensitive approach for the determination of volatile and semi-volatile PFAS.6 The development of the method and the overall method performance are discussed there. The work presented here extends that methodology to the analysis of authentic environmental and food packaging samples, demonstrating the value of GC-MS/MS techniques for more comprehensive PFAS characterization and improved understanding of PFAS sources and transformation pathways.
Experimental
Sample Preparation
Native PFAS standards were purchased from Wellington Laboratories and AccuStandard. Isotope labeled internal standards were purchased from Wellington Laboratories.
Environmental samples were previously extracted using EPA Method 1633A7 and analyzed using LC-MS/MS.8,9 Full details of the sample preparation can be found in the referenced application notes and followed the EPA 1633A protocol. Final sample extracts were estimated to be in a solution of 94% methanol, 4% water, 1% ammonium hydroxide, and 0.6% acetic acid. Calibration standards were prepared from 0.01 to 50 ng/mL for all compounds, except the sulfonamides at 0.10 to 500 ng/mL, in the same solvent composition.
Food packaging was collected from several locations and was either paper or paperboard material. Examples of packaging tested include a french fry box, paper sandwich wrappers, paper plates, paper coffee cups, and a bakery bag. A 10 x 10 cm portion of each packaging material was cut into small pieces and weighed to determine extracted mass. The sample was placed into a 50 mL centrifuge tube and 20 mL of methanol containing 1% ammonium hydroxide (v/v) was added. The samples were sonicated for 1 hour and an aliquot was removed for analysis.
Proton transfer conditions were established in the APGC source using three vials of water in the source door tray. Under proton transfer conditions, water vapor present in the APGC source facilitates the formation of protonated analyte ions, improving sensitivity for MS/MS detection. Each vial was capped with a small piece of capillary tubing pierced through the vial cap.
Isopropyl alcohol (IPA) and methanol were used as wash A and B, respectively, in the GC autosampler. Both pre and post injection washes were performed. IPA was found to help reduce carryover of the sulfonamide compounds.
Method Conditions
GC Conditions
|
GC system: |
Agilent® 8890 Gas Chromatography System |
|
Autosampler: |
7693A Automatic Liquid Sampler |
|
Column: |
Restek® Rtx-200 30 m x 0.25 mm ID, 0.50 µm Column |
|
Inlet liner: |
Restek Siltek Deactivated Straight with Wool (4.0 x 6.5 x 78.5 mm) |
|
Carrier gas: |
Nitrogen |
|
Flow rate: |
2 mL/min |
|
Injection: |
Pulsed Split (40 psi until 0.6 minutes) |
|
Split ratio: |
10:1 |
|
Injection port temperature: |
240 °C |
|
Injection volume: |
1 µL |
|
Makeup gas: |
Nitrogen at 300 mL/min |
|
Transfer line temperature: |
310 °C |
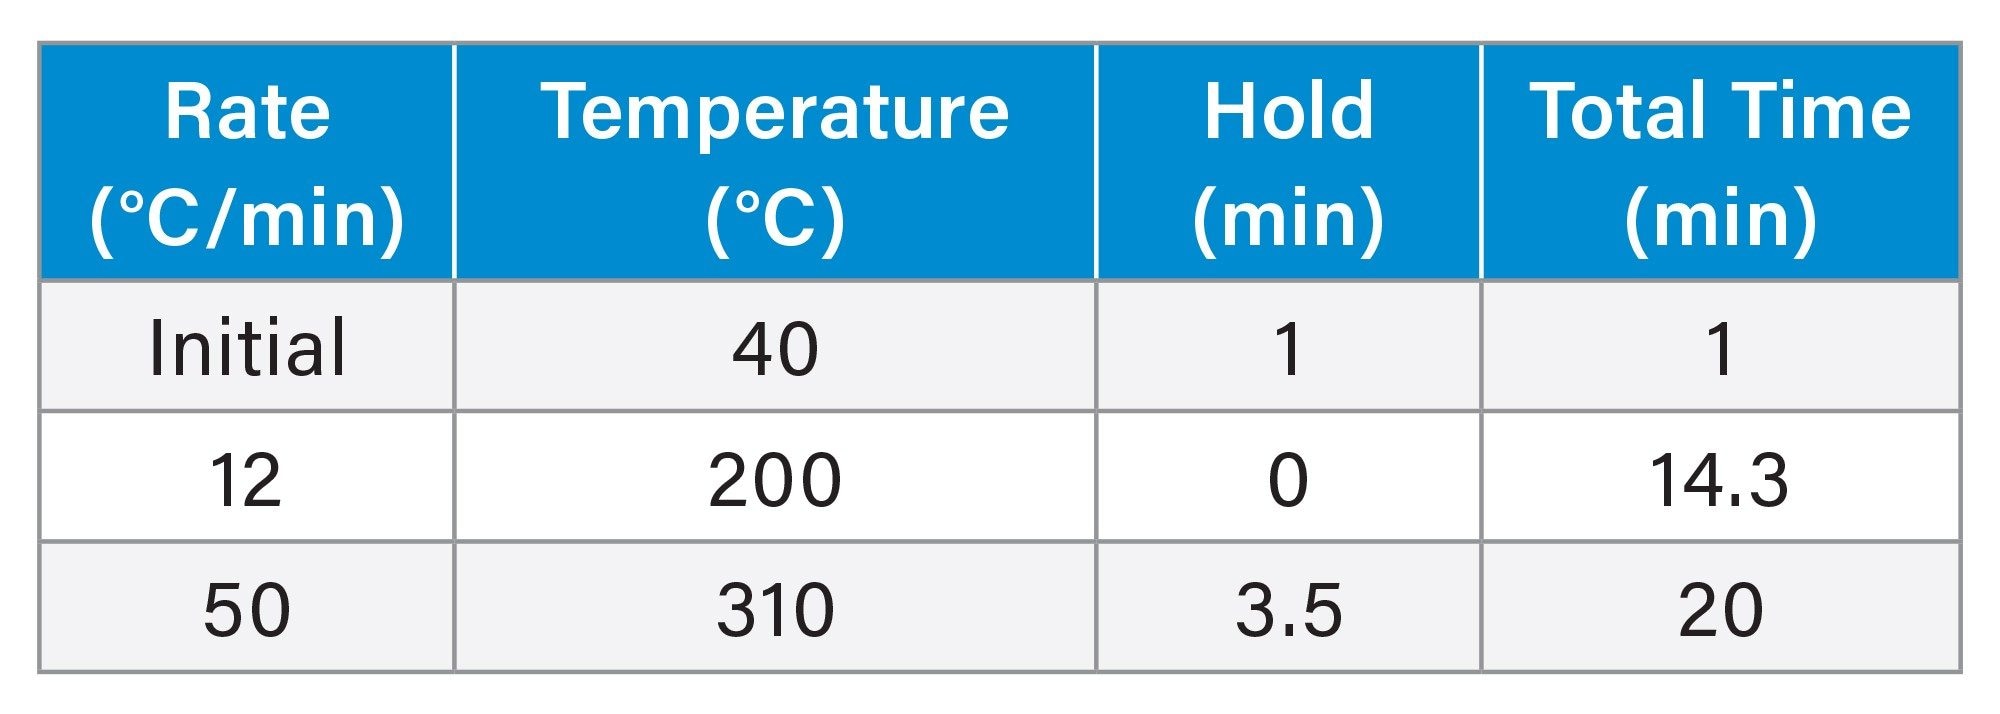
Oven Program
MS Conditions
|
MS system: |
Xevo™ TQ Absolute Mass Spectrometer |
|
Ionization mode: |
API+ |
|
Ionization mechanism: |
Proton transfer (water) |
|
Collision gas: |
Argon |
|
Source temperature: |
150 °C |
|
Corona current: |
1.0 µA |
|
Cone gas flow: |
250 L/hr |
|
Auxiliary gas flow: |
150 L/hr |
|
MRM method: |
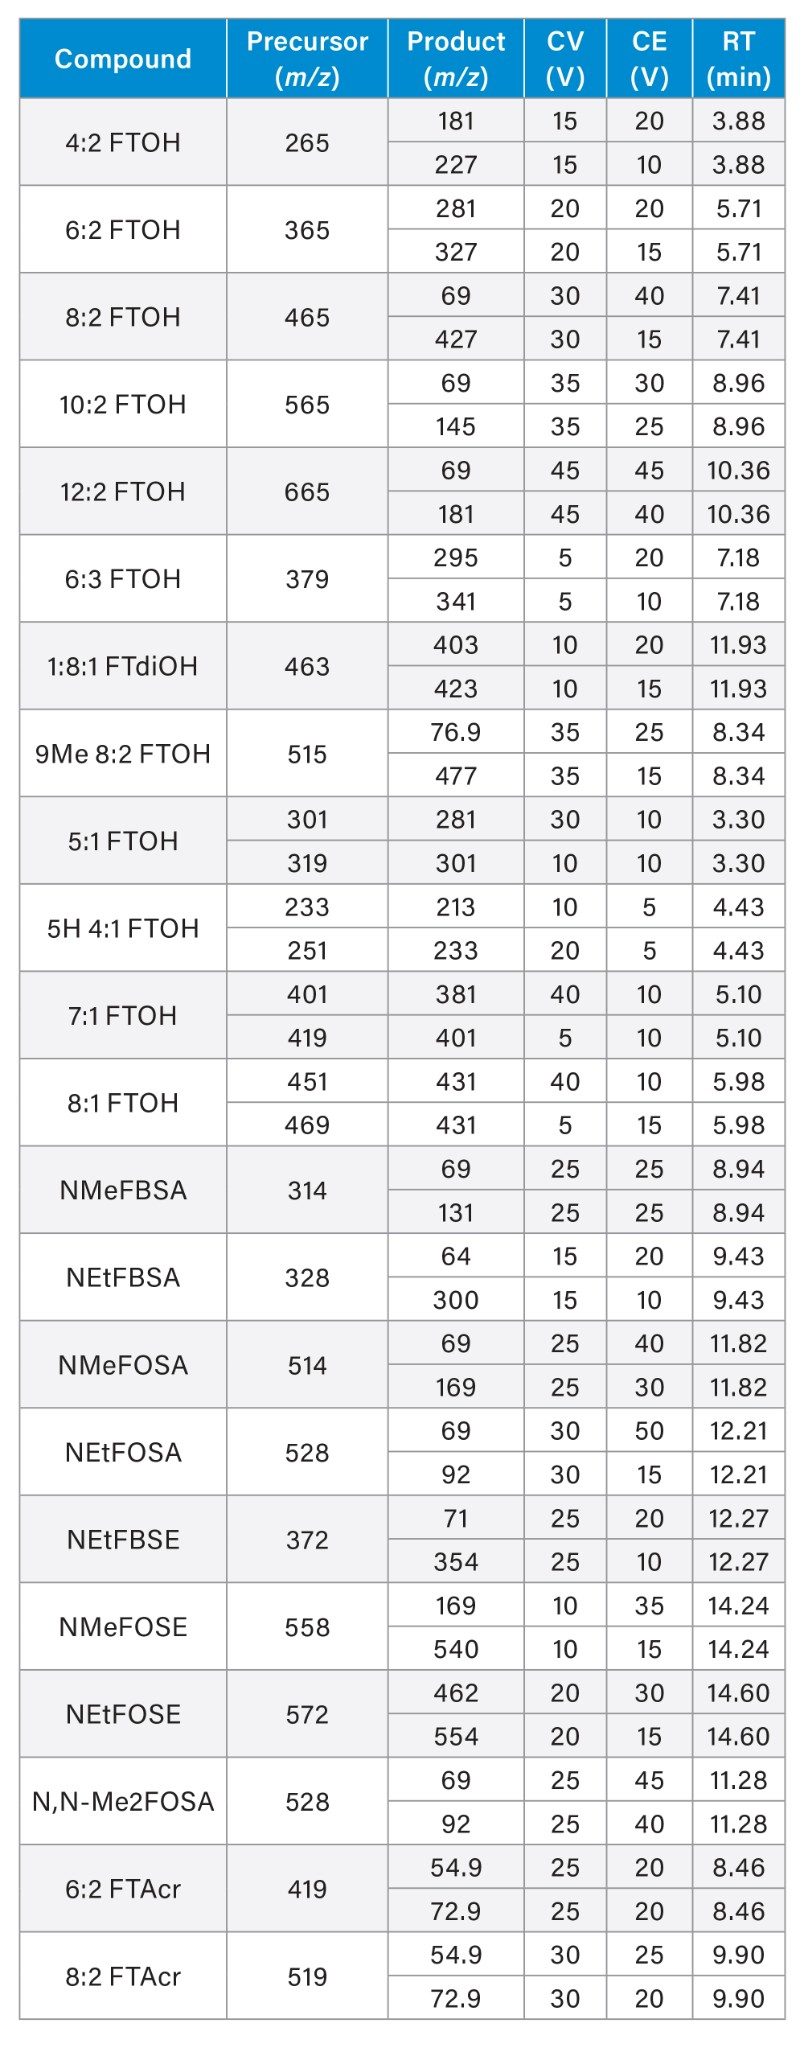
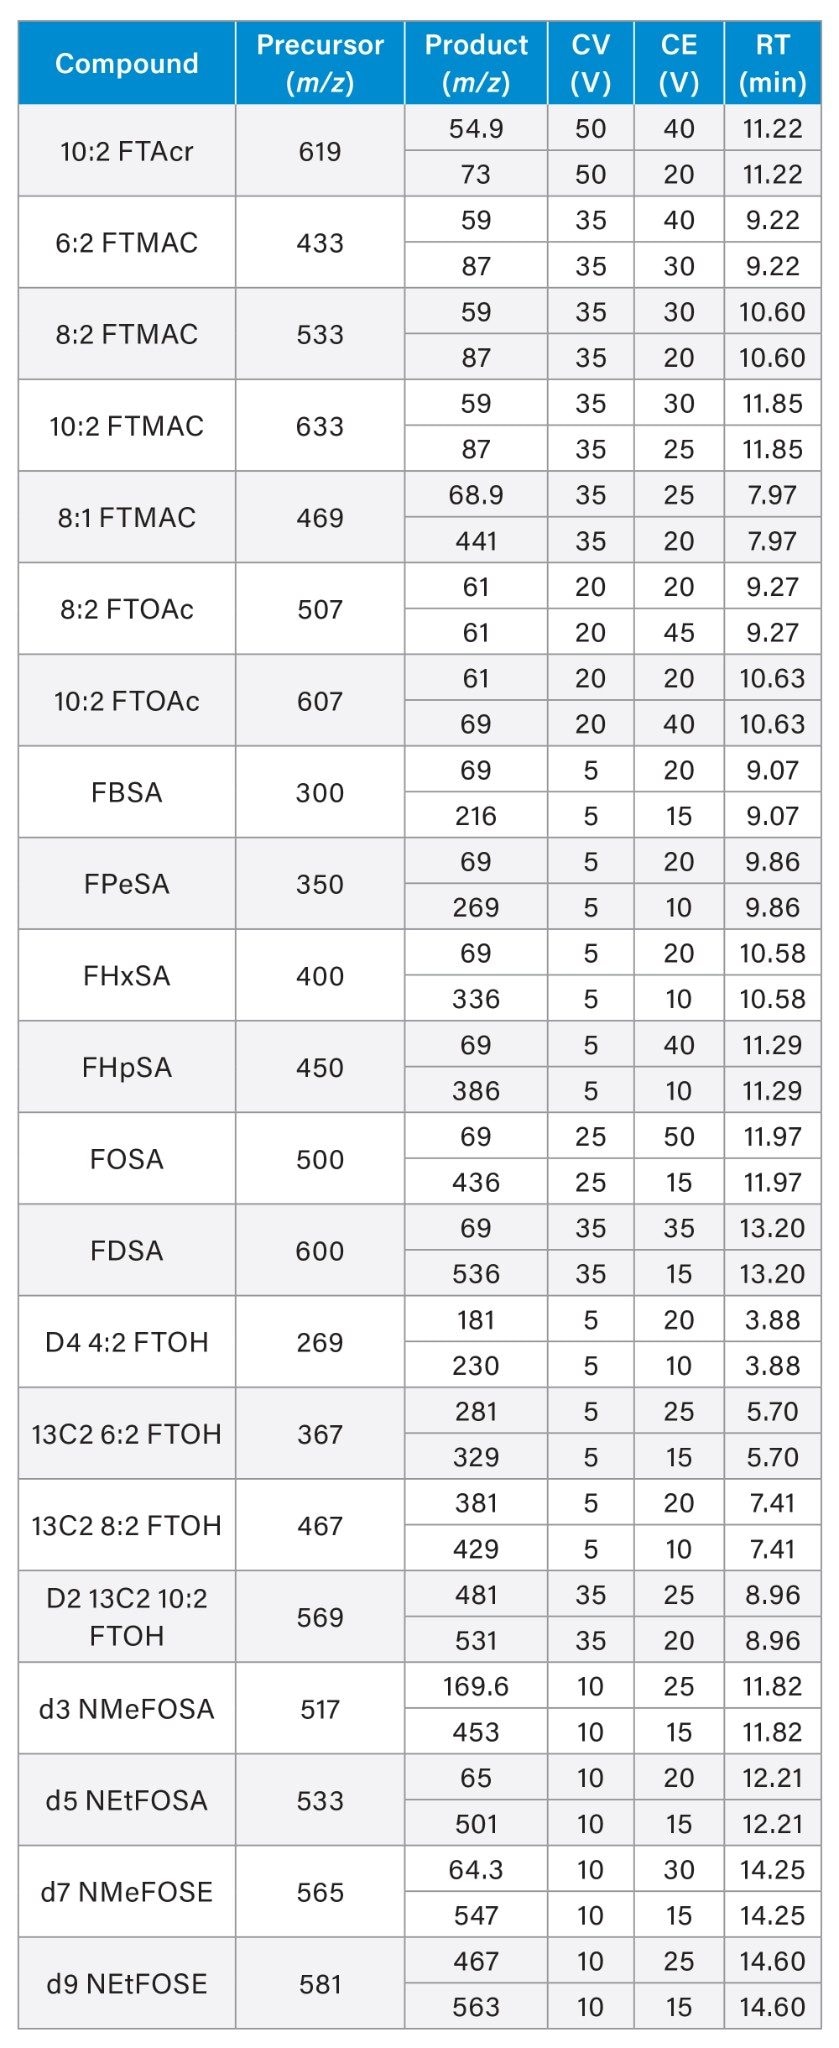
See Appendix for Full MRM Method details |
Data Management
|
Software: |
waters_connect™ for Quantitation Software |
Results and Discussion
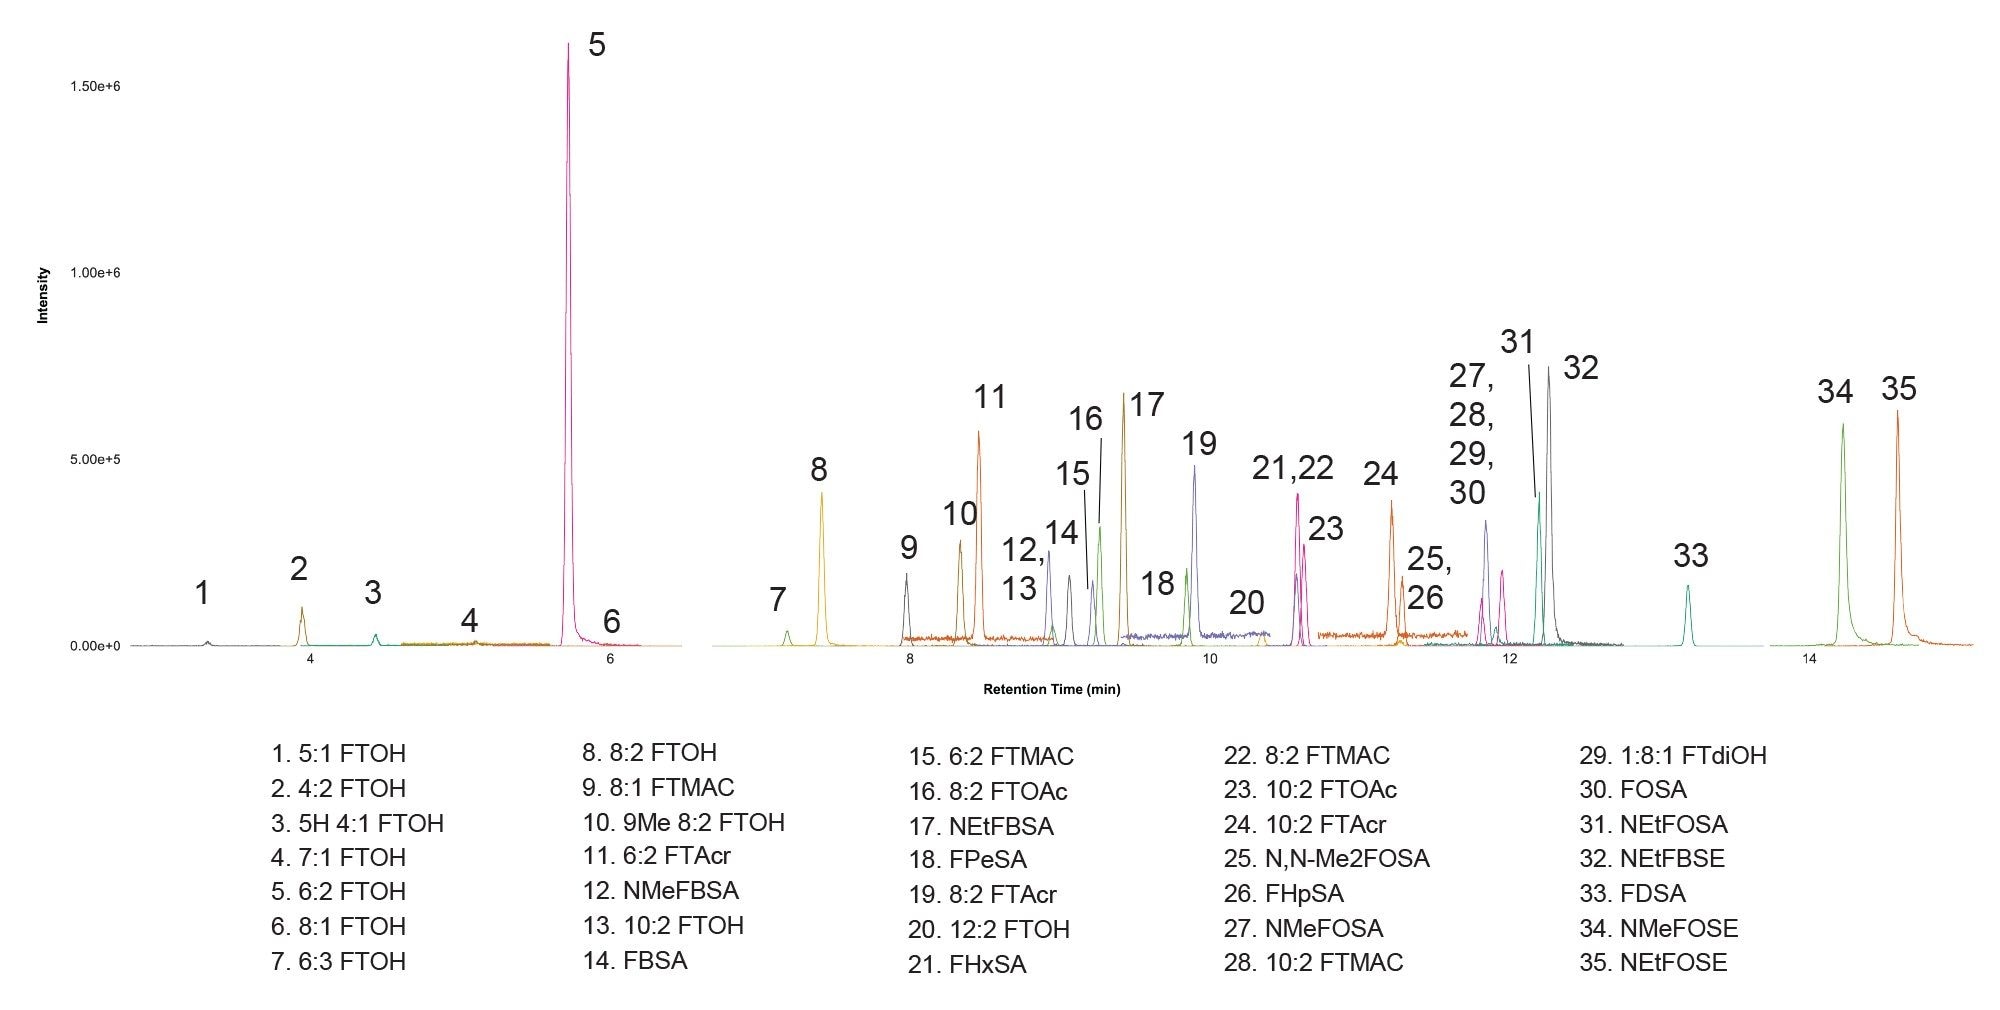
The applicability of the method developed for GC amenable PFAS6 was evaluated in a variety of environmental and food packaging sample matrices. An example chromatogram of the full panel of PFAS targeted in all samples is shown in Figure 1, demonstrating a wastewater sample extract post spiked with 25 ng/mL (in vial concentration). This sample contained a significant amount of 6:2 FTOH (peak 5), therefore, the peak response shown in this example is elevated, relative to other compounds shown. Otherwise, this example demonstrates that the presence of sample matrix did not affect the peak shape or resolution.
Environmental Sample Analysis:
Of the environmental samples tested, only wastewater and soil samples contained detectable levels of the targeted GC-amenable PFAS, consisting predominantly of the fluorotelomer alcohols.
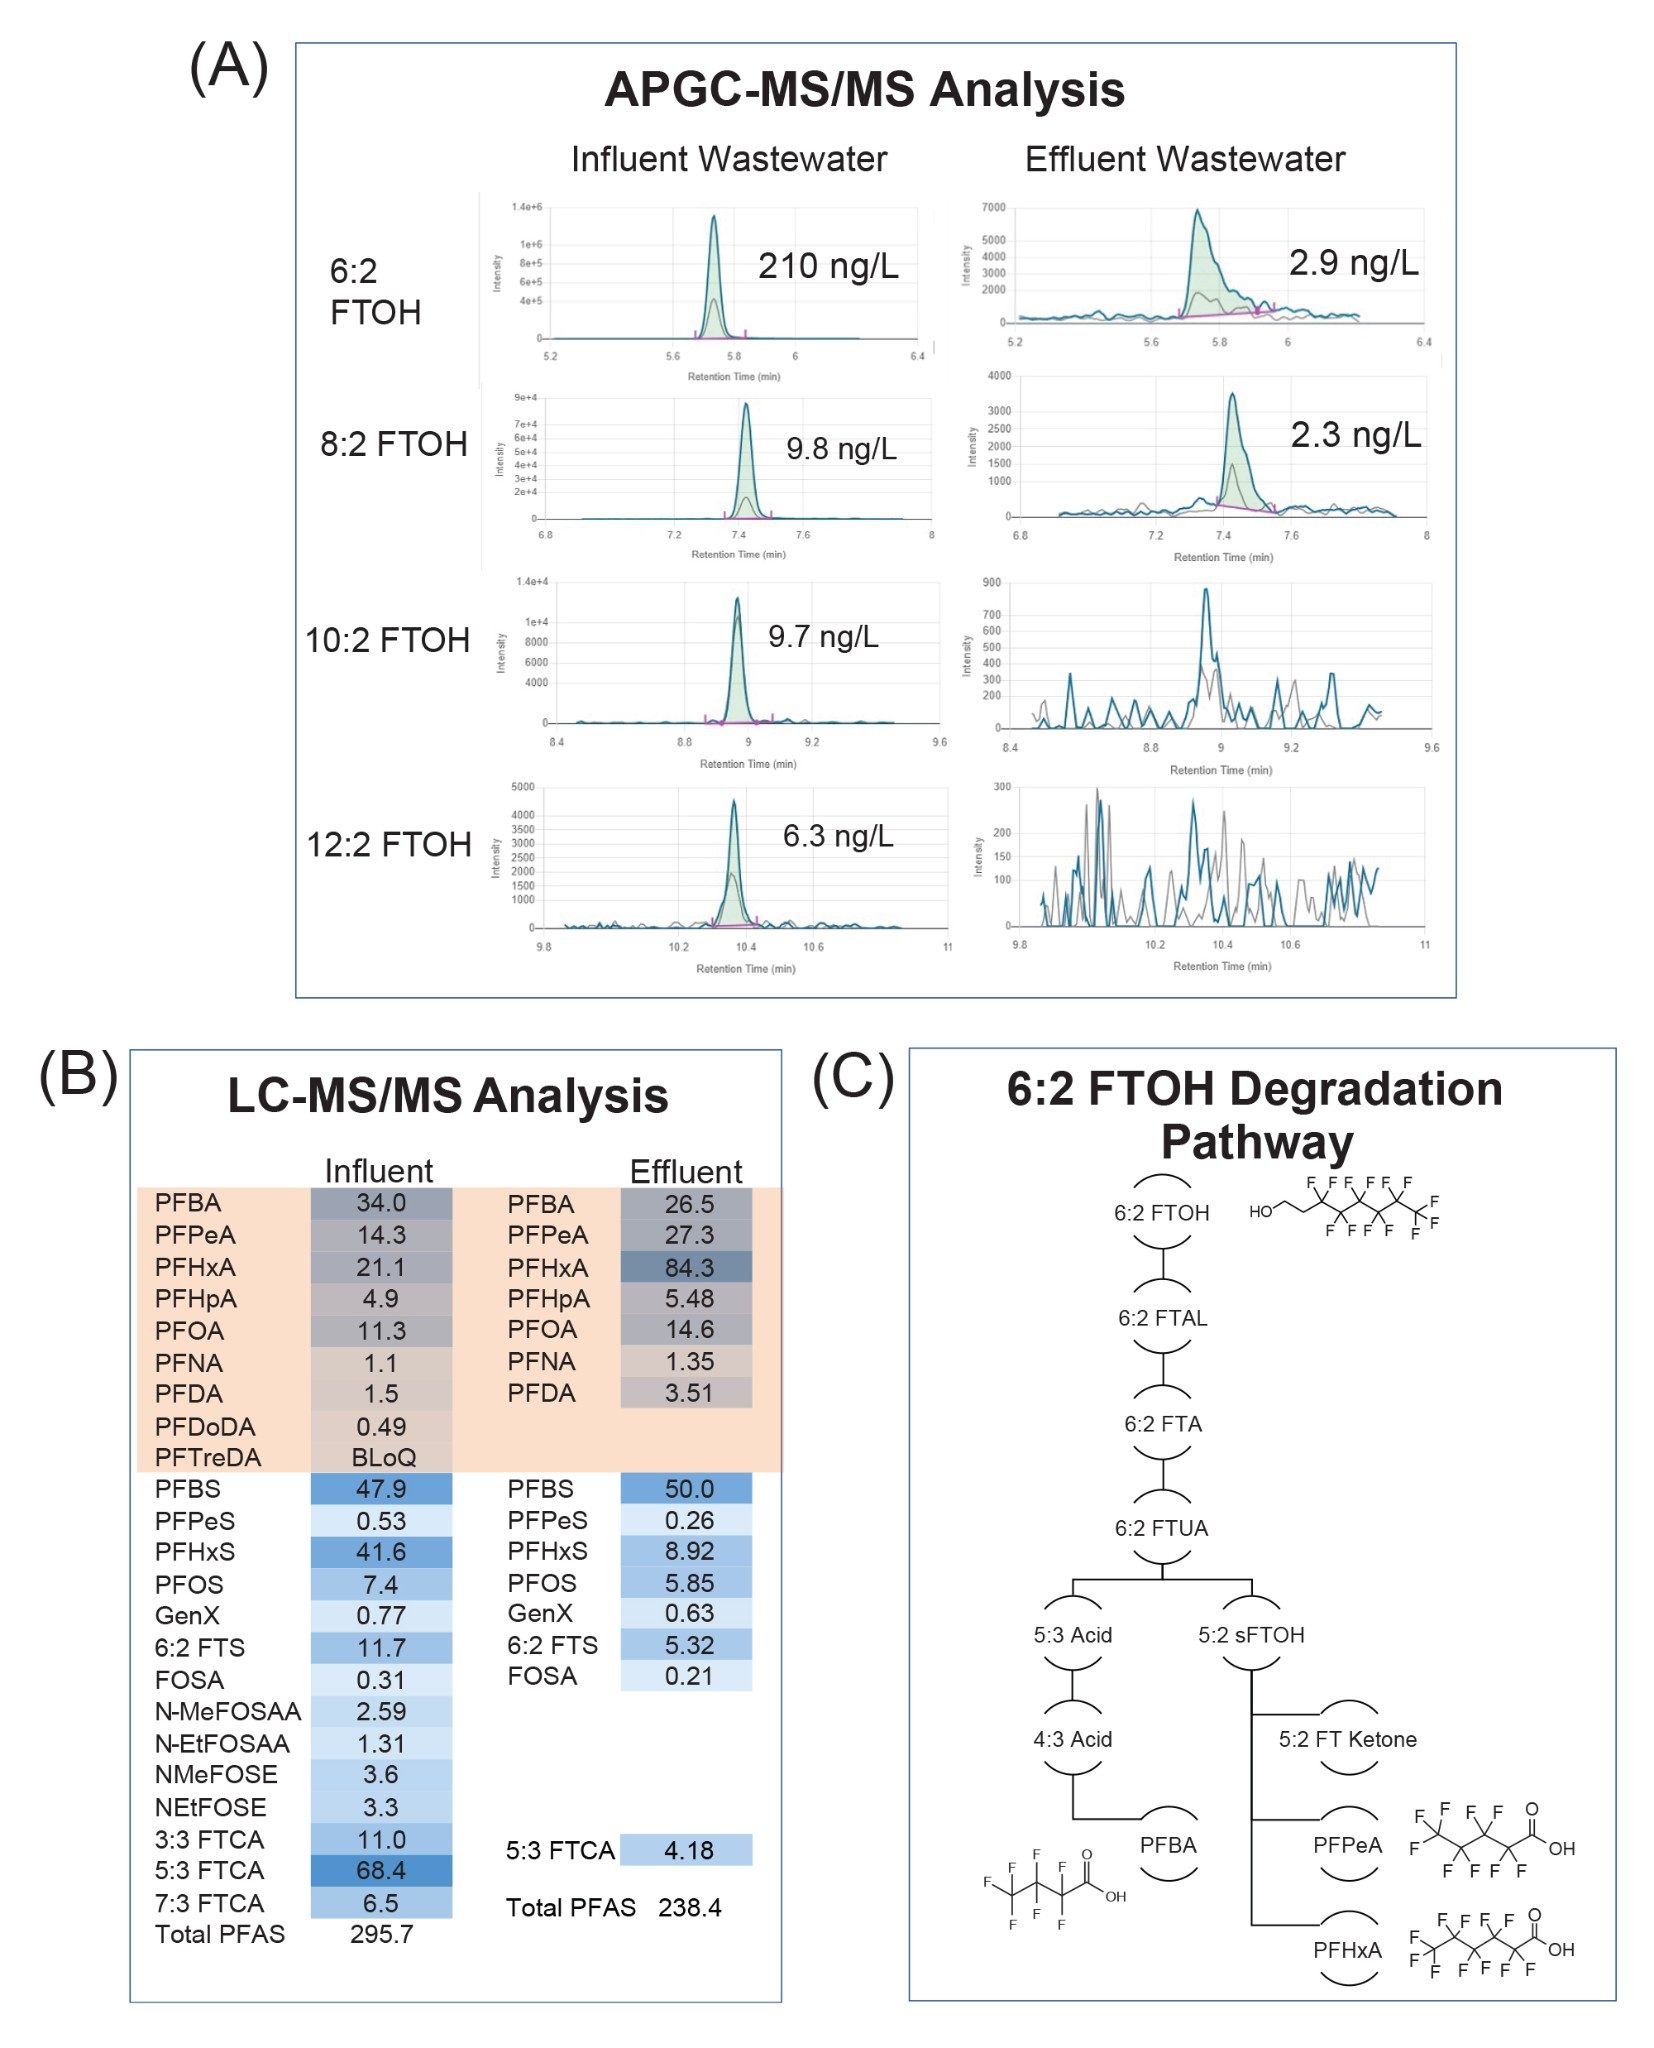
Wastewater treatment plants are known to be a significant source of volatile and semi-volatile PFAS emissions.10 Figure 2A demonstrates the results of the analysis of influent and effluent wastewater samples. 6:2, 8:2, 10:2 and 12:2 FTOH were quantified in the influent wastewater in the range of 6.3–219 ng/L (sample concentration). Only 6:2 and 8:2 FTOH were observed above the detection limit in the effluent and were quantified at 2.9 and 2.3 ng/L, respectively. This suggests the substantial removal of the fluorotelomer alcohols during the treatment process. When considering the previous analysis of the same samples using LC-MS/MS (Figure 2B), it appears as though the FTOH compounds in the influent water are transforming into their PFCA end products. In the LC-MS/MS analysis, the concentration of the C4–C10 PFCAs either increased or appear to remain relatively unchanged in the effluent water when compared to the influent water. A typical pathway of degradation for 6:2 FTOH is shown in Figure 2C, with the end products being C4–C6 PFCAs. These observations suggest that precursor transformation occurring during treatment may contribute to PFCA concentrations observed in the effluent. Without the ability to fully characterize the samples using both LC-MS/MS and GC-MS/MS, it would not be possible to identify the incoming precursor PFAS contributing to the PFCA effluent levels.
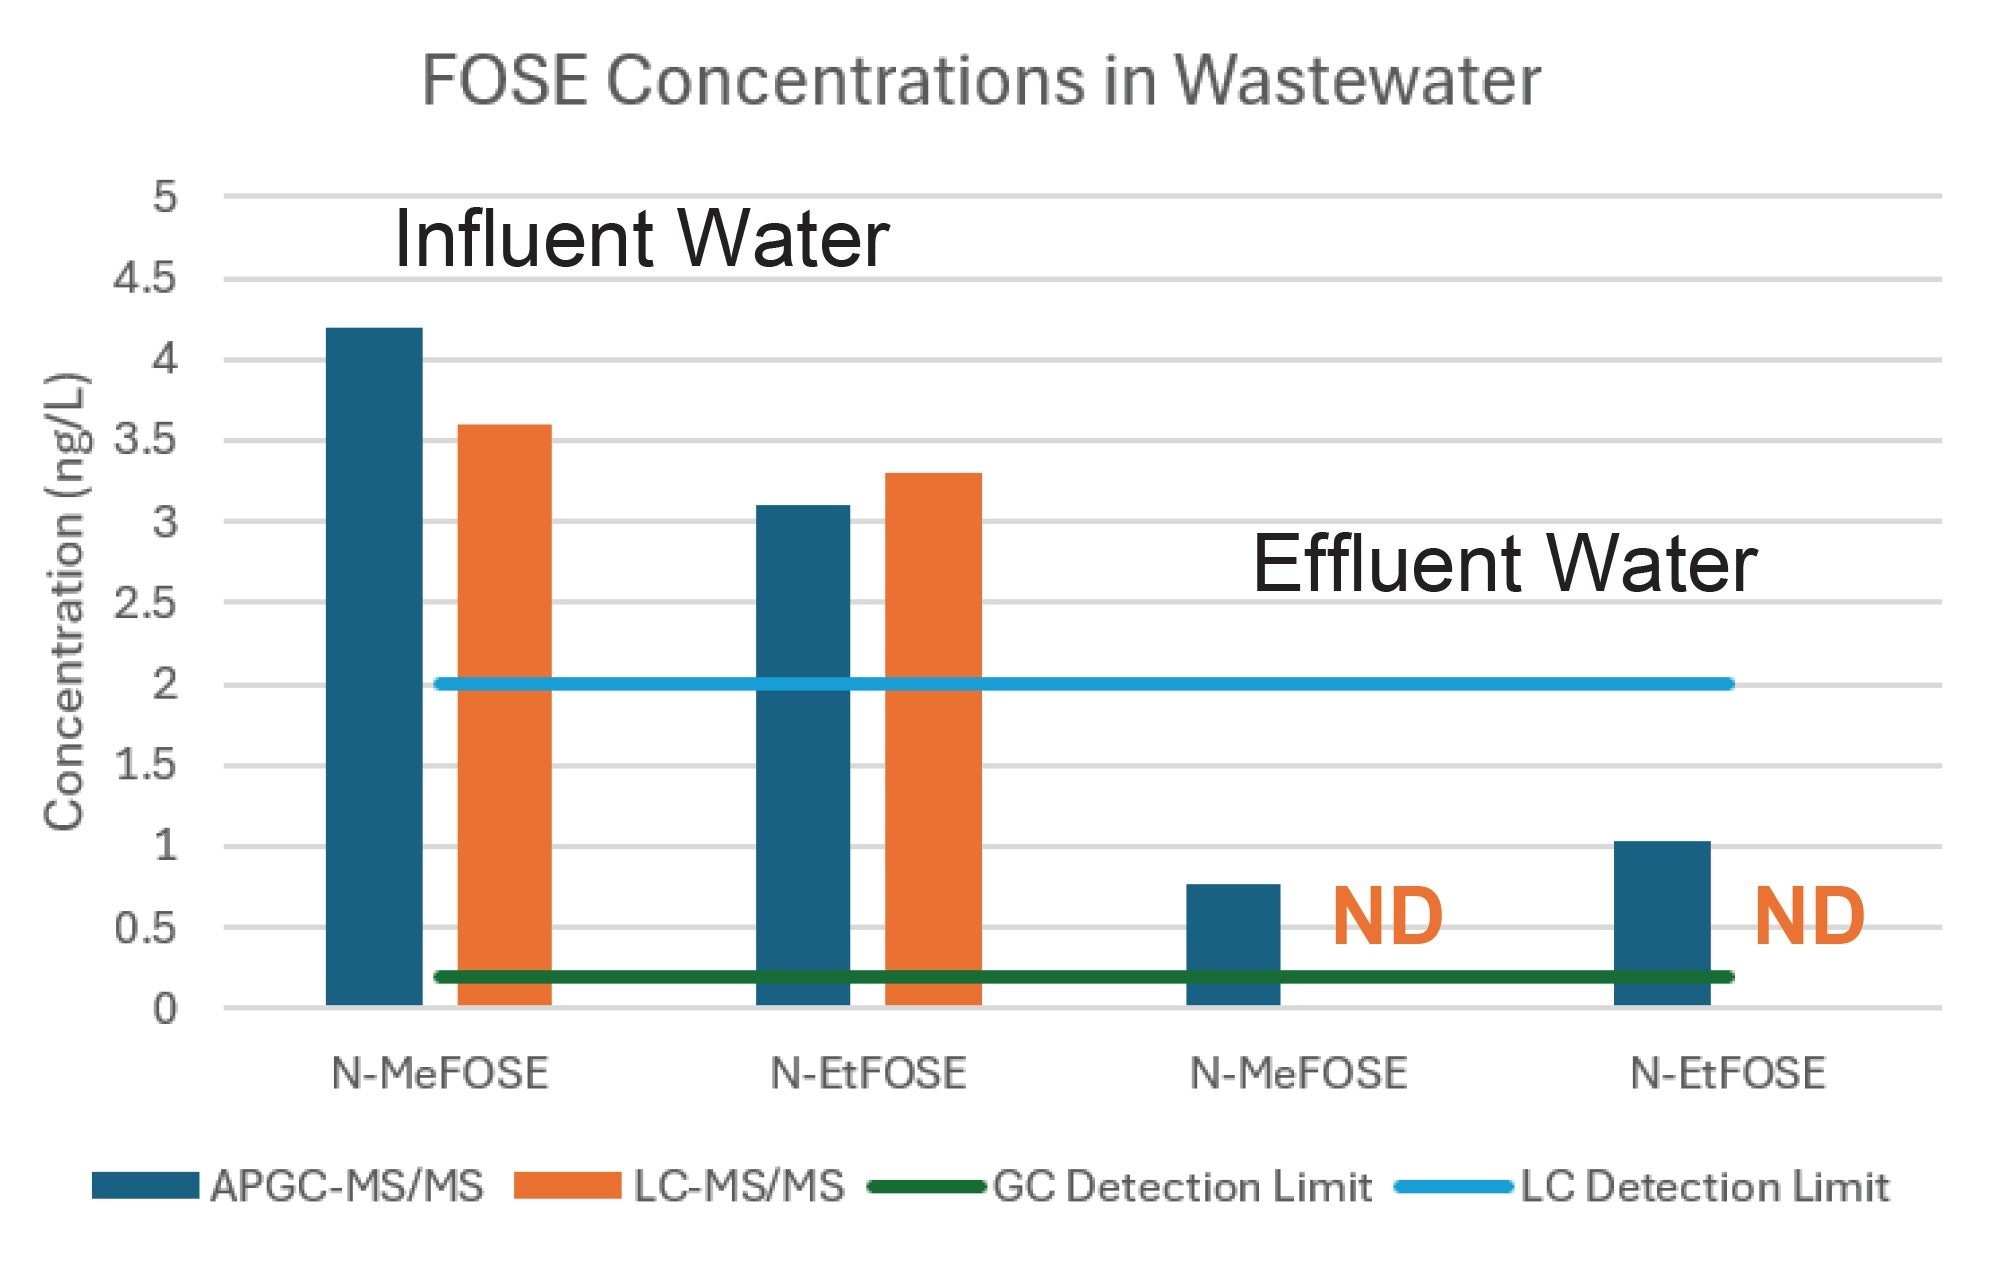
In addition to the FTOHs, the GC analysis of the wastewater samples identified N-MeFOSE and N-EtFOSE in both the influent and effluent water. Figure 3 compares the detected concentrations using both APGC-MS/MS and LC-MS/MS analysis. Calculated concentrations in the influent water samples were consistent from both analysis techniques, confirming that APGC-MS/MS and LC-MS/MS provide complementary results for compounds measurable by both methods. Due to the sensitivity of the APGC technique being higher for these compounds, both were detected in the effluent water. When using LC-MS/MS, the levels were below the detection limit, and therefore not detected.
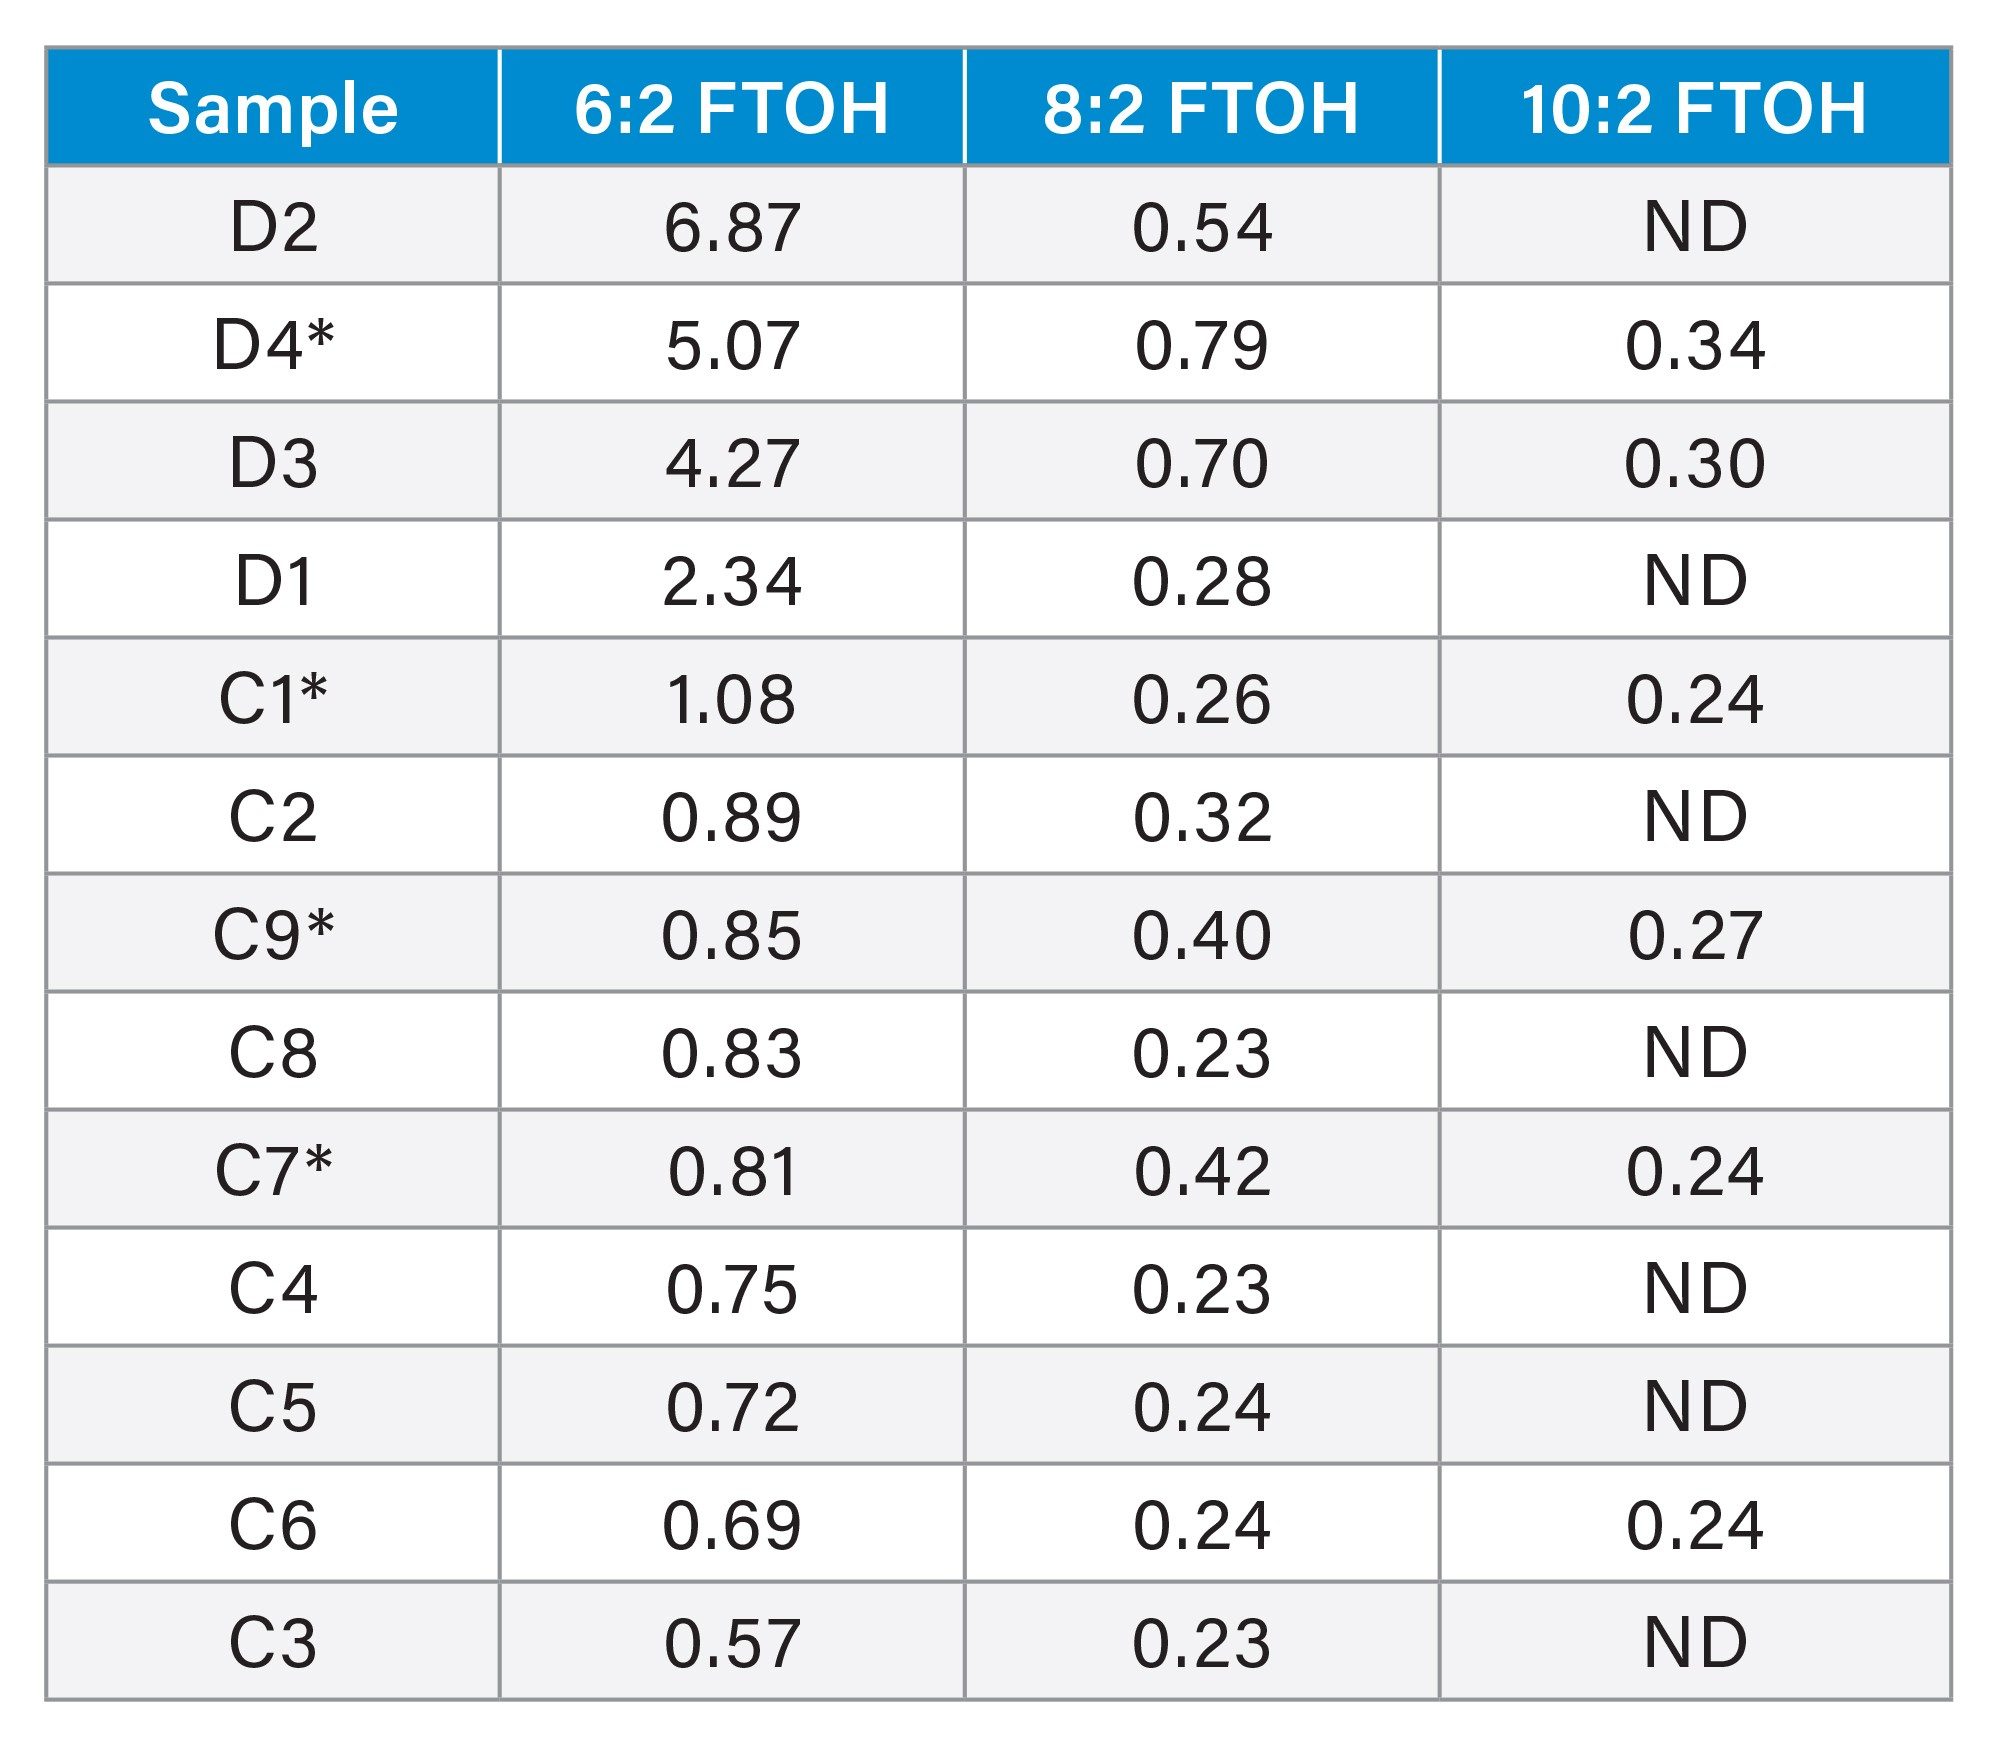
Soil samples were collected at two different ski facilities at locations where ski wax application is known to have occurred. One site was a downhill ski slope (D samples), and the second site was a cross-country ski track (C samples). Studies on the impact of air quality during application of fluorinated ski waxes have identified predominantly 6:2 and 8:2 FTOH.11 The APGC-MS/MS analysis of these samples identified 6:2, 8:2 and 10:2 FTOH in the soil, as detailed in Table 1, with known locations of wax application indicated. The downhill site had approximately an order of magnitude higher levels of 6:2 FTOH than the cross-country site. At the downhill site, levels were highest at the race start line (D2) and the wax application area located right before the start line (D4). The finish line (D3) had the third highest levels, which could correlate to wax abrading off the skis as the skier begins to stop. At the cross-country site, there are elevated levels at one of the known wax application sites (C1), but the levels are fairly consistent at all sites, even those farthest from the wax application sites (C8). This could indicate that the presence of FTOHs at this location may be more attributed to atmospheric deposition than ski wax use.
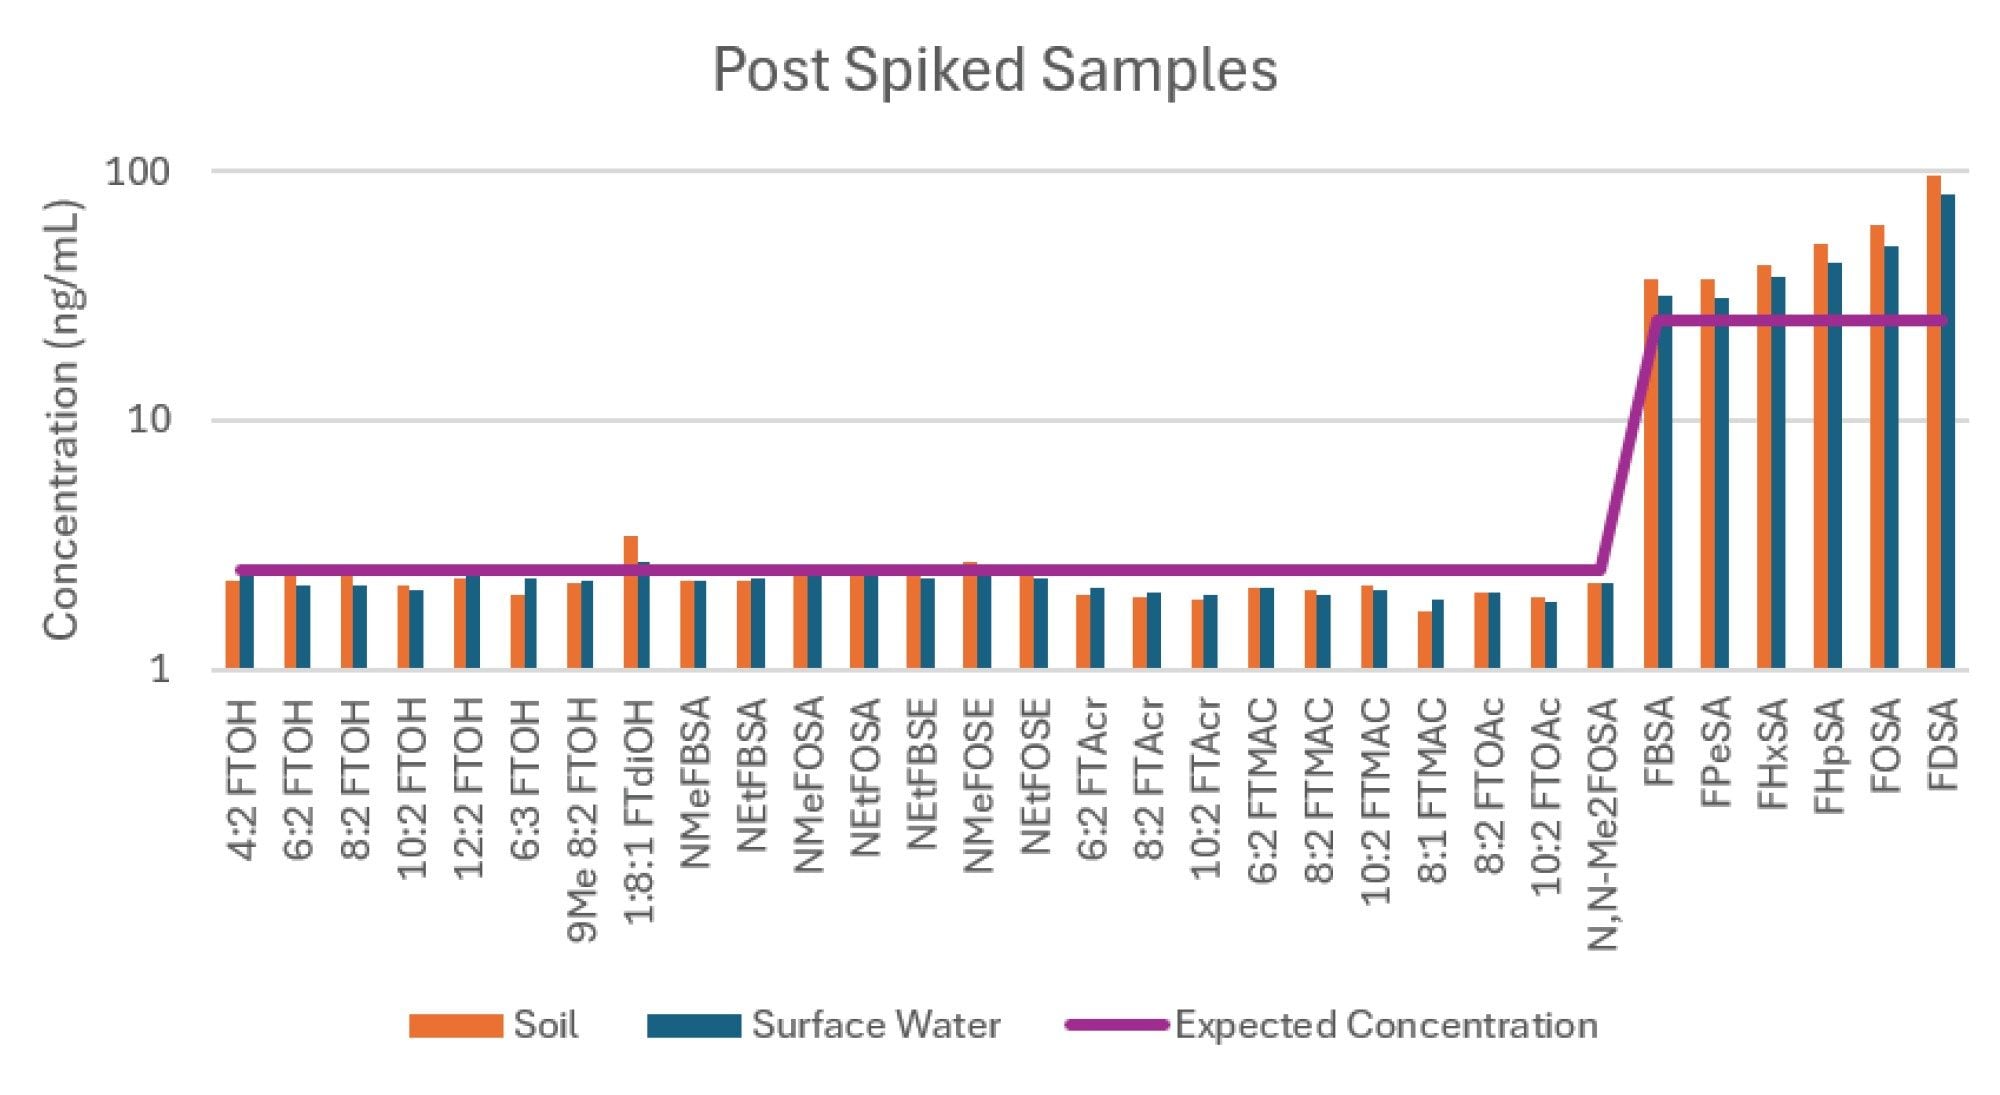
To assess the accuracy of the method, soil and surface water extracts were post spiked with the equivalent of 2.5–25 ng/mL (in vial concentration) of the targeted PFAS. Figure 4 compares the average calculated concentration of the post spiked samples compared to the expected concentration for each compound. The FTOH, N-xFOSA, and N-xFOSE compounds quantified within good accuracy to the expected concentration. The FTAcr, FTMAC, and FTOAc compounds had lower than expected concentrations when post spiked into the samples. These compounds are intermediate compounds in the oxidative pathway that eventually terminates in PFCAs and therefore most likely experienced some oxidative degradation while sitting in the GC autosampler. The sulfonamides (FxSA) had a high calculated concentration which was due to inlet carryover in these samples.
Food Packaging Sample Analysis
Food packaging materials for this study were obtained from various sources in the United States and consisted of paper and paperboard materials. Upon analysis using the APGC-MS/MS method, none of the samples had any detectable levels of the 35 targeted PFAS. Although this was a limited sampling scope confined to seven different packaging materials, the findings are compliant with current FDA restrictions, at least for the targeted PFAS in this study.
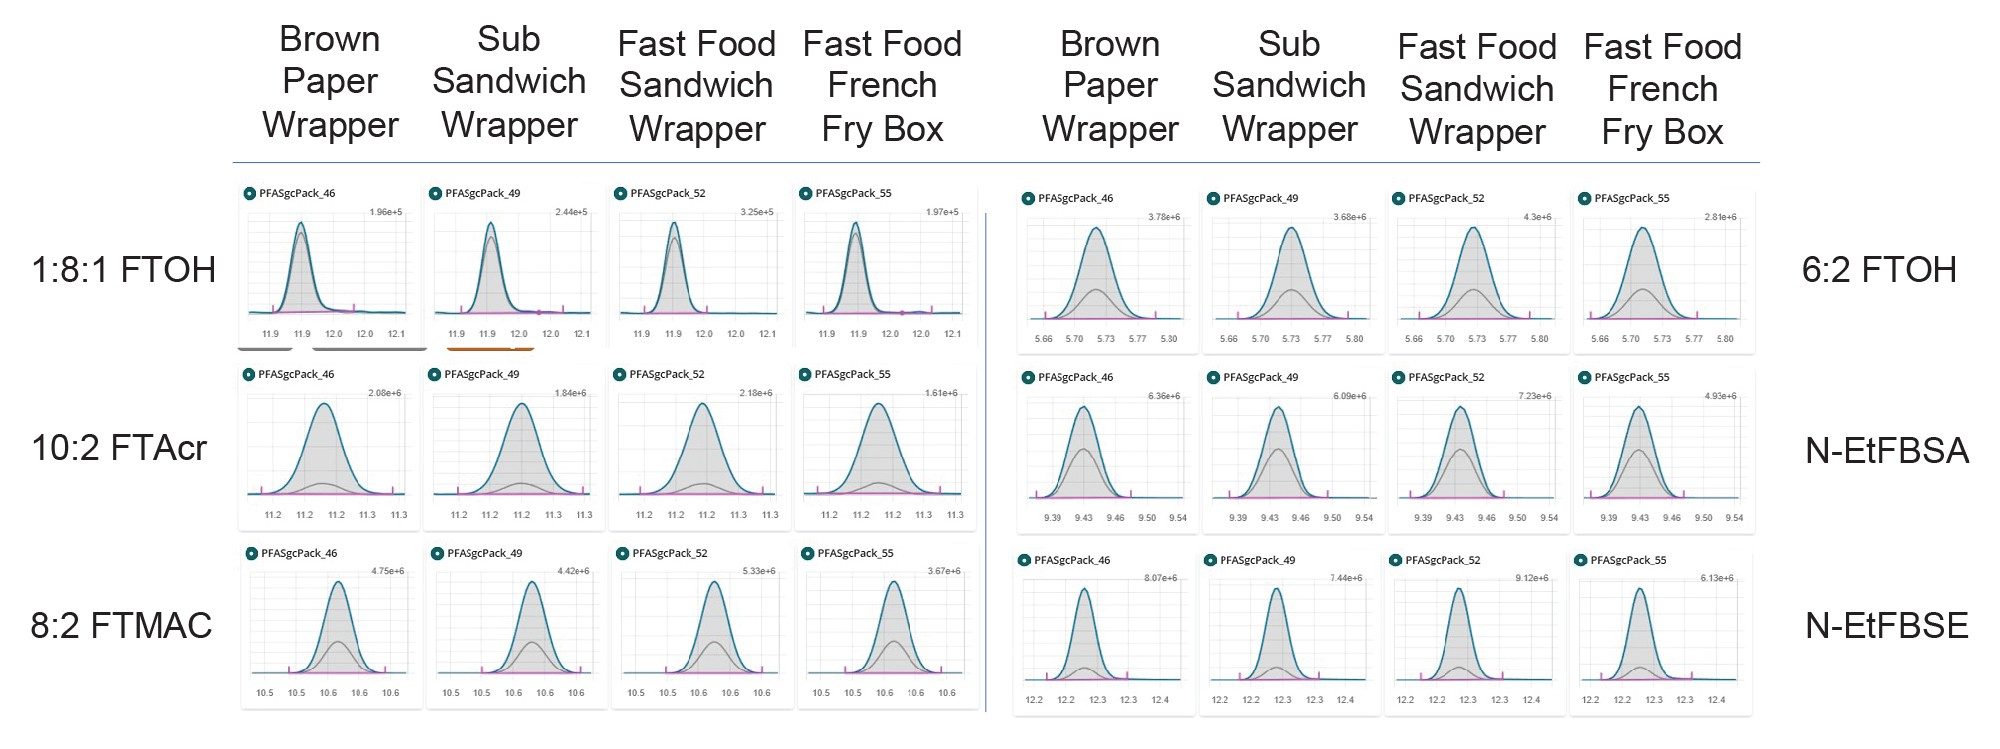
The extracted packaging samples were post spiked at 25 ng/mL (ppb) to evaluate the method’s use for compliance testing in accordance with the EU food contact packaging regulation. Chromatograms of selected PFAS at 25 ng/mL in different paper and paperboard packaging materials can be seen in Figure 5. All PFAS had excellent response at this level demonstrating that this method would confidently be able to monitor food packaging materials at well below the required limit of 25 ng/mL.
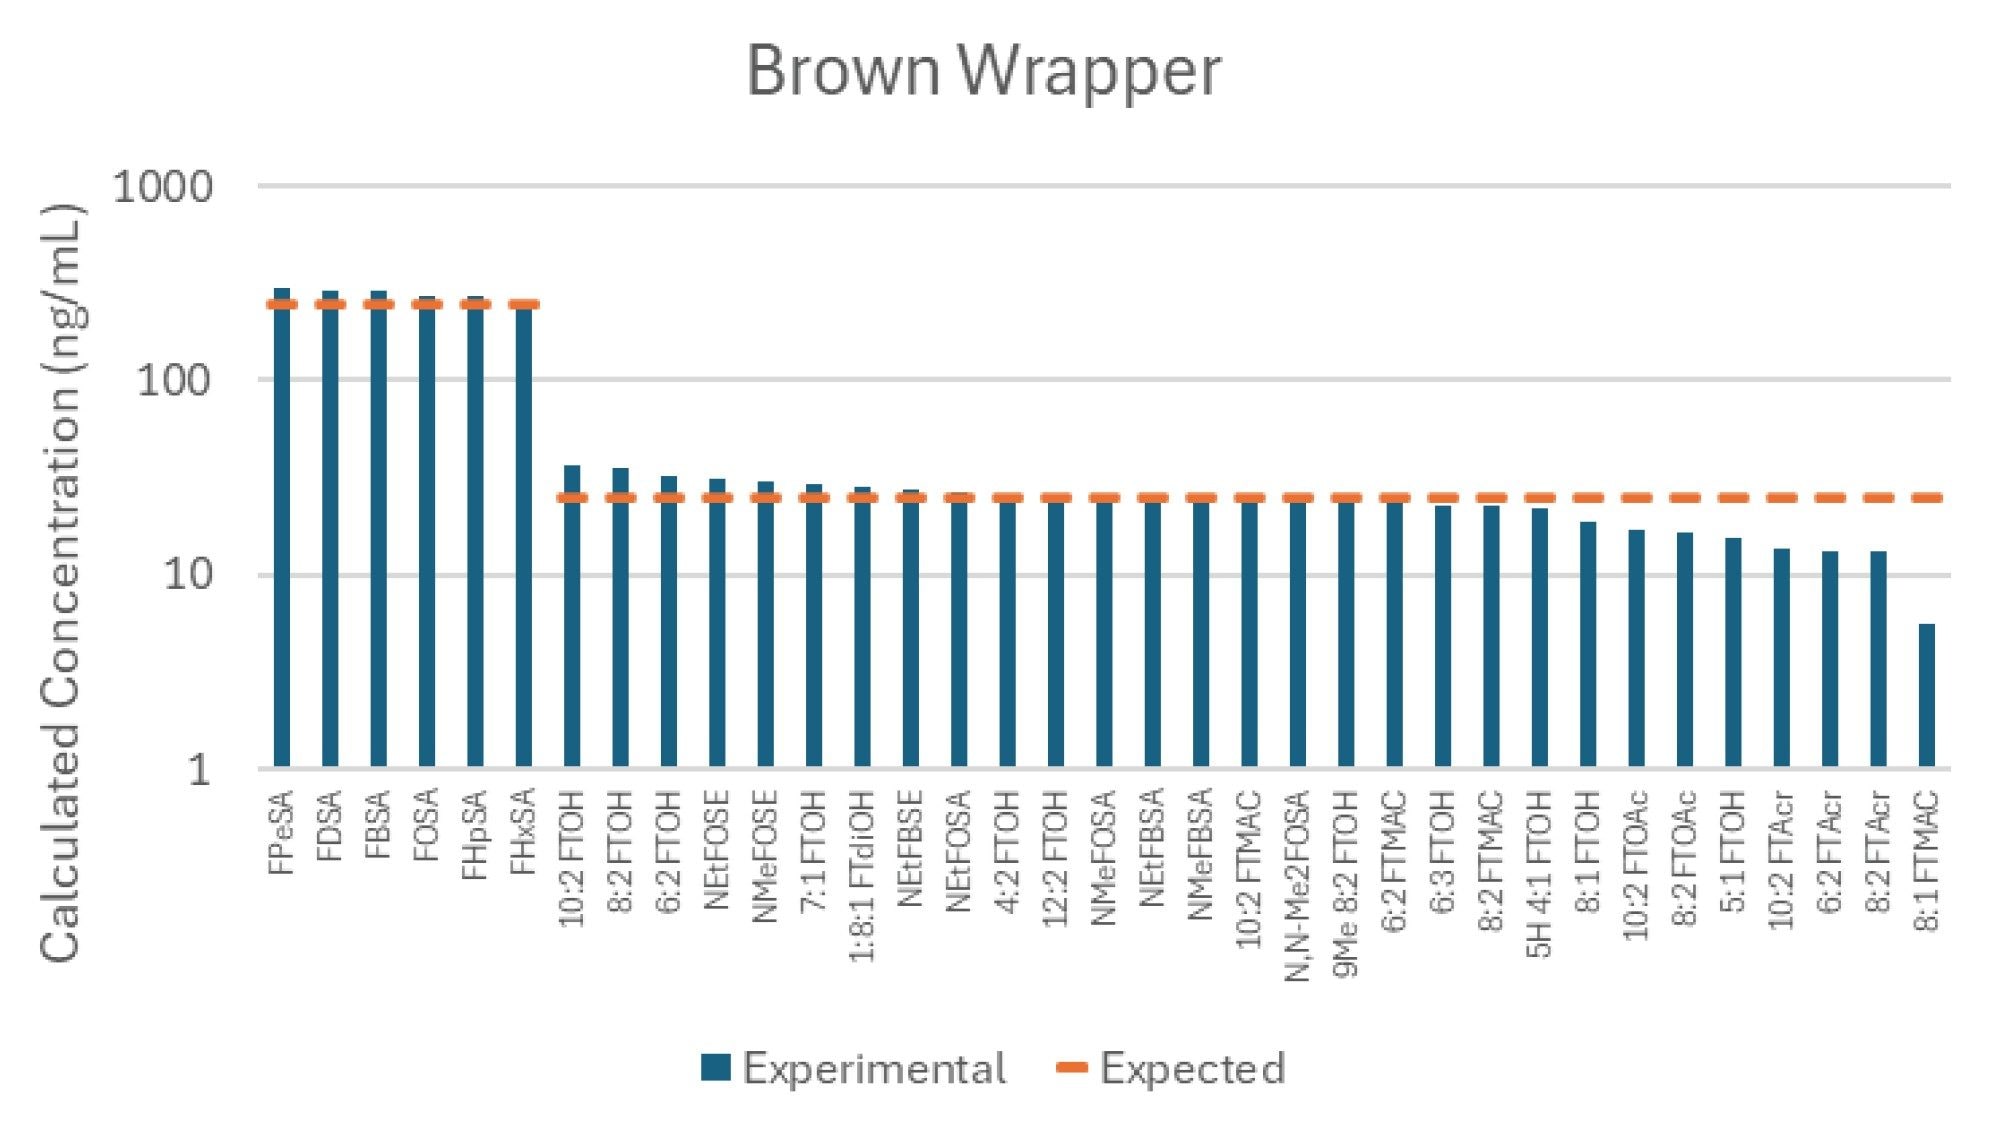
The accuracy of the method was also tested by comparing the calculated concentration of the post spiked packaging samples with the expected 25 ng/mL (250 ng/mL for sulfonamides) concentration. Figure 6 demonstrates this comparison in the brown paper wrapper sample, with all compounds showing excellent accuracy, except for the FTAcr, FTMAC and FTOAc compounds which, like the environmental samples, quantified at lower concentrations than expected, potentially due to oxidation.
Conclusion
The APGC-MS/MS method developed for the analysis of 35 GC-amenable PFAS demonstrated robust performance across diverse environmental and food packaging matrices, providing sensitive and selective detection of volatile and semi-volatile PFAS that are not routinely captured by LC-MS/MS alone. Application of the method identified FTOHs as the predominant GC-amenable PFAS in wastewater and soil samples. This method proved to be complementary to previous LC-MS/MS analysis by identifying precursor compounds that appear to have transformed into terminal PFCAs during the treatment process. The method also successfully characterized PFAS contamination associated with ski wax application and showed good accuracy for most target analytes in environmental matrices. Analysis of paper and paperboard food packaging materials did not detect any of the targeted PFAS, suggesting compliance with current regulatory restrictions for the compounds included in this study. Post-spike experiments confirmed the method's suitability for monitoring PFAS at concentrations well below emerging European regulatory limits. By expanding PFAS characterization beyond routinely monitored analytes, the combined APGC-MS/MS and LC-MS/MS workflow provides laboratories with greater confidence when investigating PFAS sources, environmental fate, and regulatory compliance. Overall, the method performance was strong, demonstrating that APGC-MS/MS is a valuable complementary tool to LC-MS/MS for PFAS characterization, environmental monitoring, source identification, and regulatory compliance testing.
References
- Buck, R. C.; et al. Perfluoroalkyl and Polyfluoroalkyl Substances in the Environment: Terminology, Classification, and Origins. Integrated Environmental Assessment and Management, 7. 2011.
- US FDA. FDA Announces the Voluntary Phase-Out by Industry of Certain PFAS Used in Food Packaging | FDA. Updated 31 July 2020. Accessed 24 August 2026.
- US FDA. Market Phase-Out of Grease-Proofing Substances Containing PFAS | FDA. Updated 3 January 2025. Accessed 24 August 2026.
- Federal Register. Federal Register :: Food Contact Notifications That Are No Longer Effective. Updated 6 January 2025. Accessed 24 August 2026.
- European Parliament and Council, Regulation (EU) 2025/40 of 19 December 2024 on Packaging and Packaging Waste, Amending Regulation (EU) 2019/1020 and Directive (EU) 2019/904, and Repealing Directive 94/62/EC. Official Journal of the European Union, L 2025/40, 22.1.2025.
- Organtini, K.; Rosnack, K.; Dorman, F.; Stup, K. Extending PFAS Analytical Workflows with APGC-MS/MS Analysis: A Method for 35 GC-Amenable PFAS Compounds. Waters Application Note 720009500. 2026.
- US Environmental Protection Agency. EPA 1633A: Analysis of Per- and Polyfluoroalkyl Substances (PFAS) in Aqueous, Solid, Biosolids, and Tissue Samples by LC-MS/MS. December 2024.
- Organtini, K.; Rosnack, k.; Plummer, C.; Hancock, P.; Burt, O. Analysis of Per- and Polyfluoroalkyl Substances (PFAS) in Accordance with EPA 1633 Part 2: Analysis of Aqueous Matrices. Waters Application Note 720008143. 2023.
- Organtini, K.; Rosnack, k.; Plummer, C.; Hancock, P.; Burt, O. Analysis of Per- and Polyfluoroalkyl Substances (PFAS) in Accordance with EPA 1633 Part 3: Analysis of Soil and Tissue. Waters Application Note 720008230. 2024.
- Vieira, H.G.; Canela, M.C.; Urban, R.C.; Cabrero, B.S. Current knowledge about per- and polyfluoroalkyl substances (PFAS) in the Atmosphere: Fate, Analytical Methods and Research Priorities. Chemosphere, 389, 2025.
- Crawford, K.A; Hartmann, N. Respiratory Exposure to Highly Fluorinated Chemicals via Application of Ski Wax and Related Health Effects. Current Environmental Health Reports, 11. 2024.
Appendix
Table 1. APGC-MS/MS MRM Method Details
720009614, October 2026


