In this work, the extent of comparability was established between multiple batches of innovator and candidate biosimilar infliximab, using an integrated analytical platform with capabilities for automated data processing and reporting. The Biopharmaceutical Platform Solution with UNIFI Scientific Information System was applied to study these samples at the level of reduced heavy and light chain subunits, and to report on several biotherapeutic structural differences between these preparations.
A streamlined workflow within an integrated UPLC-MS/MS system solution that features automated data acquisition, processing, and reporting, and that is deployable to both regulated and non-regulated laboratories, enables efficient structural analysis and comparative analysis of multiple batches of an innovator product and its biosimilar candidate within a comparability study.
The expiration of patents and other intellectual property rights for originator biologics over the next decade opens up ample opportunities for biosimilars to enter the market and push industry competition to a high level.1-4
Compared to small molecule drugs, biopharmaceuticals have much more complex structures and are more expensive to develop. The complexity of the biopharmaceutical molecular entity puts greater challenges on organizations seeking to manufacture safe and effective biosimilar products for patients. Regulatory bodies such as the U.S. FDA and EMA5-8 require a demonstration of comprehensive characterization for the drug substance: Confirming primary sequence and identifying post-translational modifications (PTMs), establishing biophysical and functional comparability for the innovator and candidate biosimilar, and performing studies that establish expected variation within an innovator biotherapeutic.
Infliximab (Remicade) is a monoclonal antibody (mAb) used to treat autoimmune diseases; it was first approved by the FDA for the treatment of Crohn’s disease in 1998, and in 2013 two biosimilars have been submitted for approval in Europe.
In this application note, we characterize infliximab and a biosimilar candidate, produced in a different cell line, using Waters Biopharmaceutical Platform Solution with UNIFI Scientific Information System. The objective is to screen multiple lots of both the innovator and biosimilar products at the subunit level (light chain (LC) and heavy chain (HC)) to establish comparability at this higher level of structure. Lot-to-lot and batch-to-batch comparisons will show product variation, illustrating the range of quality attributes to be considered in a candidate biosimilar.
Column: |
ACQUITY UPLC Protein BEH C4 Column, 300A, 1.7 μm, 2.1 mm x 50 mm (p/n 186004495) |
Column temp.: |
80 °C |
Mobile phase A: |
Water |
Mobile phase B: |
Acetonitrile |
Mobile phase C: |
Not used |
Mobile phase D: |
0.5% TFA (in water) |
Detection: |
UV 280 nm |
Time (min) |
Flow (mL/min) |
%A |
%B |
%C |
%D |
Curve |
---|---|---|---|---|---|---|
Initial |
0.20 |
65.2 |
29.8 |
0 |
5.0 |
Initial |
12.0 |
0.20 |
63.5 |
31.5 |
0 |
5.0 |
6 |
14.0 |
0.20 |
63.5 |
31.5 |
0 |
5.0 |
6 |
14.1 |
0.20 |
10.0 |
85.0 |
0 |
5.0 |
6 |
15.1 |
0.20 |
10.0 |
85.0 |
0 |
5.0 |
6 |
15.2 |
0.20 |
65.2 |
29.8 |
0 |
5.0 |
6 |
18.0 |
0.20 |
65.2 |
29.8 |
0 |
5.0 |
6 |
Total run time: 20.0 min |
Capillary: |
3.0 kV |
Sampling cone: |
80 V |
Extraction cone: |
4 V |
Source temp.: |
125 °C |
Desolvation temp.: |
350 °C |
Cone gas flow: |
0 L/Hr |
Desolvation gas flow: |
800 L/Hr |
MaxEnt 1 for MS spectra deconvolution
UNIFI Scientific Information System
Three batches of innovator infliximab were acquired from Jenssen Biotech, Inc. (Horsham, PA, USA). The batches were produced by the SP2/0 mouse cell line. Three batches of candidate biosimilar infliximab produced by an alternative mammalian cell line (Chinese hamster ovary (CHO)) were obtained from a third-party collaborator. All of the samples were stored at -80 °C before analysis.
A reduction buffer solution containing 25 mM NaCl, 25 mM Tris, 1 mM EDTA (pH 8.0) was made to prepare mAb subunits. For each of the six batches, 10 μL of formulated mAb solution (21 mg/mL, the commonly used concentration level for patient injection) was mixed with 180 μL of reduction buffer in a 1.5 mL Eppendorf tube for a protein concentration of 1.0 mg/mL. A concentrated dithiothreitol (DTT) solution (100 mM in H2O) was then added to each solution to obtain a final DTT concentration of 1.0 mM. The samples were incubated at 37 °C for 20 minutes. The samples were briefly centrifuged, then 105 μL of each sample was mixed with an equal volume of aqueous solution containing 3% acetonitrile and 0.1% formic acid. The final concentration of the mAb was about 0.5 mg/mL. Triplicate injections of each sample were made onto an ACQUITY UPLC Protein BEH C4 Column, 300Å, 1.7 μm, 2.1 mm x 50 mm (p/n 186004495) LC-MS analysis of the mAb subunit.
Figure 1 shows the reversed-phase LC-MS chromatograms from the analysis of reduced infliximab from both the innovator and biosimilar products. There are two major components to each chromatogram, a peak at ~3.5 minutes and a complex set of peaks at ~10 minutes. The chromatographic peaks eluting around 3.5 minutes have ESI-MS measurements of 23434.0 Da, respectively, in full agreement with the calculated mass of the light chain of infliximab (23434.0 Da). The complex peak eluting at ~10 minutes is comprised of several species with MW in the 51,000 Da range, corresponding to the glycosylated heavy chain.
Figure 2 shows the comparison of the light chain spectra in a mirror plot using UNIFI Scientific Information System’s software, with the combined raw MS spectra shown on the left panel (as demonstrated by multiple charged spectrum envelopes) and the MaxEnt 1 deconvoluted spectra displayed on the right.
The results indicate that there is only one isoform and no noticeable difference in the light chains between the innovator and biosimilar samples. This observation is consistent with other IgG1 biosimilar studies9 that show little or no post-translational modifications of LC subunits.
The chromatographic profile of the heavy chains of infliximab was more complicated than that of the light chain. A cluster of peaks is observed around 10 minutes in Figure 1, corresponding to different isoforms of the heavy chains, and they exhibit significantly different chromatographic behavior from that of the light chain. Similarly, as shown by Figure 1 and 3, the heavy chains of infliximab from the two cell lines show quite distinct chromatographic and spectral differences.
The two major chromatographic peaks (at 9.5 min and 10.5 min) from the analysis of reduced innovator infliximab (Figure 1A) come from the heavy chains and appear to have multiple isoforms (Figure 3C). Mass spectrometry analysis of these peaks (Figure 3) shows that variation in both the polypeptide sequence (+/- lysine) and glycosylation contribute to the heterogeneity of the innovator HC.
This is in contrast to the biosimilar sample, which displays a more homogeneous peak at 9.8 minutes (Figure 1B) and fewer mass variants (Figure 3D).
Several major glycoforms (e.g. G0, G0F, G1F, G2F, and Man5) were identified for the innovator heavy chain as shown in Figure 4, demonstrating a high degree of heterogeneity of the innovator infliximab. The biosimilar has three major glycoforms (G0, G0F, and G1F) and no apparent amino acid variations. All of the MS peaks in the deconvoluted spectrum can be automatically identified in UNIFI Scientific Information System’s software based on the mAb’s reported sequence and the suspected PTM, and annotated, as displayed in Figure 4.
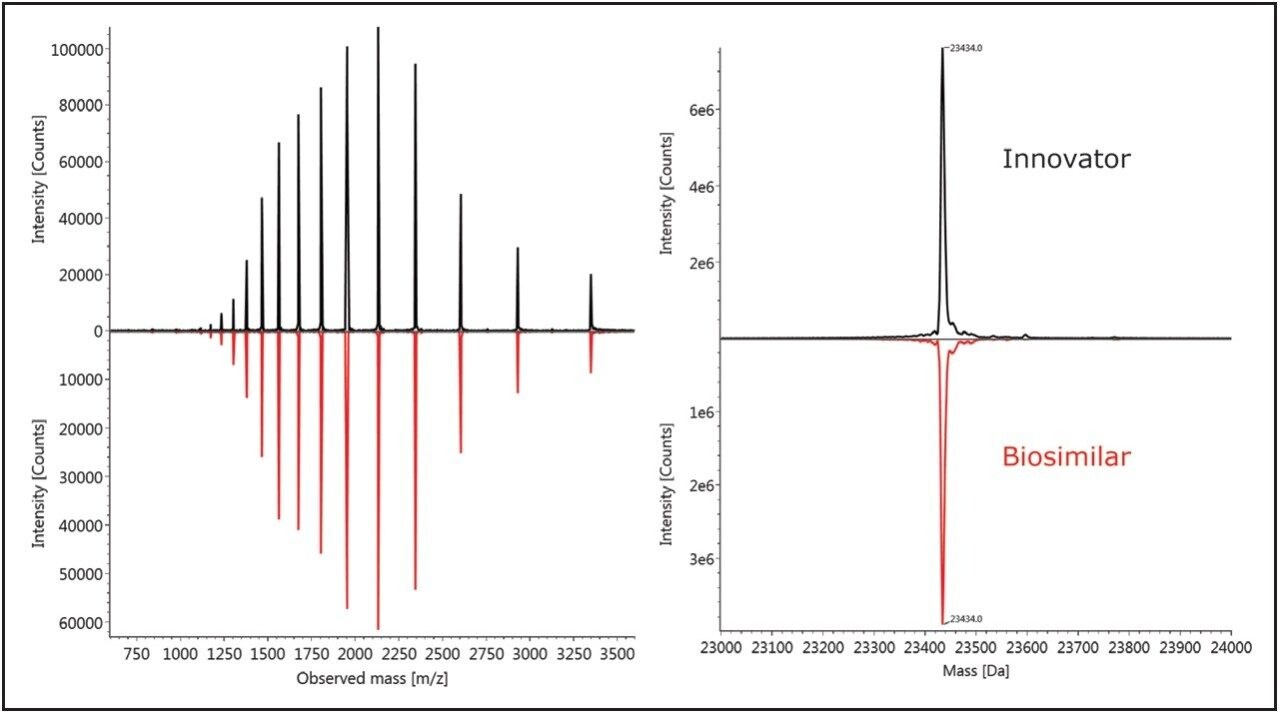
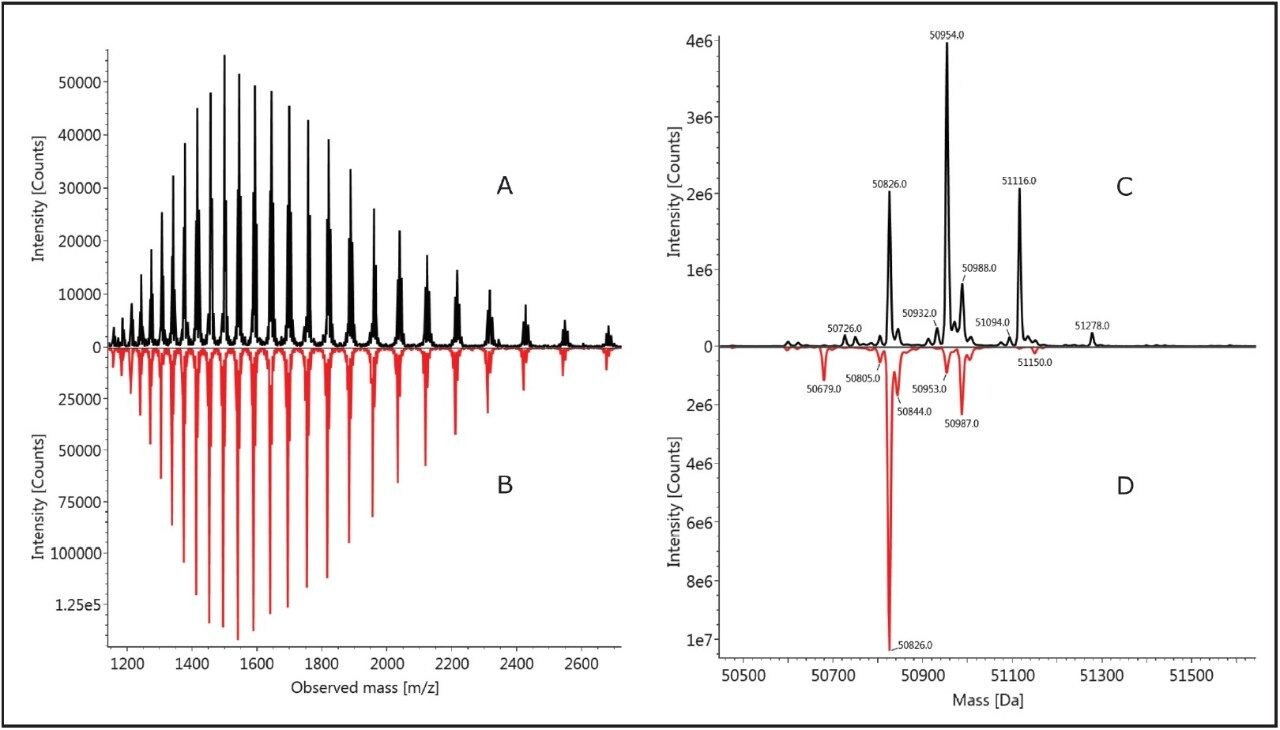
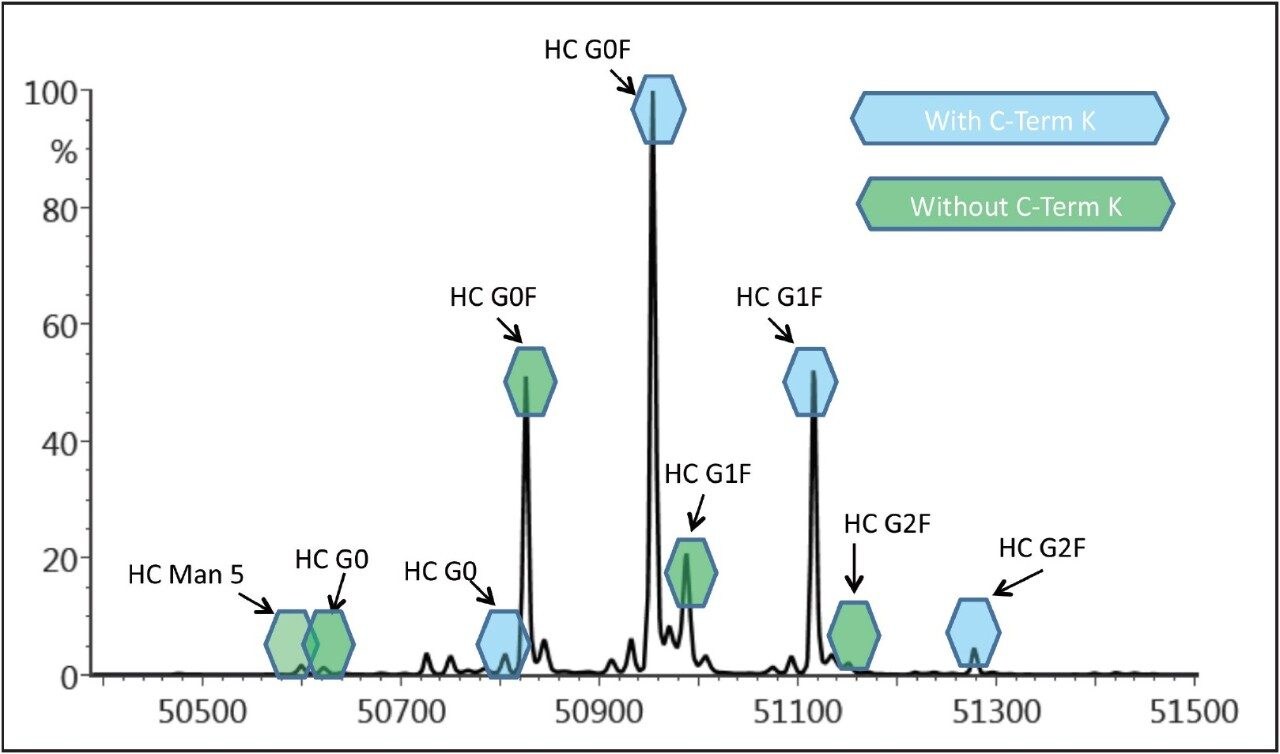
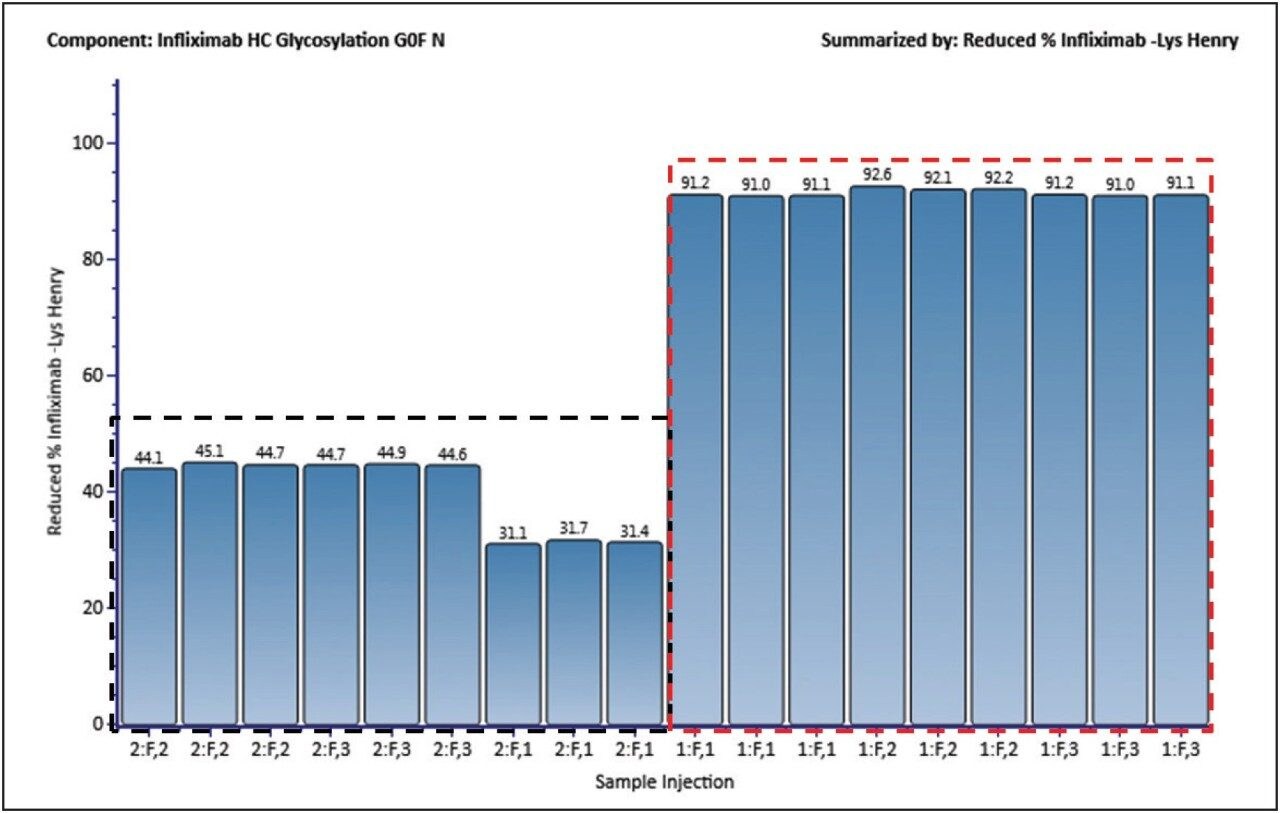
The analysis of reduced IgG is a straightforward, high-sensitivity method that provides valuable information on the identity and amount of related variants of mAb structure. Analysis of the reduced infliximab indicates that its structural heterogeneity resides within the heavy chain of the antibody, and includes variation in both glycosylation and amino acid sequence. The incomplete removal of C-terminal lysine residues is a known structural variant, so it can be surmised that this PTM is occurring in the innovator infliximab.
As demonstrated by the spectra of the HC (Figure 4), the biantennary oligosaccharides G0F, G1F, and G2F, along with smaller amounts of the high mannose forms, are the major glycoforms of infliximab. Since there is only one N-glycosylation site on the HC, the intensity of peaks for the various oligosaccharide structures can be used to quantify the relative abundance of the various glycoforms. The MaxEnt 1 algorithm used for generating the deconvoluted spectra preserves the intensity information from the raw spectra, for quantitative assessment of structural variation.
This measurement establishes a foundation upon which structural comparison for multiple batches of infliximab can be performed, thus making the analysis at the subunit level an attractive approach to establishing development requirements for biosimilars.
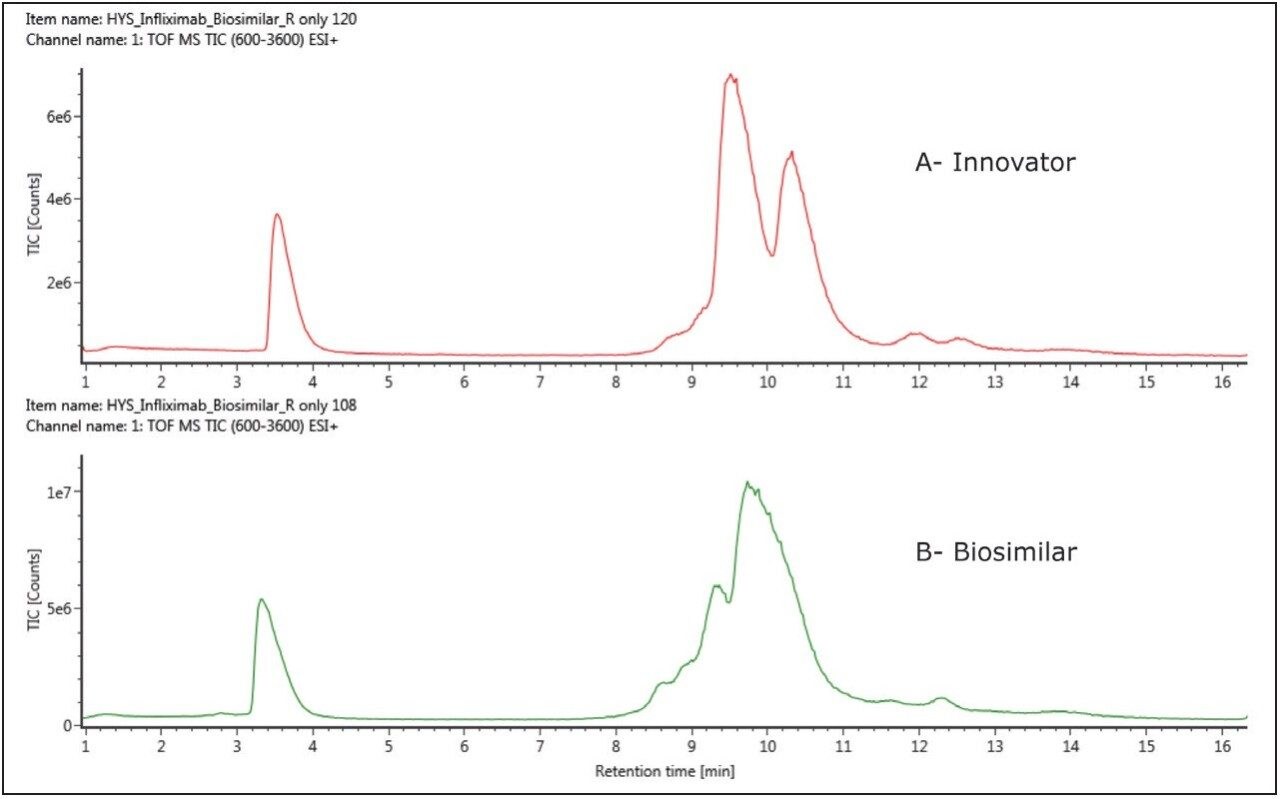
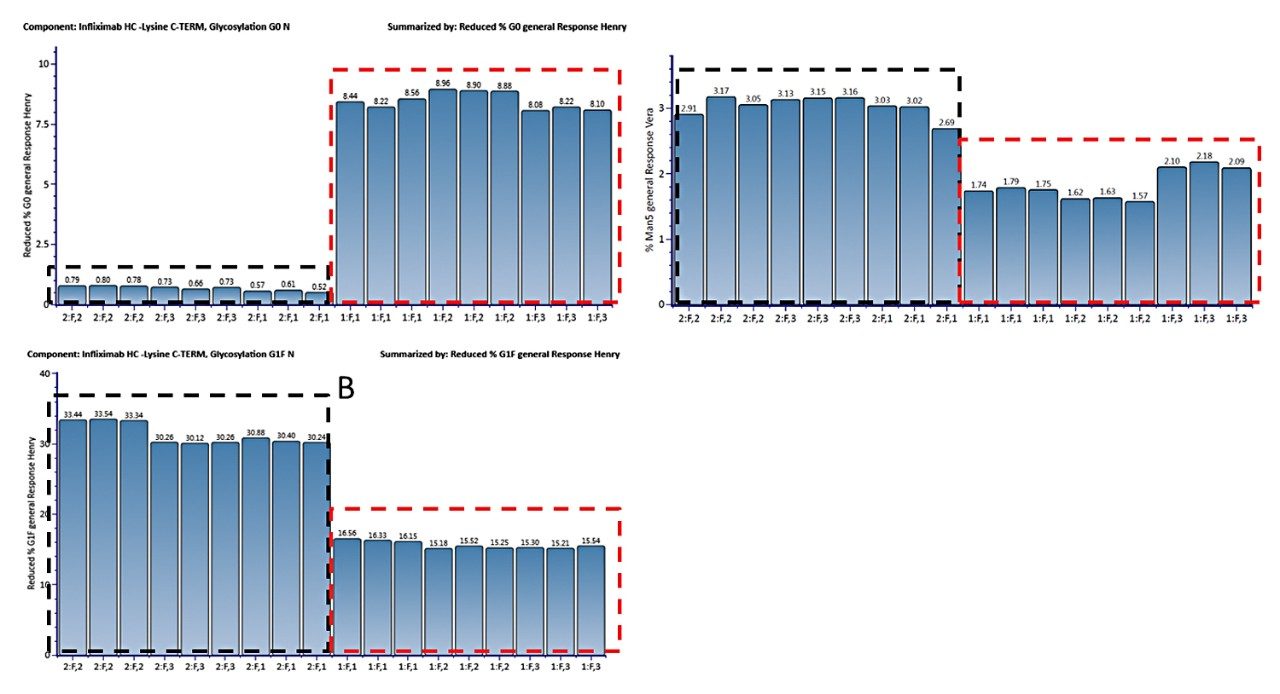
On the basis of the analysis of reduced infliximab subunits, we compared the structure differences among multiple batches of infliximab from the two cell lines. Regulatory guidelines for biosimilar development recommend that any analytical characterization first establish the structural variation range of the reference product. As such, analysis of multiple lots of reference products (infliximab from SP2/0 cells) as well as biosimilar products (infliximab from CHO cells) is necessary to establish the range of values for critical structural features. In the meantime, replicate analysis is also performed for each sample to demonstrate the reproducibility of the LC-MS method itself.
The analysis of multiple samples in triplicate helps establish a vigorous analytical procedure to provide sound analytical support for biosimilar development. However, this approach generates a high volume of data that requires efficient informatics tools to process data and produce meaningful results. The UNIFI Scientific Information System automatically acquires and processes the data and generates reports on the results, demonstrating the great power and flexibility available for such data analysis tasks.
Next, we demonstrate how UNIFI Scientific Information System’s software can be utilized to streamline the structural comparison of reduced infliximab from two cell lines.
Figure 5A displays the MS response summary plot for glycoform G0 in percentage. This UNIFI Scientific Information System plot offers a simple and direct view to demonstrate the variation in relative abundance of the G0 glycoform across the injections of innovator and biosimilar batches. This functionality removes the scientific and compliance burden of summarizing reports of such data in Excel or other data analysis tools that are not core features of the instrument’s software. By including both automated processing statistical reporting within UNIFI, the software also prevents human transcription errors that may require significant time and effort to identify and correct. Similar plots can be readily generated within UNIFI Scientific Information System for other glycoforms identified in the analysis, such as G1F and Man5, as shown in Figure 5B and 5C.
The triplicate analysis for each sample shows a highly reproducible measurement. There is some minor batch-to-batch variability, notably in the abundance of G1F in the innovator (5B) as well as the Man5 content in the biosimilar (5C). On the other hand, it appears that the biosimilar, produced in CHO cells, has approximately 10 times more non-fucosylated G0 glycoform compared to that of the innovator (SP2/0 cell line) product. It is also observed that there are about twice as many G1F glycoforms (by percentage) in the biosimilar batches than in the innovator, and there is about 30% more Man5 glycoform in the innovator batches than in the biosimilar sample batches.
As this example shows, the glycoforms of infliximab from two cell lines can be readily analyzed and information on the glycosylation variation can be quickly obtained via UNIFI Scientific Information System software’s automated workflow covering data acquisition, processing, and reporting. Additionally, the workflow can be deployed in both non-regulated and regulated environments, so a common analytical platform can be employed and consistent information acquired across the entire development process.
Another major source of HC heterogeneity is lysine variants. Depending on the cell line and other production conditions, a lysine residue may remain on the C-terminus of the polypeptide chain. Figure 6 displays the percentage of clipped-lysine variants, automatically calculated in UNIFI Scientific Information System software, for both the innovator and biosimilar batches. As can be seen, the percentage was much smaller for the biosimilar sample batches (from CHO cell line) as compared to that observed in the innovator (SP2/0 cell line) batches. This experimental result confirms that there was a much lower level of C-terminal lysine in antibodies derived from the CHO cell line, and the lysine content is more consistent from batch-to-batch. The innovator infliximab has a lower overall abundance for variants with the complete removal of lysine, and the amount does vary from batch to batch.
In this work, the extent of comparability was established between multiple batches of innovator and candidate biosimilar infliximab, using an integrated analytical platform with capabilities for automated data processing and reporting. The Biopharmaceutical Platform Solution with UNIFI Scientific Information System was applied to study these samples at the level of reduced heavy and light chain subunits, and to report on several biotherapeutic structural differences between these preparations.
Overall, the innovator molecule exhibited more heterogeneity with respect to PTM’s (glycosylation and C-terminal lysine) compared to the candidate biosimilar. Potentially significant differences were found between the innovator and the biosimilar samples, particularly in regard to the presence of fucosylated glycans. We found that the biosimilar had a much higher abundance of the non-fucosylated glycoform G0, and less of the fucosylated G1F, in comparison to the innovator. Some batch-to-batch variability was observed among both the innovator batches and the biosimilar batches.
The power to universally deploy high resolution analytics to address these important questions, combined with the ability to quickly communicate these results, enables organizations to make rapid and confident decisions in the race to market with safe and effective innovator and biosimilar therapeutics.
720004796, January 2016