• Application Note

Quantitative Analysis of Dried Bloodspot 17-Hydroxyprogesterone by ACQUITY UPLC-MS/MS for Clinical Research

Quantitative Analysis of Dried Bloodspot 17-Hydroxyprogesterone by ACQUITY UPLC-MS/MS for Clinical Research

  • Heather A. Brown
  • Claudia Rossi
  • Lisa J. Calton
  • Waters Corporation
  • Department of Biomedical Science, G. d'Annuzio University Foundation

For research use only. Not for use in diagnostic procedures.

Abstract

In this application note a method for the extraction and UPLC-MS/MS analysis of DBS 17-OHP using the ACQUITY UPLC System with the Xevo TQ MS Detector is described.

Benefits

  • Single non-derivatized liquid-liquid extraction
  • Analytical selectivity for 17-hydroxyprogesterone
  • Rapid result with 3.5 minute injection-to-injection time

Introduction

Measurement of 17-hydroxyprogesterone (17-OHP) by immunoassay is prone to analytical interference arising from cross-reactivity of reagent antibodies with structurally-related steroid metabolites.1 The dried bloodspot (DBS) has proved popularity as a sample matrix in the pharmaceutical, life sciences and clinical research arena due to simplicity of sample collection and stability of compounds within this matrix. A method for the extraction and UPLC-MS/MS analysis of DBS 17-OHP using the ACQUITY UPLC System with the Xevo TQ MS Detector (Figure 1) is described. The technique features an extended LC gradient to allow qualitative evaluation of the androstenedione (A4) and cortisol chromatographic peaks.

Experimental

Sample description

Two x 3 mm DBS were agitated for 50 minutes in 200 μL 50 : 50 acetoneacetonitrile plus 20 μL internal standard (95 nmol/L [2H8]-17-OHP in 50 : 50 methanol : water). Extract was transferred to a Waters Maximum Recovery vial, evaporated to dryness and reconstituted in 50 μL of 55 : 45 mixture of mobile phases A and B.

Method conditions

UPLC conditions

System:

ACQUITY UPLC System

Sample preparation plates:

V bottom polypropylene 96-well microtitre plate for extraction eg Nunc Microwell 96-well plate

Sample preparation vials:

TruView LCMS Certified Maximum Recovery Vial (p/n 186005662CV)

Column:

ACQUITY UPLC HSS T3 1.8 μm, 2.1 x 50 mm (p/n 186003538) fitted with ACQUITY HSS T3 VanGuard Pre-column 1.8 μm, 2.1 x 5 mm (p/n 186003976)

Column temp.:

60 °C

Sample temp.:

8 °C

Injection volume:

20 μL (PLNO, load ahead enabled)

Weak wash:

45 % Methanol (aq) 1500 μL

Strong wash:

Equal parts water, methanol, acetonitrile and isopropanol 500 μL

Flow rate:

0.6 mL/min

Mobile phase A:

2 mmol/L ammonium acetate, 0.1 % (v/v) formic acid (aq)

Mobile phase B:

2 mmol/L ammonium acetate, 0.1% (v/v) formic acid in methanol

Gradient:

Binary system: initially 45% mobile phase B increasing linearly to 85% B over 2 min, to 98% B over 0.1 min, holding for 0.4 min before stepping down to 45% B with 1.0 min column re-equilibration

MS conditions

System:

Xevo TQ MS Detector Tuned to unit resolution on MS1 and MS2 (0.7 FWHM)

Detection mode:

Electrospray positive ionization mode

Acquisition mode:

Multiple Reaction Monitoring (see Table 1 for ion transitions)

Capillary voltage:

0.7 kV

Collision energy:

analyte specific (see Table 1)

Cone voltage:

analyte specific (see Table 1)

Source temp.:

120 °C

Desolvation temp.:

500 °C

Inter-channel delay:

0.01 sec

Inter-scan delay:

0.02 sec

Table 1. MS Parameters. Optimize precursor and product ions to 1 decimal place.

Data management

MassLynx v 4.1 incorporating TargetLynx application manager

A function containing one quantifier and internal standard ion transition for both androstenedione and cortisol were added for qualitative evaluation of these compounds, with no adverse effect on 17-OHP detection. MS Function time windows were optimized for instrument duty cycle. Verify chromatogram peak retention time with a single-function MS Method prior to setting time window settings for routine use.

Results and Discussion

Preparation of 9-point in-house DBS calibration series prepared from saline-washed red blood cells resuspended in spiked stripped-serum enabled linear quantification of 17-OHP between 9.9 – 1270.0 nmol/L with coefficient of determination r2 > 0.997 and measurements ≤ 10 % deviation from nominal calibrator values.

Analytical sensitivity was determined from the peak-to-peak signal to noise ratio (SNR) observed in the 17-OHP chromatogram of 6 reference DBS samples with the lowest SNR (mean 0.5 nmol/L 17-OHP, range 0.5 – 2.9 nmol/L, SNR 1.6 – 4.7). The LLOQ was calculated as the concentration of 17-OHP extrapolated to give SNR > 10 and was determined to be 1.6 nmol/L. The LOD taken as the extrapolated concentration with SNR > 3 was 0.5 nmol/L. Descriptive statistical analysis was conducted using Analyse-it in Microsoft Excel for Windows. The mean (95 % Confidence Interval) was 2.7 (2.2 – 3.1) nmol/L (n=22). Chromatograms from this population are shown in Figure 2A alongside a chromatogram from a separate reference population containing higher concentrations of 17-OHP shown in Figure 2B.

Figure 2. Vertical axis-linked extracted ion chromatograms of DBS 17-OHP at 2.69 nmol / L (A) and 511.0 nmol / L (B). 17-OHP peak to peak SNR ratio is 5.97 with area count 579 in the upper panel. Cortisol and androstenedione (A4) peaks are shown for reference

Within- and between-batch imprecision, expressed as coefficient of variation of replicate measurements of independently-prepared quality control DBS at target mean 17-OHP concentrations 76, 151, and 303 nmol/L was < 6.7% CV (between-batch in singlicate over 5 days; within-batch n=5). The between-batch imprecision of the lowest calibrator 9.9 nmol/L was 7.3% CV (singlicate over 5 batches).

An artificial whole blood matrix was prepared for evaluation of extraction efficiency. The negative control blood matrix along with 3 positive controls of blood matrix spiked to 76, 152, and 303 nmol/L 17-OHP were spotted onto Whatman 903 filter paper. The dried residue of the extracted negative pool was resuspended in solvent standards at the maximum expected 17-OHP concentration for each level of the positive control extract, assuming total recovery of the spiked 17-OHP. The mean extraction efficiency of 17-OHP, calculated as the ratio of the peak area of the positive control: negative control post-extraction spiked sample, was 58% (57 – 59%, n = 3).

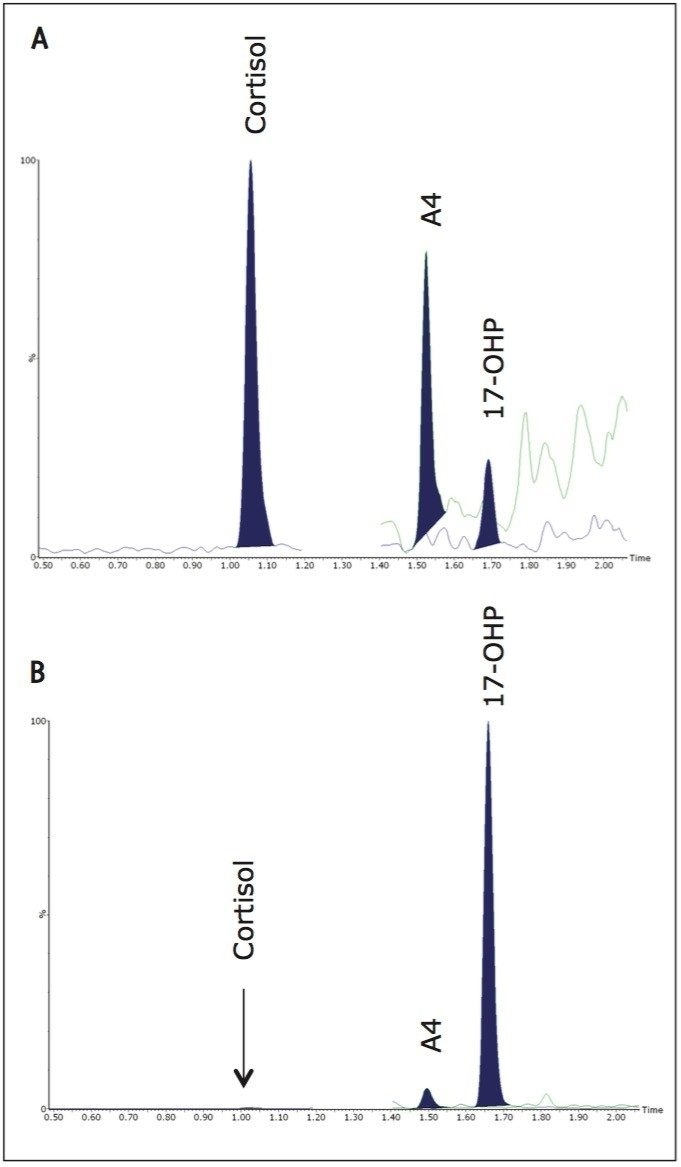
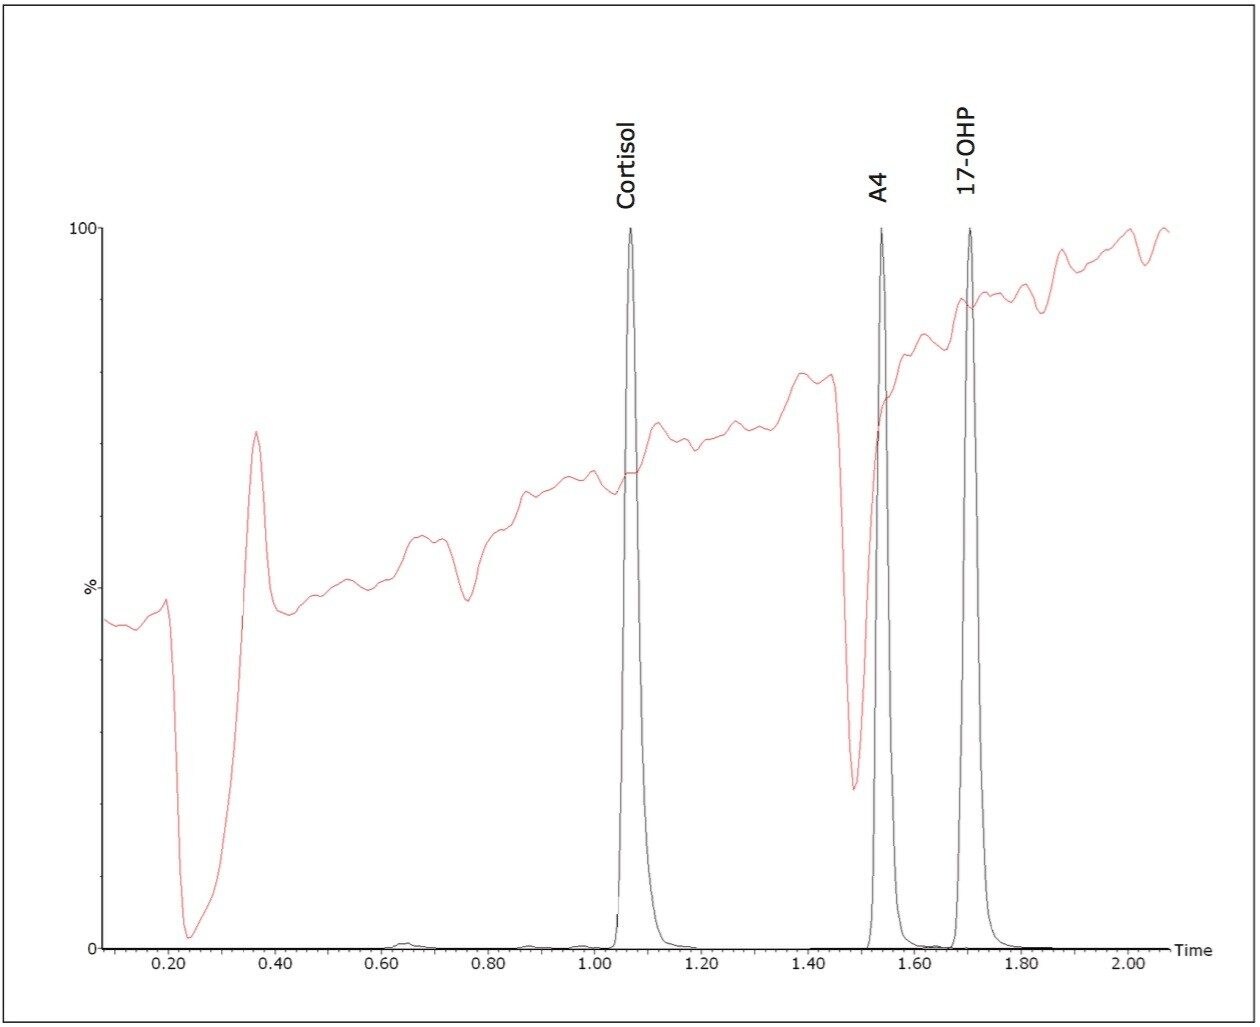
Quantitative matrix effects were assessed, expressed as the proportion of detector response suppressed or enhanced by the presence of matrix. The ratio was calculated of the peak area of post extraction spiked negative pool: peak area of matrix-free solvent standards of equivalent concentration. The mean signal suppression due to matrix was 15% (13 – 16%, n = 3). A qualitative evaluation of signal suppression conducted by post-column infusion of a solvent standard of 17-OHP into the LC flow path of extracted samples confirmed compounds of interest do not elute within regions of signal suppression (Figure 3).

Figure 3. Qualitative evaluation of 17-OHP ionisation suppression from an extracted DBS (red), with solvent standards overlaid for reference (black). Ionisation of cortisol and 17-OHP is not suppressed by residual sample matrix.

Conclusion

The developed LC-MS/MS method enables the rapid measurement of DBS 17-OHP with analytical sensitivity and reproducibility. The simple liquid-liquid extraction technique generated a clean sample extract. This familiar and well-understood sample preparation  technique can be easily adopted into routine use in a clinical research laboratory.

References

  1. Wong T et al. Identification of the steroids in neonatal plasma that interfere with 17α-hydroxy-progesterone radioimmunoassays. Clin  Chem 1992;38:1830 –1837.

720004971, March 2014

Back To Top Back To Top