For research use only. Not for use in diagnostic procedures.
This application note demonstrates the use of LC-MS/MS for analysis of metanephrines in clinical research to addresses the shortcomings of traditional methods such as immunoassay and HPLC with electrochemical detection.
Analysis of plasma metanephrines is typically performed by HPLC with electrochemical detection1 (ECD) methods which are usually labor intensive and can result in relatively low analytical specificity. Extended chromatography and time consuming sample preparation are usually needed to resolve interferences, impacting turnaround times. Relatively few automated immunoassay methods are available for plasma metanephrines, and many of the commercial methods also suffer from interference and poor analytical specificity.
The polar nature and low concentration of metanephrines in plasma pose both extraction and chromatographic separation challenges. A recent publication describes an online automated weak cationic exchanger (WCX) solid phase extraction (SPE) with hydrophilic interaction (HILIC) HPLC and analytically selective and sensitive MS detection.2
Here we present the further development of this method to allow automated offline SPE using Oasis WCX µElution plates utilising a Tecan liquid handling system (LHS). The extracted plate is placed onto the ACQUITY Sample Manager and is ready for analysis using ACQUITY UPLC BEH Amide Column chemistry coupled to a Xevo TQ MS Detector. Measurement of plasma metanephrine (M) and normetanephrine (NM) provides the opportunity to perform clinical research into the pathogenesis of disease states associated with catecholamine excess.
Column: |
ACQUITY UPLC BEH Amide 1.7 μm , 2.1 x 50 mm (p/n 186004800) |
Column temp.: |
35 °C |
Sample temp.: |
4 °C |
Injection volume: |
20 μL (PLNO) |
Weak needle wash: |
Acetonitrile |
Strong needle wash: |
Water |
Flow rate: |
200 μL/min |
Mobile phase A: |
100 mM ammonium formate, pH 3.0 with formic acid (aq) |
Mobile phase B: |
Acetonitrile |
Gradient: |
2 to 35% linear gradient of Mobile Phase A over 3 minutes; 1 minute hold then step gradient to initial conditions with 1 minute re-equilibration |
Run time: |
5 min |
Instrument tuned to unit resolution on MS1 and MS2 (0.7 FWHM) |
|
System: |
Xevo TQ MS Detector |
Acquisition mode: |
Multiple Reaction Monitoring (MRM) – see Table 2 for ion transitions |
Ionization mode: |
ESI positive |
Capillary voltage: |
0.6 kV |
Dwell time: |
0.04 sec |
Interscan and inter channel delay 0.01 sec Source temp.: |
150 °C |
Desolvation temp.: |
600 °C |
Data management: |
MassLynx v4.1 SCN 810 with TargetLynx application manager. |
Calibrators were prepared fresh for each analysis using stripped serum spiked with solvent stocks from independently weighed solid HCl salts of metanephrine (M) and normetanephrine (NM) (Sigma-Aldrich, Dorset, UK). Quantification followed blank-correction for endogenous metanephrines.
A working solution of 2H3 M, and 2H3 NM internal standard (IsoSciences, King of Prussia, PA, USA) was prepared daily by 500-fold dilution of an acidified stock into LC-MS grade water.
Samples, calibrators, and quality control materials were centrifuged at a minimum of 10,000 g to remove clots and debris. Minimum of 250 µL was transferred to barcode-labelled tubes and placed on the Tecan Freedom EVO 100 liquid handling system (LHS). All SPE solvents, calibrators and working internal standards, Oasis WCX µElution (p/n 186002499), mixing and collection plates (p/n 186002482 and 186002481) were positioned onto the LHS.
LHS-automated steps:
Utilizing the load-ahead feature, an injection-to-injection time of approximately 5.5 min was achieved.
Prepare samples, reagents and mobile phases |
t = 0 mins |
Tecan LHS mixes samples and internal standards |
t = 20 mins |
μElution plate conditioned and equilibrated |
t = 28 mins |
Samples loaded and washed on μElution plate |
t = 78 mins |
Samples eluted from μElution plate |
t = 90 mins |
Samples analysed by LC-MS/MS |
t = 340 mins |
Table 1. Typical workflow for the analysis of 45 samples.
Two blank injections were performed to allow thorough column equilibration before running sample lists. Careful attention was paid to positioning and priming of ACQUITY UPLC lines to maintain HILIC chromatography conditions.
The limit of detection (LOD) and LLOQ were interpolated from mean peak to peak signal to noise ratios (S:N) from extracted ion chromatograms of 10 samples with the lowest signal to noise ratio analysed for method comparison. The calculated LLOQ S:N >10 were 45 and 127 pmol/L for M and NM, respectively. The LOD was calculated at S:N > 5, therefore, these values were half the LLOQ. Example extracted ion chromatograms in low concentration extracted plasma samples are shown in Figure 2.
Within- and between-batch imprecision determined by replicate extraction and analysis over 5 days of a human plasma base pool spiked to 3 concentrations revealed mean within batch imprecision of <7.6 and <5.6 % coefficient of variation (CV) for M and NM, respectively. The same data reveals the mean between batch CV as <7.5 and <12.8 % for M and NM, respectively.
Linearity of detector response up to 24.55 nmol/L was demonstrated with the 8-point calibration curve showing a coefficient of determination >0.995 and <15 % deviation from nominal concentrations. Additionally, linearity of detector response upon extraction of an 8 nmol/L spiked sample, sequentially diluted with stripped serum, was shown.
Mean Oasis WCX µElution plate SPE efficiency was calculated as the peak area ratio of pre- to post-extraction spiked plasma (n=3) was 97 and 95 % for M and NM, respectively. Matrix effects were evaluated from the peak area of the post-extraction spiked samples (n=6) taken as a percentage of extraction solvent spiked to equivalent concentrations. Mean (range) matrix effects were 16.4 (1.8 % to 35.0) % ion enhancement for M and 8.7 (3.6 % suppression to 19.4) % enhancement for NM. Calculations using analyte: internal standard peak area response indicated matrix effect compensation by the internal standard with a mean net matrix effect (range) of 4.0 (0.5 to 6.0) % enhancement for M and 0.3 (3.3 % suppression to 7.5) % enhancement for NM.
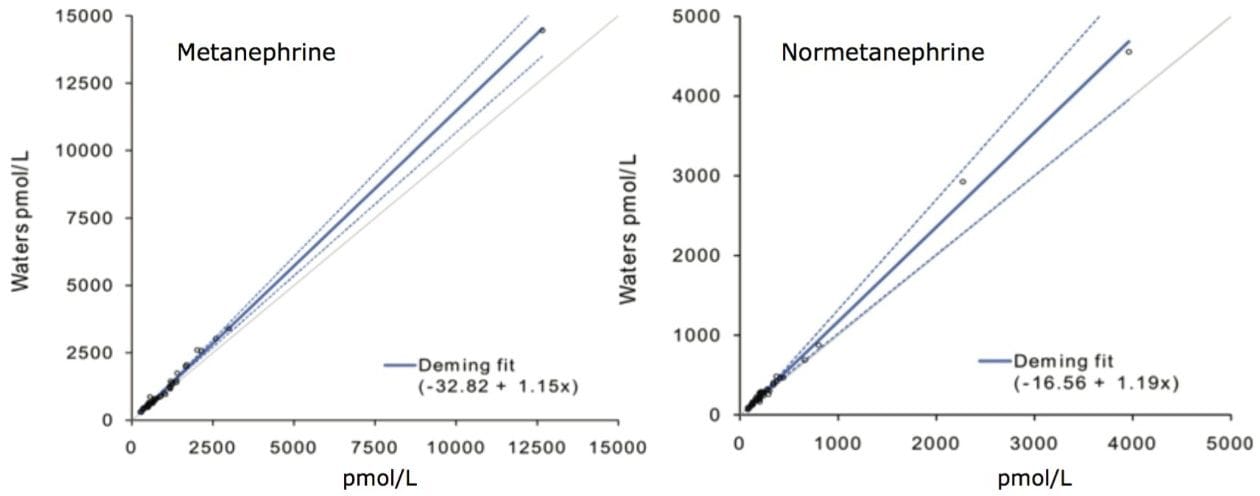
Comparison was made using 50 plasma reference samples analysed by an online SPE LC-MS/MS method.2 Deming regression conducted with Analyse-it for Microsoft Excel for Windows 2003 showed neither significant proportional nor constant bias across the measured range of 87–4455 pmol/L for M (p>0.05). Proportional bias of 15 % was found across the measured range of NM 300–14459 pmol/L (p<0.02), however, this became insignificant when limiting the comparison to below the upper limit of the reference sample interval (<1070 pmol/L; p=0.48).
Solvent standards of potential endogeneous and exogeneous isobaric interferents were injected and chromatograms were interrogated for peak and baseline interferences. Epinephrine, norepinephrine and dopamine contributed to a high baseline signal in the NM MRM. MS1 scans showed abundant NM precursor m/z 166 in the source. MS2 scans of potentially interfering substances under M and NM-optimised conditions indicated low levels of product ions which may pose isobaric interference with the NM 166>134 MRM transition when operating at very low resolution. For this reason, operation of MS2 at unit resolution or higher (FWHM ≤0.7) is recommended.
The use of LC-MS/MS for analysis of metanephrines in clinical research addresses the shortcomings of traditional methods such as immunoassay and HPLC with electrochemical detection. Analytically sensitive and selective quantification of low concentrations of metanephrines in plasma is possible by coupling automated SPE and ACQUITY UPLC separation with MRM analysis using the Xevo TQ MS Detector. Eluates from the Oasis WCX µElution Plate are directly compatible with the LC-MS/MS system, negating sample evaporation and reconstitution required with strong cationic exchangers.3 Simplified processing of large numbers of samples is possible with reduced risk of preparative errors by taking advantage of the Tecan LHS.
Bob Peaston, Erin Chambers and Kendon Graham are thanked for helpful discussions regarding the development of the SPE extraction and LC method.
720004822, February 2014