• Application Note

Traditional Herbal Medicine Structural Elucidation using SYNAPT HDMS with Time-Aligned Parallel (TAP) Fragmentation

Traditional Herbal Medicine Structural Elucidation using SYNAPT HDMS with Time-Aligned Parallel (TAP) Fragmentation

  • Kate Yu
  • Jose M. Castro-Perez
  • John P. Shockcor
  • Waters Corporation

Abstract

In this application note, we demonstrate a strategy that provides an effective means of confirming known components and elucidating structures of unknown components. The strategy reported here comprises of an initial sample screening using the Waters ACQUITY UPLC System with the SYNAPT HDMS System in full-scan IMS mode.

Introduction

The challenges in analyzing Traditional Herbal Medicine (THM) or Traditional Chinese Medicine (TCM) samples arise from the complexity of the matrix as well as variability from sample to sample. We have reported a generic intelligent work flow1-2 that allows fast sample analysis while obtaining maximum information by effectively utilizing UPLC-HDMS analysis in time-of-flight (TOF) mode with a variety of advanced profiling software tools (MetaboLynx and MarkerLynx Application Managers).

In this application note, we demonstrate a strategy that provides an effective means of confirming known components and elucidating structures of unknown components.

Ion mobility mass spectrometry (IMS) allows the separation of ionic species as they drift through a gas phase under the influence of an electric field. The rate of an ion’s drift depends on the mass of the ion, the charge state of the ion, as well as the average collisional cross-section of the ion. With IMS, it is possible to separate ions with the same nominal mass if they have different charge states or different collisional cross-sections.

The strategy reported here comprises of an initial sample screening using the Waters ACQUITY UPLC System with the SYNAPT HDMS System in full-scan IMS mode. Once a compound or class of compounds are identified, a targeted fraction collection is performed in analytical scale and the fraction collected can be infused into the mass spectrometer at a nano-scale flow rate so that structural elucidation can be performed for the compound of interest. The nano-scale flow rate allows infusion to be carried out over an extended time period, making it possible to conduct multiple MS/MS experiments, including time-aligned parallel (TAP) fragmentation experiments.

TAP, which is CID-IMS-CID, allows users to take the advantage of the Triwave(tm) configuration on the SYNAPT HDMS (Figure 1). This configuration allows pre-IMS T-Wave and post-IMS T-Wave to operate as two separate collision cells.

Schematic of the SYNAPT HDMS System’s Triwave design.
Figure 1. Schematic of the SYNAPT HDMS System’s Triwave design.

The fragment ions produced in the Trap T-Wave (pre-IMS) can be separated based on their charge states and sizes as they move through the IMS cell. Ions separated by drift time can be fragmented further in the Transfer T-Wave (post-IMS). As a result, the fragment ions generated in the Transfer T-Wave are drift time-aligned with their respective precursor ions, resulting in Time Aligned Parallel (TAP) fragmentation patterns. When these fragmentation results are combined with tools such as MassFragment Software, structural elucidation for small molecule is simplified.

Here, a Chinese Ginseng extract was analyzed by utilizing the ACQUITY UPLC/SYNAPT HDMS systems operating in IMS mode. Fraction collection was performed using a TriVersa NanoMate (Advion). The fractions collected were directly infused into the SYNAPT HDMS for analysis, providing more in-depth information about the compounds of interest. The example analyte discussed in this application note is the Ginsenoside Rb1.

Experimental

A Chinese Ginseng extract was used for this work. The sample was filtered prior to injection. A chip-based nano-electrospray device (TriVersa NanoMate, Advion) was used as the mass spectrometer interface.

LC conditions

LC system:

Waters ACQUITY UPLC System

Column:

ACQUITY UPLC HSS T3 Column 2.1 x 100 mm, 1.7 μm, 65 °C

Flow rate:

600 μL/min

Mobile phase A:

Water + 0.1% Formic Acid

Mobile phase B:

MeOH

Gradient:

Time

Composition

Curve

0 min.

95%A

-

10 min.

30%A

Curve 6

17 min.

0%A

Curve 6

20 min.

95%A

Curve 1

Fraction collection (FC) conditions

FC system:

Advion TriVersa NanoMate

Flow split:

300 nL/min flow to the MS and the rest of the flow to the waste or the collection plate when triggered

Collection plate:

96-well plate

Collection time:

7 sec per well

Trigger:

Time-based

MS conditions

MS system:

Waters SYNAPT HDMS System

Ionization mode:

ESI Negative

Capillary voltage:

3000 V

Cone voltage:

35 V

Desolvation temp:

450 °C

Desolvation gas:

800 L/Hr

Source temp:

120 °C

Acquisition range:

50 to 1500 m/z

Collision gas:

Argon

IMS carrier gas:

Helium

He gas flow:

80 L/min

Results and Discussion

For THM studies, it is typically desirable to have the compound of interest physically separated from the raw extract so that it can be analyzed in detail and to enhance structural elucidation. Even though preparative-scale chromatography is a common practice for fraction collection in the THM field, it is often desirable to determine a component’s structure prior to rigorous isolation of a pure compound in preparative scale.

In this work, we have connected the ACQUITY UPLC/SYNAPT HDMS systems with a TriVersa NanoMate3-4 such that fraction collection can be performed in the analytical scale. For this sample analysis, we have set the NanoMate for the collection of the major peak at m/z 1107, which corresponds to the Ginsenoside Rb1.

The NanoMate utilizes a chip-based nano-electrospray as the LC-MS interface.3 This allows samples to be analyzed in the nL/min flow range. As a result, fractions collected can be analyzed by direct infusion. The low flow rate allows small volume of sample to be infused for a considerable amount of time (about 30 to 40 minutes) such that compounds at low concentration levels can be analyzed utilizing various full-scan MS, and MS/MS acquisition modes including TAP (Figure 2).

TAP fragmentation
Figure 2. TAP fragmentation for m/z 1077 by direct infusion of fraction collected for the 10.02 minute peak.

The chemical structure and the possible major fragment ions for the Ginsenoside Rb1 are shown in Figure 3. The fragmentation is described left to right. As Ginsenoside Rb1 losses the sugar moiety in sequence, it generates fragment ions corresponding to m/z 945, m/z 783, and m/z 621. The m/z 459 is from the core ring structure of Rb1.

Chemical structure for Ginsenoside Rb1.
Figure 3. Chemical structure for Ginsenoside Rb1.

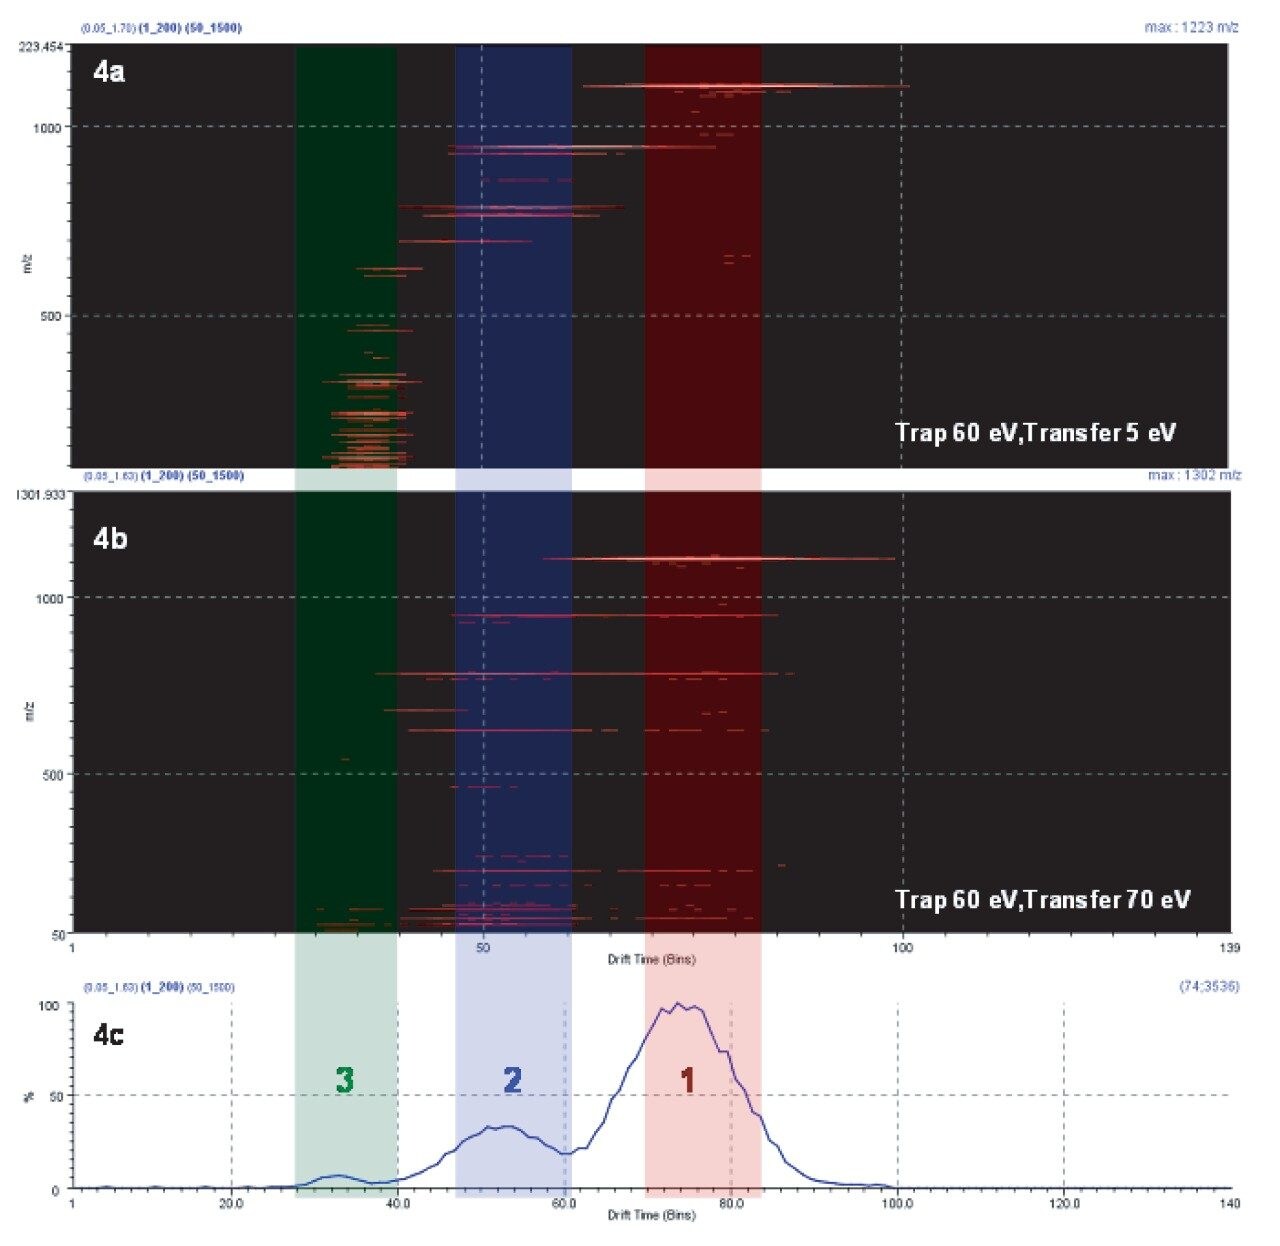
To demonstrate the TAP behavior, Figure 4 shows a DriftScope Plot comparison from two separate experiments. In Figure 4a, fragmentation was conducted in the T-Wave Trap region only. The fragment ions with a different numbers of sugar moieties migrated through the drift tube at different rates.

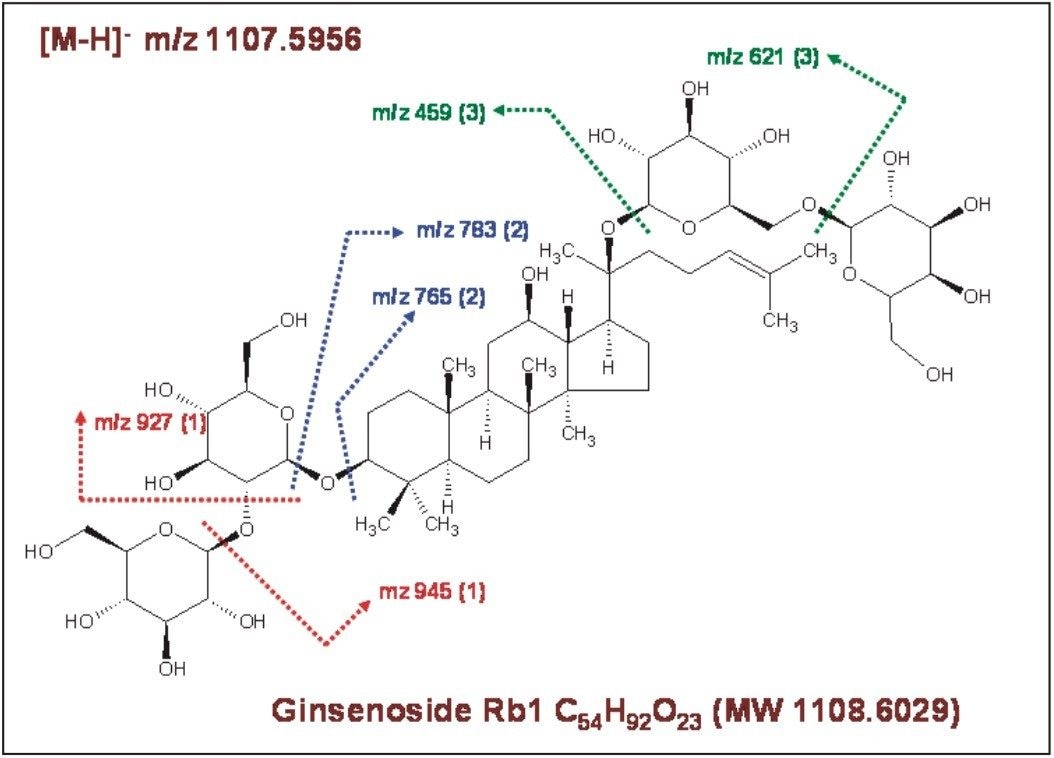
Drift time 1 in Figure 4a shows mainly the deprotonated molecule and the major fragment ion at m/z 945, which is the loss of one sugar moiety. Major ions in drift time 2 are m/z 945 and m/z 783 (loss of two sugar moieties). And drift time 3 mainly contains fragment ions generated from the sugars and from the fragmentation of core structures rings.

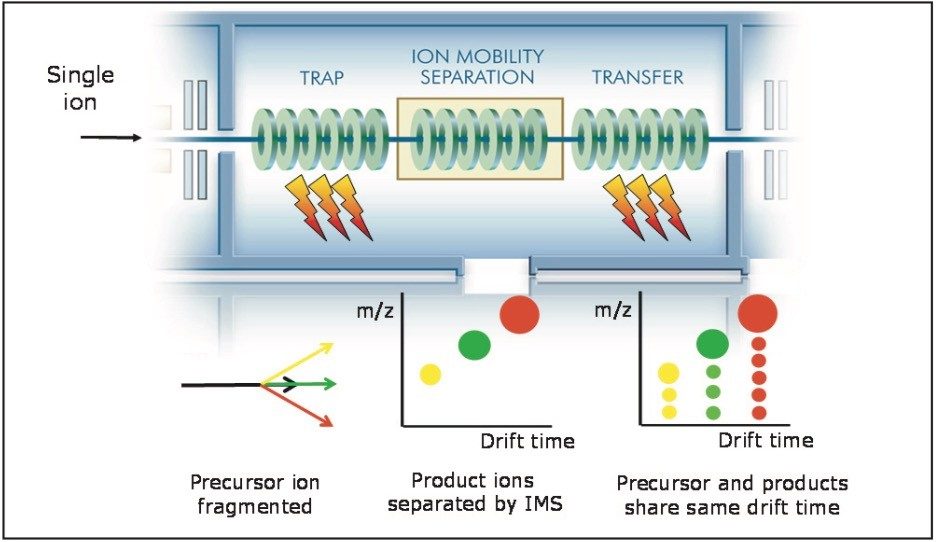
Figure 4b shows the TAP fragmentation data. At each drift time region, the precursor ions or first-generation ions were further fragmented, producing second-generation fragment ions. These ions are drift time aligned with the first-generation product ions and obtained in parallel. This produces a fragmentation tree that allows the user to account for the source of the second-generation fragments within the proposed structure. The true advantage of this experiment is that the entire second-generation fragment ions can be generated on the fly, i.e., in parallel with the generation of the first-generation product ions.

Typically a single ion-mobility experiment is carried out every 10 milliseconds. For nanoflow-scale infusion, it is possible to average many spectra across the infusion experiment to obtain a good signal-to-noise. Moreover, this approach allows the user to conduct multiple stages of fragmentation for compounds of interest that may exist in extremely low levels.

Figure 5 shows a combined TAP spectrum of the three regions that correlates to Figure 4b. Figure 6 shows the individual MS spectrum for each region (1, 2 and 3) with a few of the proposed structures shown therein. This provides valuable information for the study of the fragmentation mechanisms. For example, it should be noted that the fragment ion at m/z 323, which consists two sugars, is observed in drift times 1 and 2, but not 3. This indicates that the precursor ions for region 3 do not have the di-sugar side chain.

720002542en-f4
720002542en-f4

Conclusion

UPLC-HDMS and analytical-scale fraction collection combined with TAP fragmentation is complementary to the UPLC-TOF MS workflow. As a result, Traditional Herbal Medicine (THM) samples can be analyzed with high resolution, high sensitivity and fast turnaround time.

This technique enhances the user’s ability to perform structural elucidation for individual components from a complex matrix. TAP fragmentation, used in combination with the MassFragment structure elucidation software tool, provides a fast and accurate approach to solving complex elucidation problems.

References

  1. An Intelligent Workflow for Traditional Herbal Medicine Compound Identification by UPLC/TOF-MS. Yu K, Castro-Perez J, Shockor J. Waters Application Note. 2008; 720002486EN.
  2. A Multivariate Statistical Approach using UPLC/TOF-MS for Traditional Herbal Medicine Analysis to Compare Different Sample Classes. Yu K, Castro-Perez J, Shockor J. Waters Application Note. 2008; 720002541EN.
  3. Automated Nanofluidic System for Real-Time Monitoring of Enzymatic Assay. Corso R, Almeida R, et al., ASMS 2007 Poster.
  4. Optimized Trap and Elute Strategies Using nano-LC-MS/MS for the Identification of Sypro Ruby Stained Proteins Separated by 2-Dimensional Gel Electrophoresis. Prosser S, Eilel D, et al. ASMS 2007 Poster.

Featured Products

720002542, March 2008

Back To Top Back To Top