Simplifying the Analysis of PFAS in Aqueous Samples for EPA Method 1633 by Reducing Sample Volume
Kari Organtini, Ken Rosnack, Oliver Burt
Waters Corporation, United States
Published on July 14, 2025
Abstract
US EPA Method 1633 is a multi-lab validated method for the analysis of 40 per- and polyfluoroalkyl substances (PFAS) in a variety of environmental matrices. The method was validated using 500 mL aqueous sample volumes leading to a lengthy sample preparation process. Sample preparation time was reduced by half, to approximately one hour per batch, using a 50 mL sample volume. Although a significantly smaller sample volume was used, high sensitivity was still achieved and all the recovery requirements for EPA 1633 were met. A variety of complex environmental water samples were prepared using this reduced sample volume and analysis was performed using the Waters™ PFAS workflow for LC-MS/MS.
Benefits
- Reduced sample volume extraction of environmental water samples while maintaining performance criteria of EPA 1633 and the ability to detect trace levels of PFAS in samples, allowing flexibility for the lab
- Performance of the reduced volume workflow is demonstrated by easily passing qualifications of a Waters ERA™ certified reference material, demonstrating equivalent results to other standard sample volumes
- Sample preparation time reduced in half from 250 mL automated time of two hours to about an hour per batch, thereby minimizing overall time to process samples
- Field collection of lower sample volumes benefits overall sample transportation and storage costs
- Easier sample preparation using solid phase extraction (SPE) automation and lower chance of SPE cartridge clogging when loading smaller volumes of challenging aqueous matrices
Introduction
US EPA Method 1633A is a multi-lab validated method for the analysis of non-potable water matrices, soils, biosolids, and tissues.1 The method covers 40 PFAS and, for aqueous matrices, utilizes a sample preparation incorporating SPE on a weak anion exchange (WAX) cartridge followed by graphitized carbon black (GCB) clean-up. The method was multi-laboratory validated using 500 mL sample sizes, which leads to a lengthy sample preparation process that can be difficult to complete with challenging sample types. In previous work, a 250 mL aqueous sample size was introduced,2 followed by the full automation of the SPE.3 By utilizing the fully automated SPE system and 250 mL sample sizes, sample preparation time was reduced to approximately 2 hours for a batch of 8 samples. In both studies, the Xevo™ TQ Absolute Mass Spectrometer was used for the analysis of samples after sample preparation and was able to reach limits of quantification (LOQs) 10x lower than the LOQs reported in the EPA 1633A method. This allows for further reduction in sample volume, offering additional advantages to routine laboratories. These benefits include reduced costs with collection and transportation of field samples, along with less burden some sample storage requirements. Additionally, a smaller sample size results in faster SPE sample preparation, allowing for higher sample throughput and faster turnaround time for customers. Finally, a reduction in sample volume also enables easier sample handling and fewer problems with SPE cartridge clogging when working with challenging samples. The data presented also indicates that a smaller sample size can increase overall recovery and, therefore, higher sensitivity is possible for previously problematic PFAS in the more challenging aqueous sample types. The entire sample preparation of 50 mL aqueous samples was completed using a fully automated SPE workflow in approximately one hour and was then analyzed using an 11-minute method on an ACQUITY™ Premier System with Binary Solvent Management and Flow Through Needle coupled with a Xevo TQ Absolute Mass Spectrometer.
Experimental
Sample Preparation
Samples discussed in this application note include surface water that was collected locally, as well as influent and effluent wastewater that were kindly provided by a municipal wastewater treatment facility in the Midwest United States. Influent wastewater samples were sampled only after the primary settling phase, prior to any further treatment. Effluent wastewater samples were fully treated samples ready for discharge. These samples are from the same sources studied in a previous application note that performed EPA 1633 extractions using manual and automated techniques with 250 mL of sample.2 All water samples were collected using grab sampling directly into 50 mL polypropylene centrifuge tubes and were not sub-sampled. Samples were frozen until sample analysis according to EPA 1633 guidelines and holding times. Sample bottles were weighed prior to sample preparation (full) and after sample preparation (empty) to determine the exact volume collected in each bottle. In addition to authentic samples, the Waters ERA PFAS in Wastewater (Item No. 404) certified reference material (CRM) was processed with the samples. The preparation instructions for the CRM were reduced 10x to create a 50 mL sample instead of the recommended 500 mL sample.
The Oasis™ WAX/GCB Cartridge, a bilayer dual-phase SPE cartridge containing both WAX and GCB sorbents was used for sample preparation of all samples. The addition of GCB into the SPE cartridge allows for the full sample extraction and sample clean-up required by EPA 1633 to be automated, rather than having to perform the GCB clean-up step using a dispersive technique.
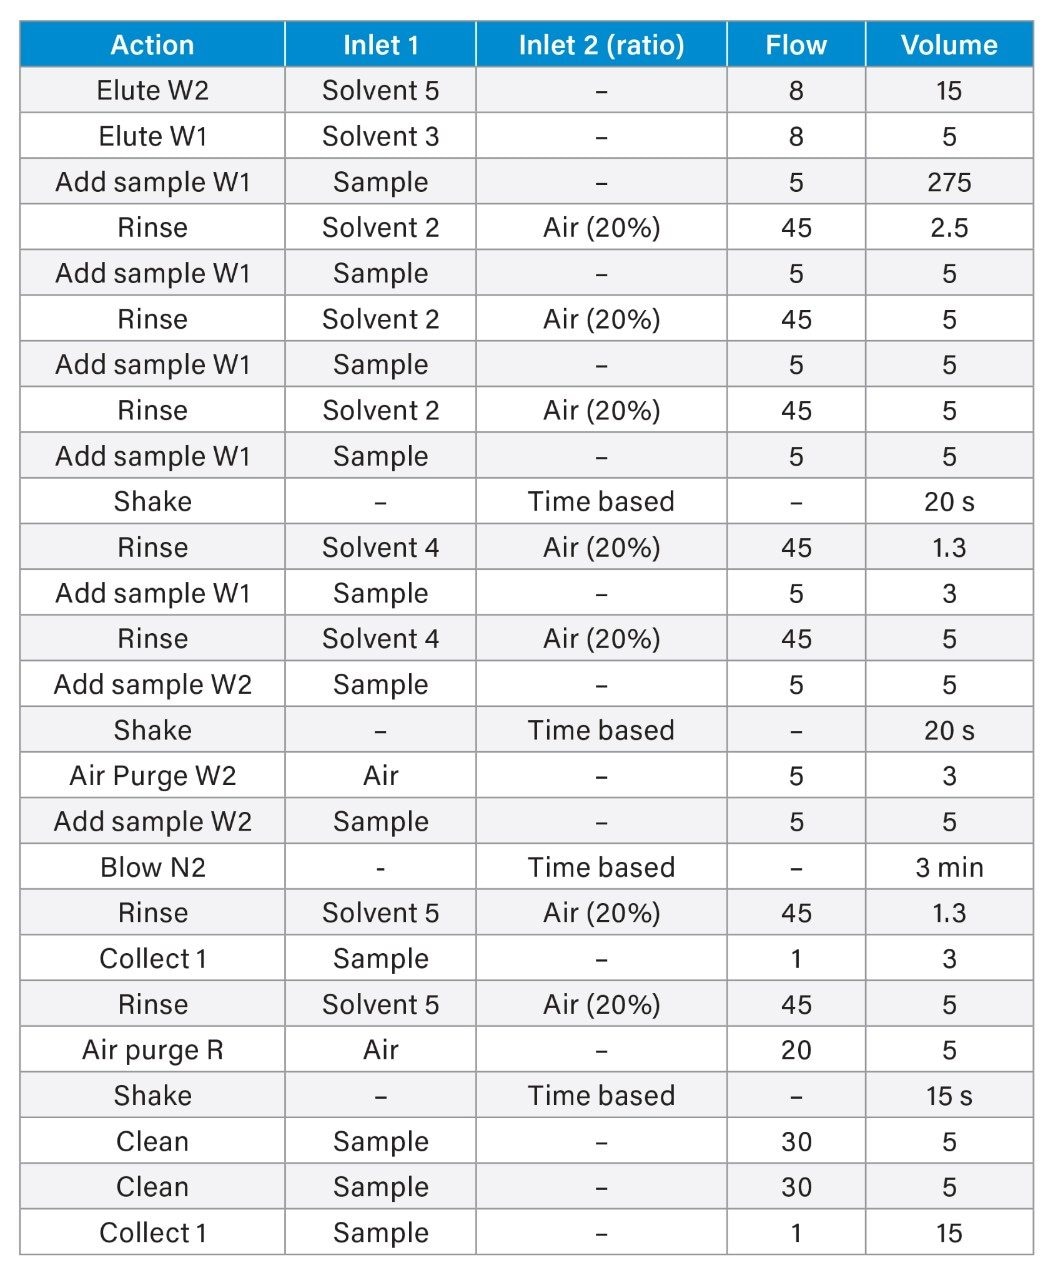
Sample extraction was performed using the PromoChrom (Richmond, BC, Canada) SPE-03 Gen 4 Automated SPE System. The method used to control the automated SPE system is detailed in Table 1 and was directly adapted from EPA 1633. A sample volume of 50 mL was extracted. High-capacity inline filters and anti-clogging tips for the PromoChrom MOD-004 caps were used on the sample inlet lines to filter out particulates before introduction to the SPE system. For the wastewater samples, which contained a substantial amount of suspended solids and particulates, glass wool was also packed to half-height of the SPE cartridge to prevent cartridge clogging.
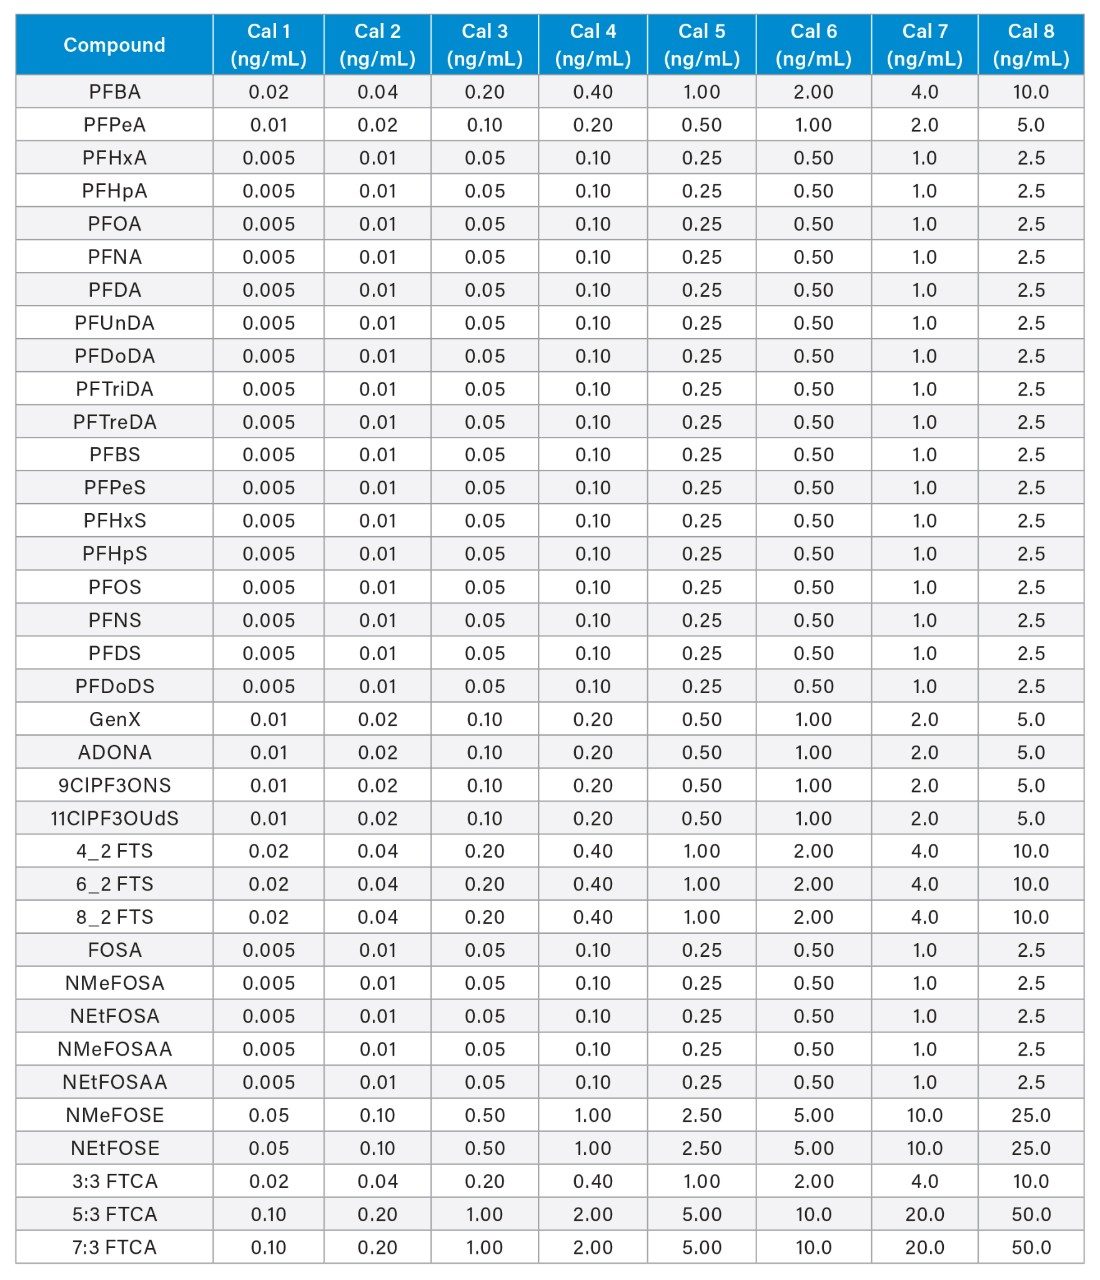
All samples were spiked with 25 ng/L (sample concentration equivalent) of the required extracted internal standard (EIS) prior to extraction and 25 ng/L (sample concentration equivalent) of the required non-extracted internal standard (NIS) after extraction. The calibration curve range for each analyte is listed in Appendix Table 2. All standards were obtained as mixes from Wellington Laboratories (Guelph, Ontario, Canada).
Method Conditions
LC Conditions
|
LC system: |
ACQUITY Premier System with Binary Solvent Management and Flow Through Needle |
|
Vials: |
700 µL Polypropylene Screw Cap Vials (p/n: 186005219) |
|
Analytical column: |
ACQUITY Premier BEH™ C18 Column 2.1 x 50 mm, 1.7 µm (p/n: 186009452) |
|
Isolator column: |
Atlantis™ Premier BEH C18 AX Column 2.1 x 50 mm, 5.0 µm (p/n: 186009407) |
|
Column temperature: |
35 °C |
|
Sample temperature: |
10 °C |
|
PFAS kit: |
PFAS Install Kit (p/n: 176004548) |
|
Injection volume: |
10 µL |
|
Flow rate: |
0.3 mL/min |
|
Mobile phase A: |
2 mM ammonium acetate in water |
|
Mobile phase B: |
2 mM ammonium acetate in acetonitrile |
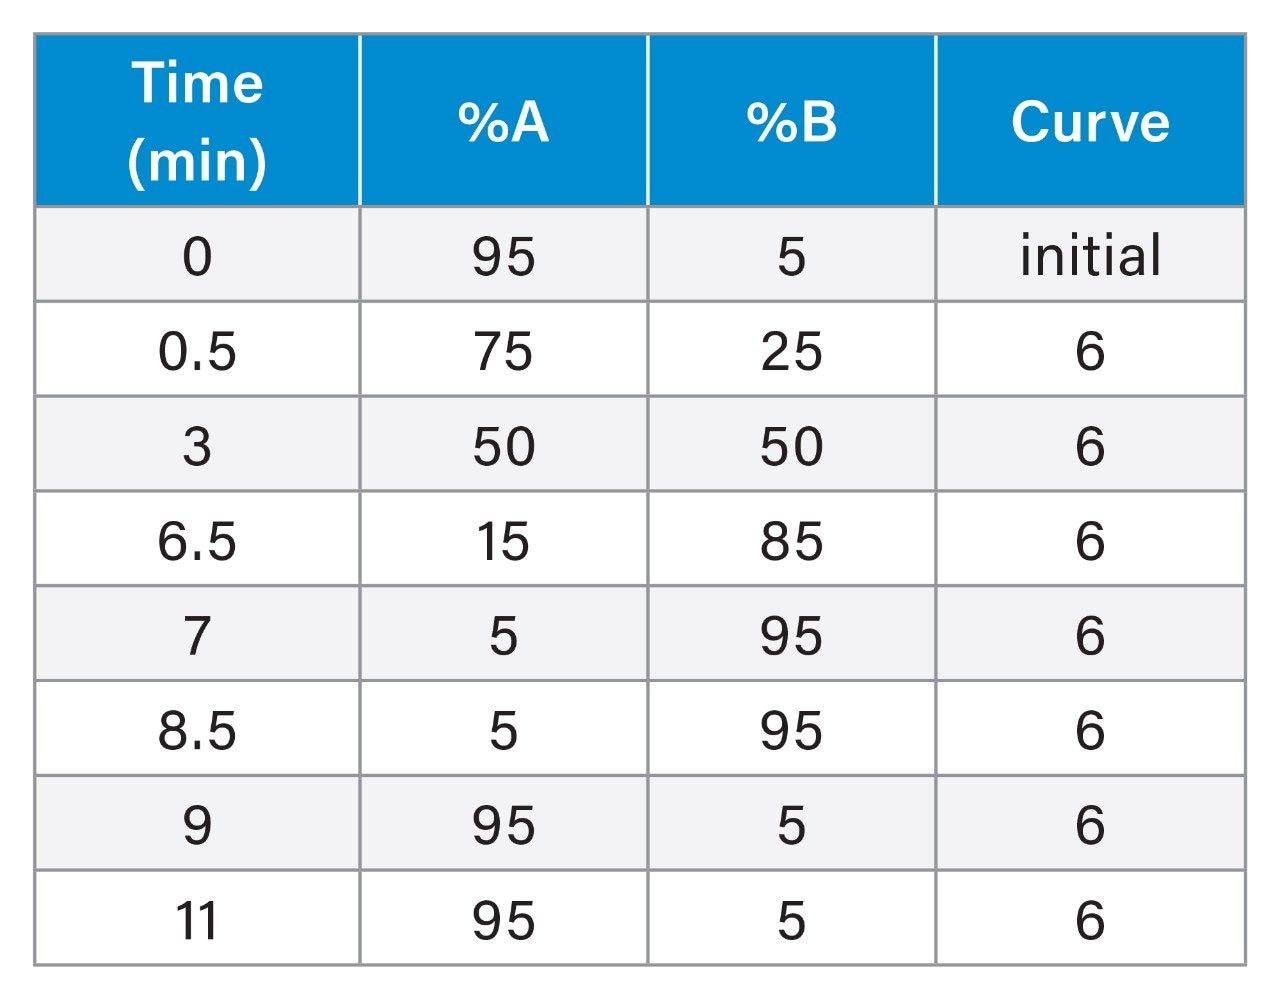
Gradient Table
MS Conditions
|
MS system: |
Xevo TQ Absolute Mass Spectrometer |
|
Ionization mode: |
ESI- |
|
Capillary voltage: |
0.5 kV |
|
Source temperature: |
100 °C |
|
Desolvation temperature: |
350 °C |
|
Desolvation flow: |
900 L/hr |
|
Cone flow: |
150 L/hr |
|
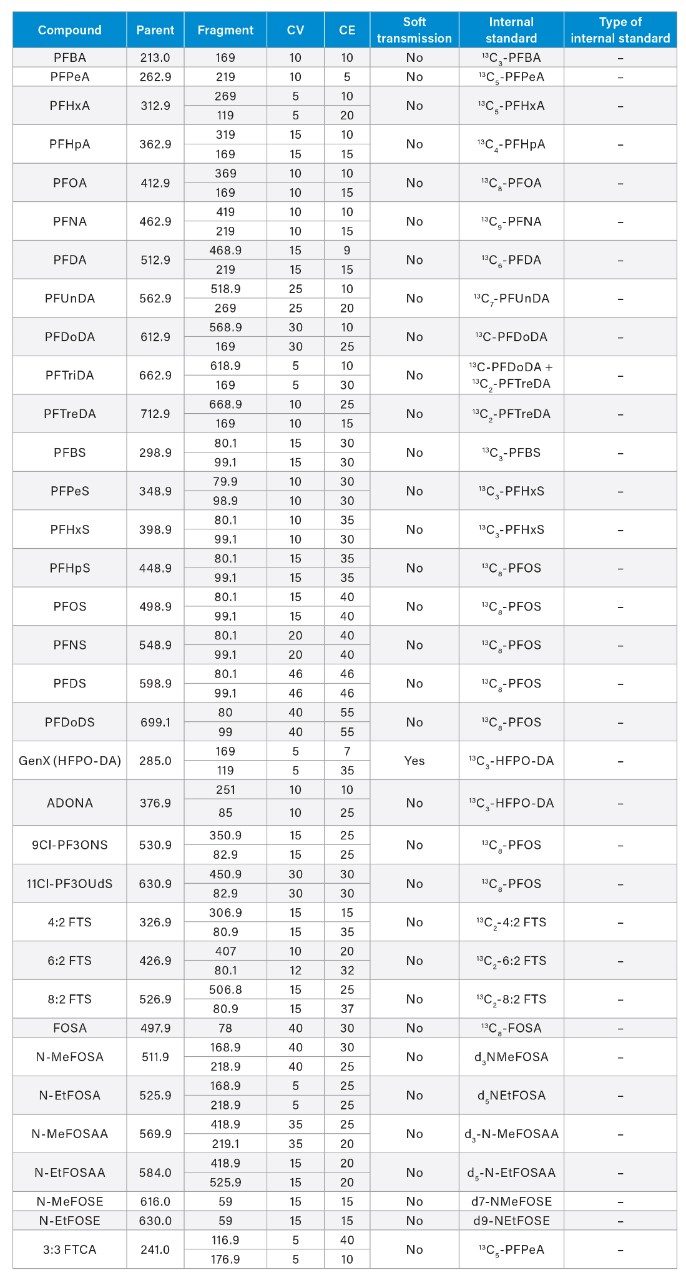
MRM method: |
See Appendix Table 1 for full MRM method details |
Data Management
|
Software: |
waters_connect™ for Quantitation Software |
Results and Discussion
Sensitivity and Method Detection Limits
The sample size was the only part of the sample preparation process that was changed from the automated workflow that was previously being used.3 Equivalency to the EPA 1633 quality control guidelines has been demonstrated using a 250 mL sample. In this work, the sample volume was reduced to just 50 mL of sample, resulting in a 5x reduction of enrichment factor from the SPE extraction. To adjust for the difference in enrichment factor between the two sample sizes, the injection volume was increased from 2 µL to 10 µL for the analysis of the 50 mL samples. Figure 1 demonstrates that this adjustment produced response equivalent to that of the the 250 mL extract, while reducing sample preparation time to about an hour per batch of 8 samples, or approximately half the time required for 250 mL samples.

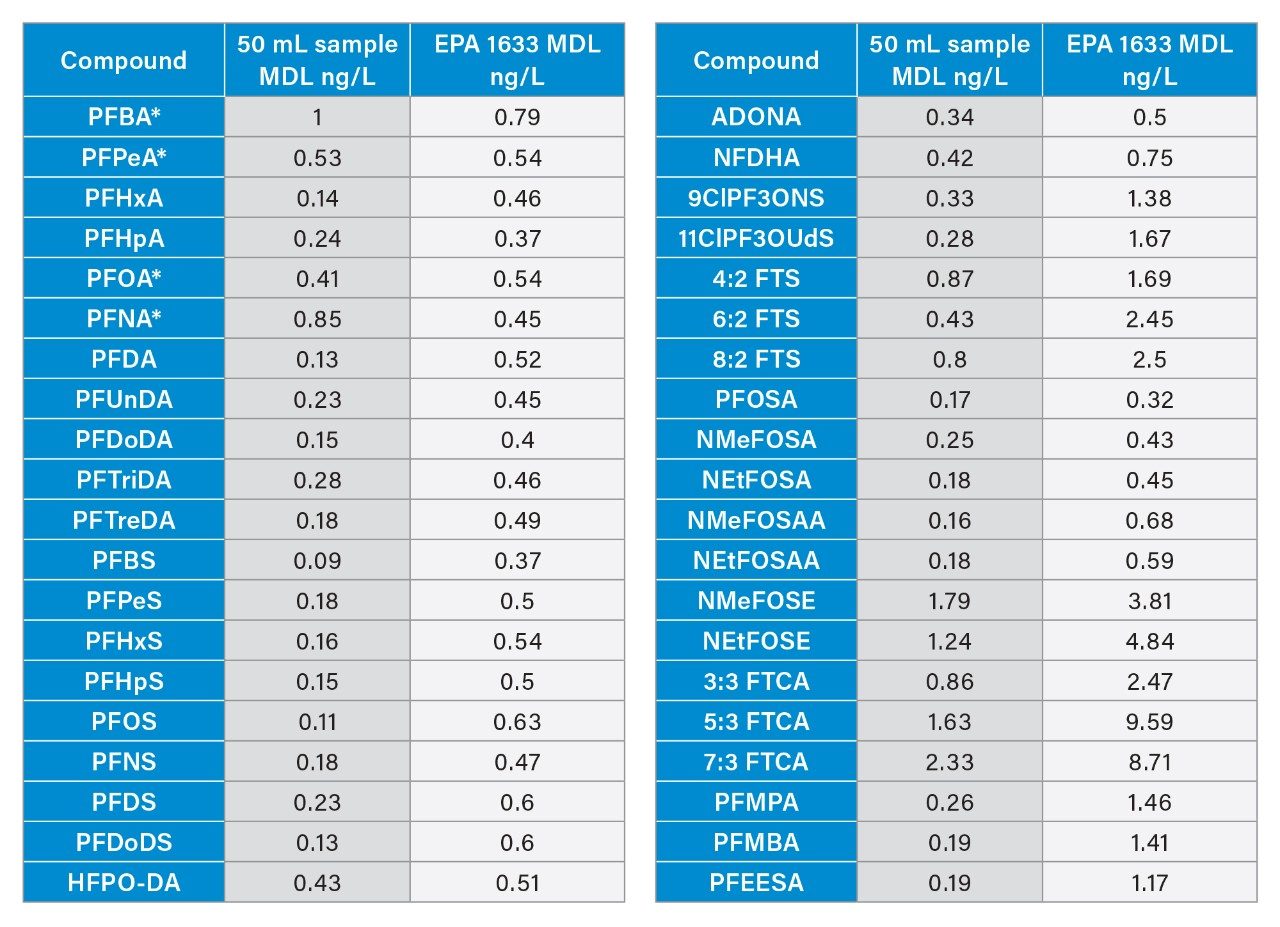
A method detection limit study was performed following the guidance of the Code of Federal Regulations Guidelines Establishing Test Procedures for the Analysis of Pollutants (40 CFR Part 136, Appendix B).4 For this study, 8 replicate 50 mL water samples spiked near the expected detection limit were extracted and analyzed over a 3-day period. MDLs were calculated based on the guidance document procedure, including calculating an MDL blank (MDLb) for PFBA, PFPeA, PFOA, and PFNA, which were detected in the method blank samples.
Using these calculations, the MDLs for all 40 PFAS compounds were determined and are listed in Table 2. A comparison is also made to the pooled MDLs provided in EPA 1633A for aqueous samples which were derived from the method’s multi-laboratory validation study using a 500 mL sample extract. Except for the four PFAS that required an MDLb to be calculated due to solvent contamination, all compounds had a lower MDL using the 50 mL extraction technique followed by analysis on the Xevo TQ Absolute Mass Spectrometer than those reported in EPA 1633A, meaning a lower concentration is detectable. When compared, on average, the MDLs were approximately 3 times lower with a range of 1.5 – 6.2 times lower MDLs depending on compound.
Recovery in Water Samples
The average percent recovery of the EIS extracted from surface water, influent wastewater, and effluent wastewater samples (all containing suspended solids) are shown in Figure 2A-C, comparing 250 mL and 50 mL extraction volumes for each. The minimum recovery limits required by EPA 1633 are indicated by the black lines in Figure 2.1 Generally, both extraction volumes produced comparable recoveries and were well above the required minimum recovery values. In the wastewater samples, the recovery using the 50 mL sample volume was greater for some of the longer chain carboxylates (PFDoDA and PFTreDA) and sulfonamides (FOSAs, FOSAAs, and FOSEs). These groups of PFAS either exclusively use (FOSAs) or more heavily rely on long chain carboxylates, the reversed phase mechanism of the WAX sorbent. With less organic material from the matrix being loaded onto the SPE cartridge with the smaller sample volume, this may be demonstrating there is less competition for reversed phase sites, resulting in the increased recovery of these types of PFAS. The mean recovery of all EIS from the 50 mL samples across the different aqueous sample types was 77% with a mean RSD of 7.7%. In comparison, the mean recovery and %RSD in the 250 mL samples were nearly identical, with values of 76% and 8.8%, respectively.
Additionally, the targeted native PFAS analytes were spiked into the surface water sample to determine the native recoveries. Figure 2D shows the recovery of three replicates of this spiked sample, with the minimum and maximum recovery guidelines represented by the black bars. The recovery ranged from 88 – 123%, with a mean recovery of 99% and mean RSD of 7.1%. Similar to the EIS, the native recoveries were all within the required range indicating that the targeted PFAS can be reliably recovered from the smaller sample volume.

Analysis of a Certified Reference Material and Authentic Water Samples
To assess accuracy of utilizing a smaller sample size, a CRM from Waters ERA was processed with the authentic samples. The PFAS in the Wastewater CRM is certified for all EPA 1633 analytes, giving a representative reference material for method performance without having to spike unknown matrix samples, which can become complicated without a sample free from PFAS. The CRM was prepared in both 250 and 50 mL volumes to compare the smaller sample size with a more standard one.
Figure 3 shows the average quantitative results for 3 replicate extractions and analyses of the Wastewater CRM at both sample sizes, compared to the certified values and minimum/maximum certified value range. All 40 target PFAS in EPA 1633 were quantified within the allowable minimum and maximum concentration range for both sample sizes. The mean trueness for the 50 mL CRM extraction was 104%, compared to 103% for the 250 mL CRM extraction. These results demonstrate that the automated workflow in combination with the sample analysis is highly accurate and repeatable, regardless of sample size.
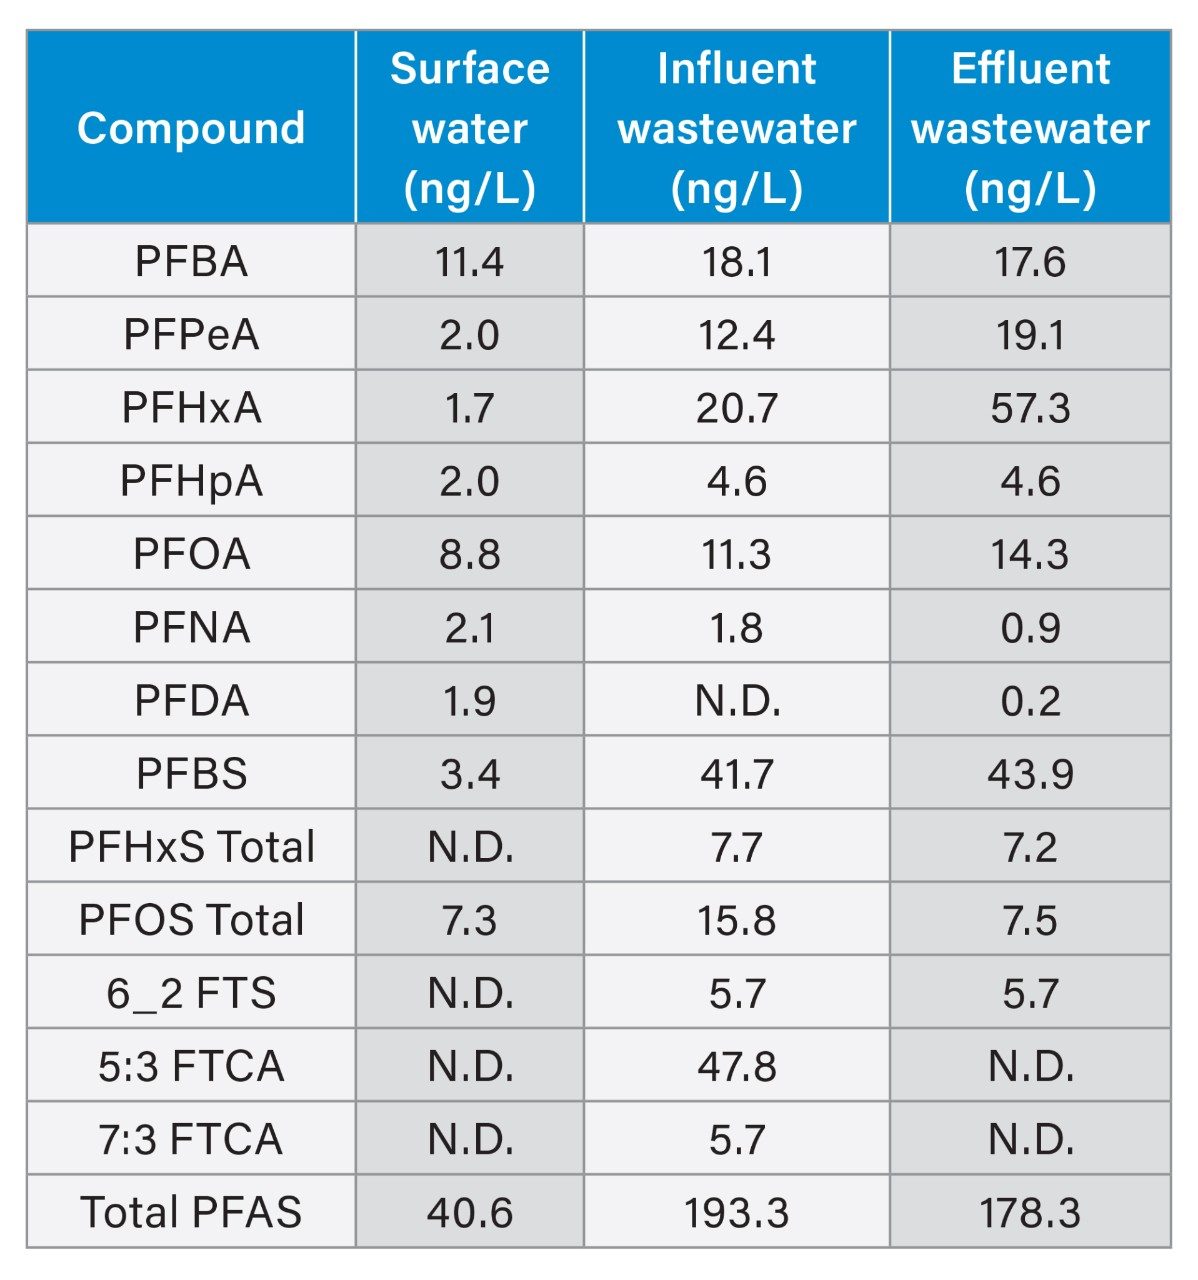
Different types of authentic environmental water samples were extracted using the 50 mL sample size to quantify the levels of PFAS in these authentic samples. PFAS were detected in all the samples tested at different concentration levels with the details of each sample listed in Table 3, including the total PFAS concentration in each sample type. These results demonstrate that even with the smaller sample volumes, trace levels of PFAS can be detected in different types of challenging water samples.

Conclusion
The sample size for aqueous samples was successfully reduced to only 50 mL while maintaining the sensitivity and overall method performance as observed when using 250 mL sample sizes. This was demonstrated using a method detection limit study, recovery of both extracted internal standards and native analytes, and a certified reference material. Extracted internal standard recoveries in three different water sample types were well above the required minimum recovery values. Native PFAS analyte recoveries were also well within the required recovery range in a surface water sample. Additionally, calculated concentration values for a wastewater reference material were determined to be accurate when compared to the provided certified range, reinforcing confidence in method accuracy. Using the reduced sample size, authentic water samples were collected, extracted, and analyzed with PFAS detected and quantified in each sample. The benefits of using a smaller sample size are realized from sample collection and transportation in the field, laboratory storage, reduced sample preparation time, and in some cases, better recovery and overall performance.
References
- US Environmental Protection Agency. EPA Method 1633A, Analysis of Per- and Polyfluoroalkyl Substances (PFAS) in Aqueous, Solid, Biosolids, and Tissue Samples by LC-MS/MS. December 2024.
- K Organtini, K Rosnack, C Plummer, P Hancock, O Burt. Analysis of Per- and Polyfluoroalkyl Substances (PFAS) in Accordance with EPA 1633 Part 2: Analysis of Aqueous Matrices. Waters Application Note 720008143. 2023.
- K Organtini, K Rosnack, O Burt, I Wan. Automating the Sample Preparation Workflow for Per- and Polyfluoroalkyl Substances (PFAS) in Aqueous Samples Following EPA Method 1633. Waters Application Note 720008825. 2025.
- Code of Federal Regulations. Guidelines Establishing Test Procedures for the Analysis of Pollutants. 40 CFR Part 136, Appendix B.


720008897, June 2025