Lowering Quantitation Limits for mAb Titer Measurements Using Small Volume 3.5 µm Particle-Size Protein-A Affinity Columns
Stephan M. Koza, Steve Shiner, Matthew A. Lauber
Waters Corporation, United States
Published on May 27, 2025
Abstract
Protein A (ProA) affinity chromatography (PAAC) is often used for the measurement of monoclonal antibody (mAb) titer in cell culture conditioned media (CM) samples. Here we introduce high-pressure capable and low volume (70 µL) ProA columns with efficient 3.5 µm diameter non-porous particles packed into hydrophilic organosilica modified metallic hardware in either 2.1 x 20 mm or 3.9 x 5 mm configurations. These columns were compared to a commercially available ProA column comprised of 20 µm diameter fully porous particles packed into 2.1 x 30 mm PEEK™ hardware. Linear ranges and lower limits of quantitation (LLQ) were evaluated for pure mAb standard loads (0.02 to 10 µg and 0.01 to 0.2 µg) and mock Chinese hamster ovary (CHO) CM samples representing a range of mAb titers (0.037 to 1.033 mg/mL). Total analysis cycle time per sample is approximately 2.3 minutes at a flow rate of 1.0 mL/min and 1.3 minutes at a flow rate of 2.0 mL/min.
Benefits
- Up to a 5-fold to 7-fold reduction in lower limits of quantitation when low mAb titers and limited sample volumes restrict mAb loads
- Improved elution peak profile simplifies integration
- 5-fold to 9-fold higher signal-to-noise for lower limits of detection
Introduction
Analytical ProA affinity columns are used to provide critical cell culture titer information during the manufacturing of mAb and other recombinant proteins with ProA affinity binding sites (e.g. fusion proteins). Additionally, higher throughput analytical PAAC is often deployed during mAb manufacturing process development, particularly when higher precision titer measurements are required.
Here, we present two recently developed high efficiency, low volume (70 µL) ProA columns that are packed with 3.5 µm non-porous particles in either a 2.1 x 20 mm or a 3.9 x 5 mm column configuration. The metal alloy hardware used to construct these columns is modified with hydrophilic MaxPeak™ High Performance Surfaces and is capable of operating at significantly higher column pressures (6,000 PSI, 414 bar) than PEEK hardware.1 The 3.5 µm non-porous polymer particle surfaces are also modified with a hydrophilic layer prior to attaching ProA ligands. While these surface modifications are critical to inhibit undesired interactions with the protein of interest, there are also a myriad of components in the CM sample that must also be thwarted from binding to the column including host-cell-proteins, DNA, RNA, and surfactants among others.
The two ProA column configurations were evaluated for linear range and LLQ alongside a commercially available ProA column comprised of 20 µm diameter fully porous particles packed into 2.1 x 30 mm PEEK hardware (Column P). An extended NISTmAb calibration curve from 10 µg to 0.02 µg and a lower load calibration from 0.2 µg to 0.01 µg were assessed along with mock low-viability CHO CM samples representing titers from 1.033 mg/mL to 0.037 mg/mL NISTmAb.
Experimental
Sample Description
NISTmAb reference material, RM 8671 (10 mg/mL), and CHO conditioned media (clarified, 0.2 µm filtered, ~90% viability, with ~0.04 mg/mL trastuzumab).
Extended range calibration curves were generated for NISTmAb loads of 10, 5, 2, 1, 0.5, 0.2, 0.1, 0.05, and 0.02 µg, which were analyzed in duplicate. For this, NISTmAb was diluted to 1.0 and 0.1 mg/mL in PBS and intermediate points were generated by adjusting the injection volumes. Low range calibration curves were generated for NISTmAb loads of 0.2, 0.1, 0.05, 0.02, and 0.01 µg by adjusting the injection volumes of the 0.10 mg/mL standard, these were analyzed in triplicate.
Mock CM samples were prepared by spiking a CM sample purified NISTmAb (10 mg/mL) to 1.00 mg/mL and then 1:1 serially diluting with CM to attain NISTmAb spike levels of 1.0, 0.5, 0.25, 0.125, 0.0625, and 0.03125 mg/mL. The clarified CHO cell CM sample had ~90% cell viability and a concentration of approximately 0.04 mg/mL trastuzumab. In this study, we treated this endogenous trastuzumab as NISTmAb for demonstration purposes and assigned the concentration as 0.037 mg/mL based on a NISTmAb calibration curve and 50 µL injection volumes of CM. Accounting for the dilution of the endogenous mAb, the predicted spiked mock CM sample concentrations were 1.033, 0.535, 0.286, 0.161, 0.099, and 0.068 mg/mL.
Method Conditions
LC Conditions
|
LC system: |
ACQUITY™ Premier QSM UPLC™ with TUV System with 100 µL mixer, 15 µL + 50 µL sample loop, 0.004 PEEK TUV inlet For Low Range LLQ: 15 µL sample loop and 0.0025 PEEK TUV inlet |
|
Columns and connector: |
BioResolve™ Protein A Affinity Column, MaxPeak Premier, 3.5 µm, 2.1 x 20 mm (p/n: 186011369) BioResolve Protein A Affinity Column, MaxPeak Premier, 3.5 µm, 3.9 x 5 mm (p/n: 186011379) “Column P”: 20 µm porous, 2.1 x 30 mm PEEK™ Protein A column |
|
Column temperature: |
ambient |
|
Sample temperature: |
6 °C |
|
Injection volume: |
10 µL or as indicated |
|
ProA loading mobile phase: |
Dulbecco’s Phosphate Buffered Saline (DPBS) at 2x concentration, pH 7.4 (0.1 µm sterile-filtered) |
|
ProA elution mobile phase: |
100 mM KH2PO4 titrated to pH 3.0 (HCl) |
|
Flow rate: |
1.0 or 2.0 mL/min |
|
UV absorbance: |
280 nm, 80 points/sec |
|
Data management: |
Empower™ Chromatography Data System (CDS) |
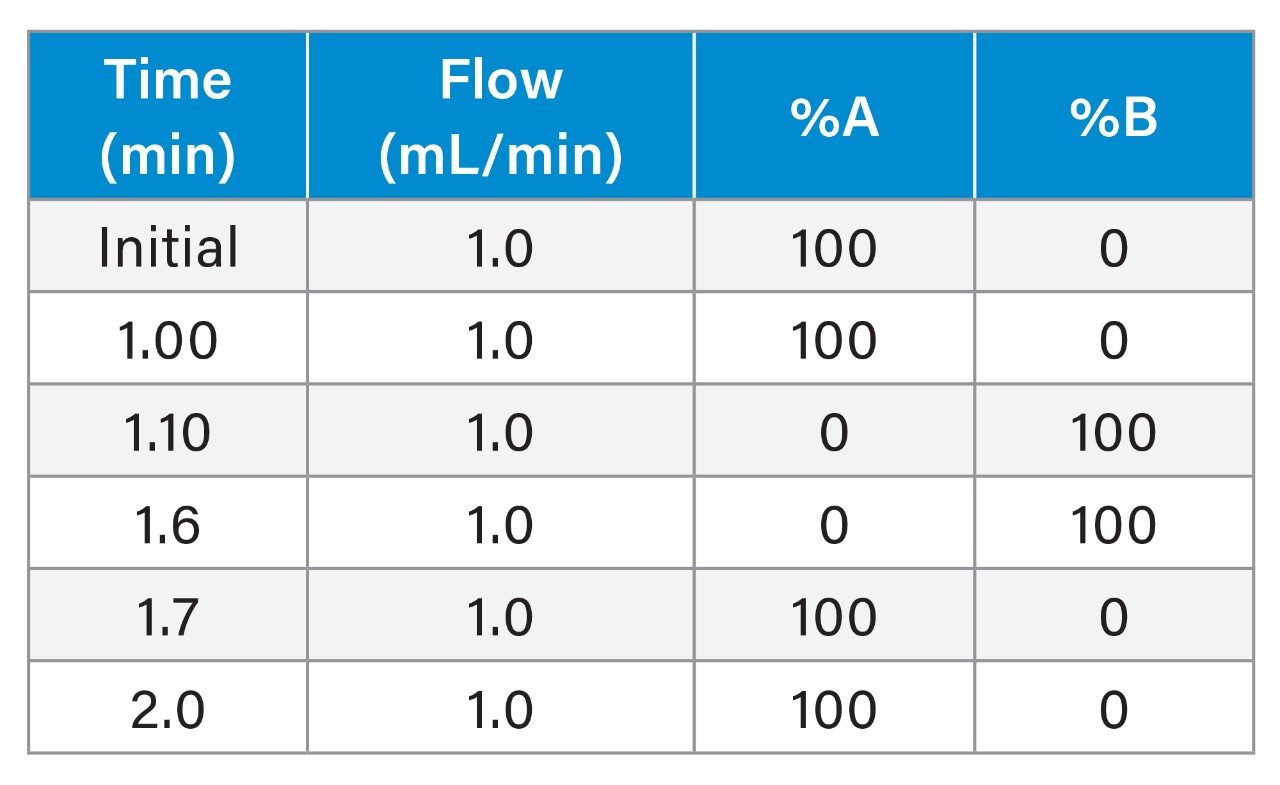
1.0 mL/min ProA Analytical Gradient Table
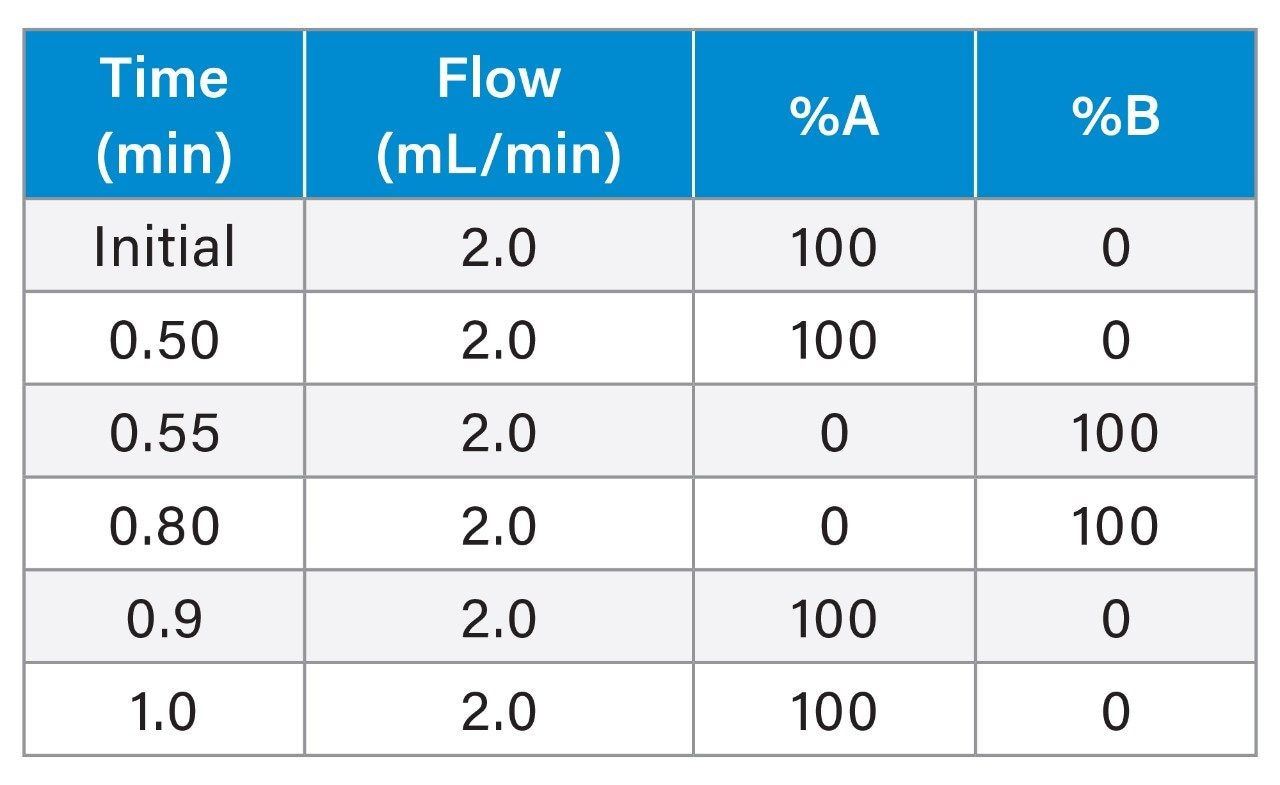
2.0 mL/min ProA Analytical Gradient Table
Results and Discussion
Calibration curves were generated using the 1.0 mL/min gradient for both Waters ProA column configurations (2.1 x 20 mm and the 3.9 x 5 mm) and for Column P (20 µm, 2.1 x 30 mm). For the 2.0 mL/min gradient, the 2.1 x 20 mm Waters ProA column was not evaluated due to excessive back pressure. Representative chromatograms of the three highest loads (10, 5, and 2 µg) and three lowest loads (0.1, 0.05, and 0.02 µg) of the extended range NISTmAb calibration are shown for 1.0 mL/min (Figure 1) and for 2.0 mL/min (Figure 2). The peak heights observed are 5-fold to 9-fold greater for the Waters ProA columns in comparison to Column P for the low load samples with the 2.1 x 20 mm Waters ProA at 1 mL/min having the highest elution peaks. While the improved signal-to-noise ratio (s/n) delivered by the Waters ProA columns can proportionally decrease the limits of detection (e.g. LOD = 3x s/n), where peaks start and end, are also made more clearly discernible for these columns. Depending on chromatographic conditions, this capability may improve peak integration reliability.
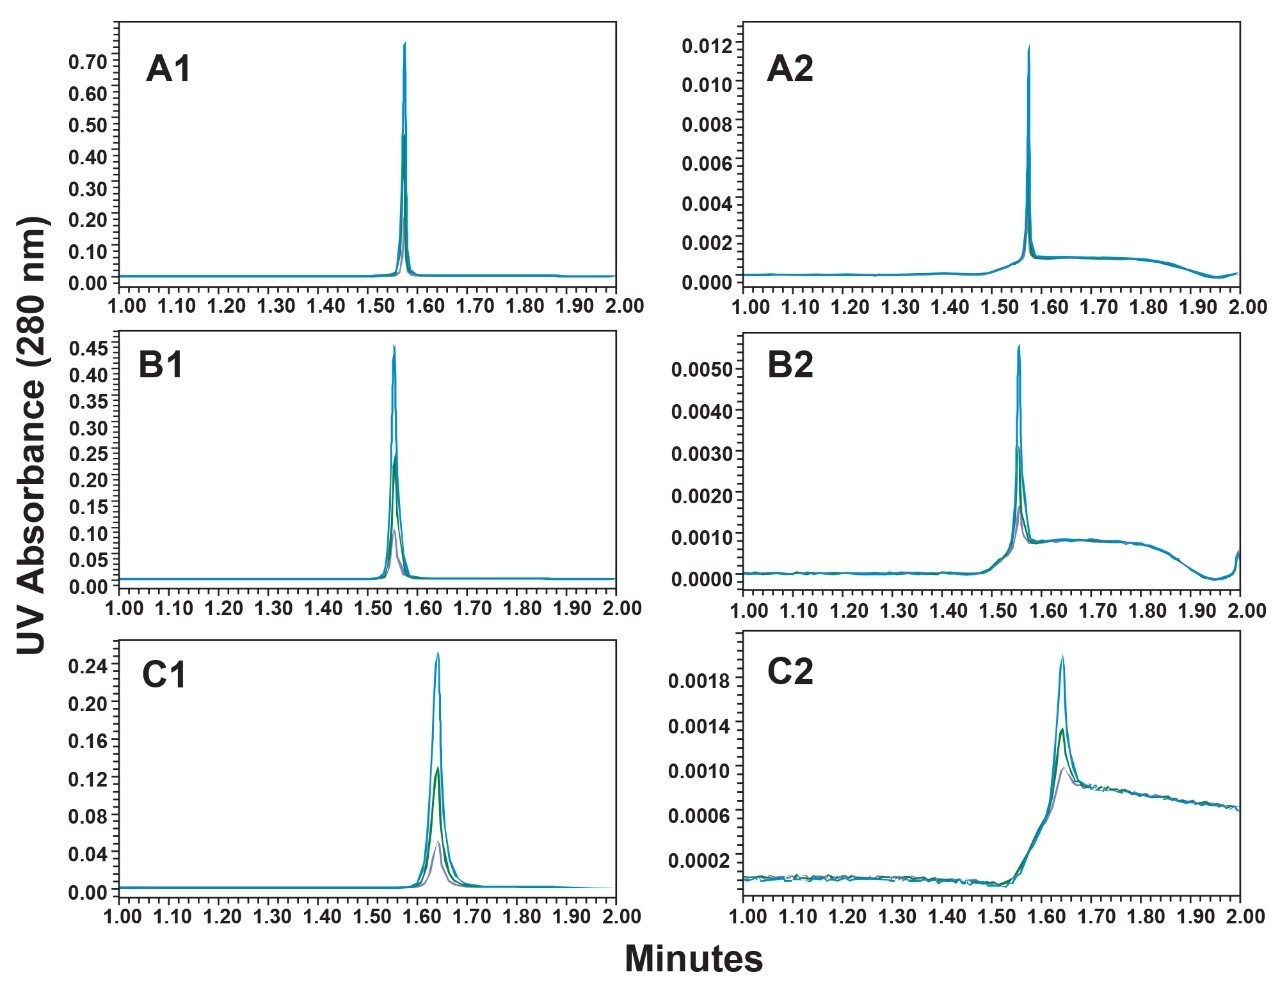
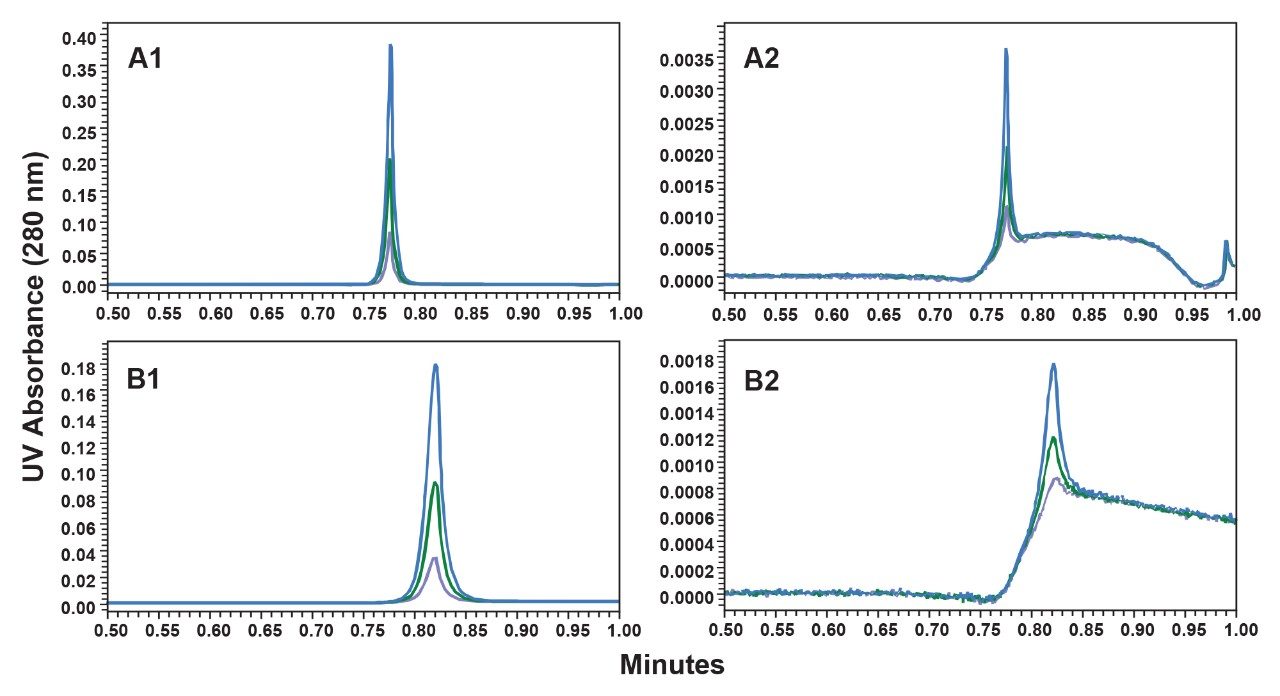
Table 1 provides the coefficients of determination (R2) and LLQ values of the extended and low range NISTmAb calibration curves generated for this study (see Experimental section). LLQ was calculated from the standard error of regression (sy/x) and the slope (m) of the linear regression (LLQ = 10(sy/x/m). The lowest loads were removed for the Column P LLQ and R2 determinations due to their low s/n resulting in excessive linear fit residuals. These results indicate that the Waters ProA columns deliver a 2-fold to 3-fold lower linear range for calibrations extending downward from a 10 µg load (Extended Range) and a remarkable 5-fold to 7-fold decrease in LLQ for 0.2 µg loads and lower (Low Range) in comparison to Column P. It should be noted that to obtain the 1 mL/min low range LLQ results the mixing and dispersion volumes of the UPLC were minimized (see Experimental section). Although not evaluated, Column P would be predicted to provide a higher upper linear loading range before exceeding the UV absorbance limit of the detector due to its reduced peak heights.
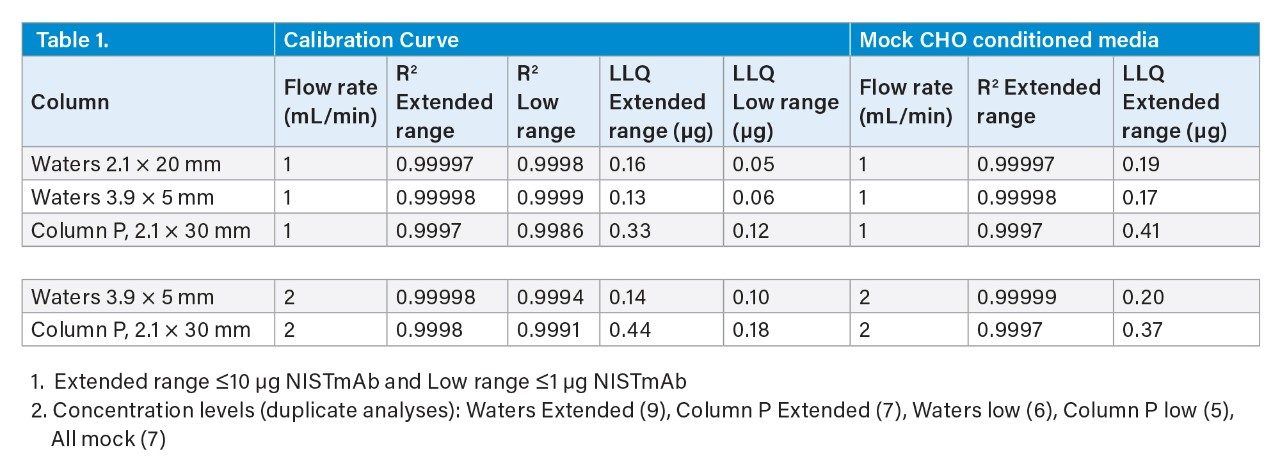
The LLQ values of the two Waters ProA columns were comparable despite the s/n being 2-fold higher for the 2.1 x 20 mm configuration. This may be due in part to the narrower peak widths (W0.5 ≈0.25 sec) produced by the 2.1 x 20 mm column allowing for the collection of only 20 points across the top half of the peak when using a data collection rate of 80/sec. The Waters ProA columns also deliver greater peak area reproducibility at the lower load range as indicated by the significantly lower LLQ and higher R2 values.
Analyses of a series of 7 mock CM samples (see Experimental section) ranging in predicted NISTmAb concentrations from 0.037 mg/mL to 1.033 mg/mL demonstrated comparable trends in R2 and LLQ values as those observed between the columns for the extended calibration curves (Table 1). Representative chromatograms for the lowest concentration CM with 0.037 mg/mL of mAb (Figure 3) also show comparable mAb peak profile differences to those of the calibration standards. At this low load, a low-level pre-peak is observed for all three columns consistent with trace level retention of non-mAb CM components.
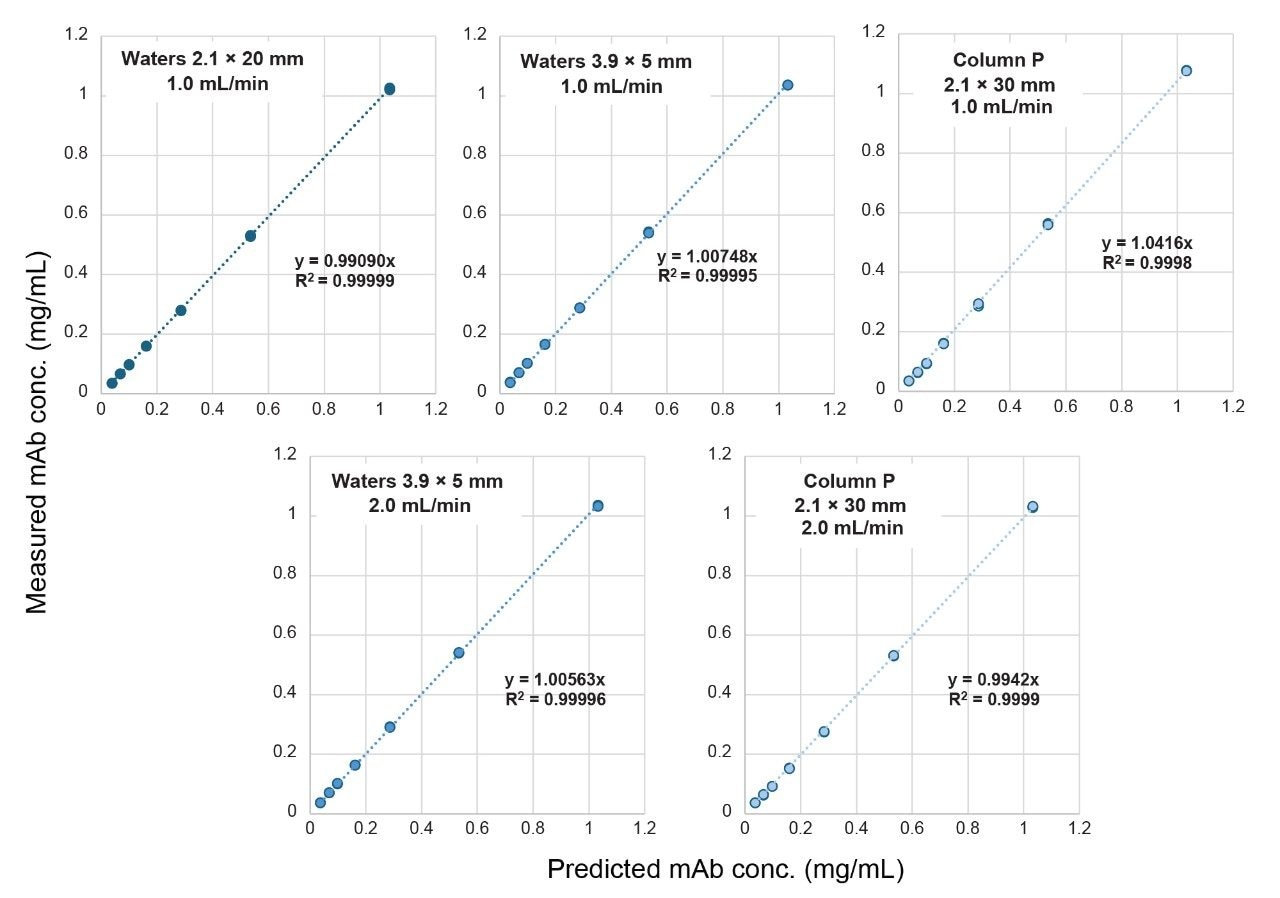
Correlation plots shown in Figure 4 comparing the predicted concentration for the CM samples to the values determined using the corresponding calibration curve demonstrate high correlation (R2) and minimal bias with slopes near 1.00 for linear fits forced through the origin. Deviations from the ideal slope value of 1.00 can be due to the stability of the mAb in CM as well as interactions of the mAb with components of the CM such as surfactants, DNA and RNA, and host-cell proteins, as well as variations in dilutions of the samples.
These comparisons highlight that the two Waters ProA columns can allow for reduced sample volumes while still providing comparable analytical performance at higher sample loads when compared to a leading ProA column constructed with 20 µm porous particles packed into 2.1 x 30 mm PEEK hardware. The lower LLQ of the Waters ProA columns are primarily the result of the smaller volumes of the columns and of a more efficient packed bed without mass transfer due to the 3.5 µm non-porous ProA media.
Conclusion
Waters BioResolve Protein A Affinity Columns can provide:
- Up to 5-fold to 7-fold lower LLQ values versus a ProA column constructed with 20 µm porous particles packed into 2.1 x 30 mm PEEK hardware while also delivering comparable performance at higher sample loads. A reduced LLQ can be advantageous when mAb concentrations are low and sample volumes are extremely limited, as when determining titer for milliliter scale micro-bioreactor samples
- Improved peak profiles that can increase peak integration reliability at lower sample loads
- 5-fold to 9-fold higher s/n for lower limits of detection
References
- Kizekai, L., Shiner, S.J. and Lauber, M.A. Waters ACQUITY and XBridge Premier Protein SEC 250 Å Columns: A New Benchmark in Inert SEC Column Design. Waters Application Note. 720007493. January 2022.
Featured Products
720008775, May 2025