Analytical Solutions and Method Development Considerations for Quantitative Bioanalytical Oligonucleotide Studies
Marian Twohig, Catalin Doneanu, Margot Lee, Nikunj Tanna, Mary Trudeau
Waters Corporation, United States
Published on November 24, 2025
Abstract
Oligonucleotide therapeutics are gaining momentum as innovative treatment strategies for diseases that have remained challenging to address with conventional therapies. As development of these therapies advances, there is an increasing demand for robust analytical techniques capable of accurately measuring drug concentrations in biological matrices. This is essential for characterizing pharmacokinetics, as well as for assessing therapeutic efficacy and safety.
This study describes analytical methodologies that facilitate the analysis of nusinersen, an antisense oligonucleotide (ASO), in rat plasma using a kit-based sample preparation approach that streamlines analyte extraction and clean up. Ultra-performance liquid chromatography (UPLC™) using ion-pairing reagents with negative ion electrospray detection (ESI) and a Xevo™ TQ Absolute XR triple quadrupole Mass Spectrometer were used to deliver sub ng/mL levels of quantitation.
The MS data was acquired and managed using waters_connect™ Software. The methodology demonstrated linear calibration curves from 0.1-1000 ng/mL with R2 values > 0.99 using 1/x weighting. The % accuracy across all points of the calibration curve ranged from 91.5-105.7 with percentage coefficient of variation (%CV) ranging from 0.5-10.8. The mean % accuracy and mean %CV for the low, mid and high QC levels ranged from 104.2-112.5 and 0.8-7.3% respectively.
Benefits
- The OligoWorks SPE Microplate Kit provides a standardized detergent free solution for the extraction of therapeutic oligonucleotides from biomatrices with minimal sample preparation method development time
- Nusinersen, an 18-mer fully phosphorothioated ASO with 7.1 kDa molecular weight was extracted from rat plasma and quantified at sub ng/mL levels using Waters Xevo TQ Absolute XR triple quadrupole Mass Spectrometer
- The Waters ACQUITY™ Premier UPLC System and Waters ACQUITY Premier Oligonucleotide C18 Column improve analytical results by reducing adsorption to metallic surfaces, leading to enhanced performance addressing several critical bioanalytical challenges, including improved chromatographic recovery, improved lower limits of quantification (LLOQs), and increased linear dynamic range
- waters_connect for Quantitation Software offers compliant-ready workflows for the acquisition, processing, review, and reporting of quantitative bioanalytical data for oligonucleotides
Introduction
Oligonucleotide therapeutics have attracted increasing attention as novel treatment modalities to target diseases that have so far been difficult to manage using established medicines.1 Therapeutic oligonucleotides have shown the ability to modulate protein expression, which can lead to substantial disease-modifying capabilities.2–4 In drug development, there is a need for analytical methodology that can perform accurate quantitation of the drug concentration in biological samples to support pharmacokinetic and safety assessment studies and differentiate between metabolites and impurities.5 Oligonucleotides are polyanionic and highly hydrophilic, which complicates chromatographic separations, sample preparation, and detection.2 Common chromatographic techniques employed for the separation of oligonucleotides include size exclusion, anion exchange, reversed-phase ion pair (IP-RP)6–8 and hydrophilic interaction liquid chromatography (HILIC).3–5 The approach that is most widely used is ion-pair reversed-phase (IP-RP) chromatography using alkylamines and a fluoroalcohol such as 1,1,1,3,3,3-hexafluoro-2-propanol (HFIP).9–10 Hyphenation of reversed phase ion pairing coupled with tandem mass spectrometry (IP-RP-LC-MS/MS) is widely used in bioanalytical studies due to the sensitivity and selectivity it affords.1–12 Quantitation of oligonucleotides in biological matrices can be complicated by the presence of salts, protein, and non-protein macromolecules, as well as inorganic components.13 Extensive non-specific binding of oligonucleotides has been reported, resulting in low recoveries in protein precipitation.14–17
This study describes an IP-RP-LC- multiple reaction monitoring (MRM) workflow for the analysis of nusinersen from rat plasma. Nusinersen sodium (Spinraza®), used in the treatment of spinal muscular atrophy, is an 18-mer ASO with a fully phosphorothioated backbone and 2’-O-methoxyethyl (2’MOE) modifications of the 2’-hydroxy groups on each ribose sugar.18–19 The OligoWorks Kit was used for the sample extraction.20–21
The MS data was acquired and managed using waters_connect Software. UPLC and negative ion ESI with a Xevo TQ Absolute Mass Spectrometer along with the described sample preparation provided sub ng/mL levels of quantitation of nusinersen in rat plasma at therapeutically relevant levels.22
Experimental
Materials
The nusinersen sodium authentic ASO standard was custom synthesized by IDT (Coralville, IA, USA). Optima LC-MS grade acetonitrile and methanol, UltraPure™ DNase/RNase-Free Distilled Water (10977-015) and ammonium acetate (Optima LC/MS, A11450) were purchased from Thermo Fisher Scientific (Waltham, MA). Ultrapure water with a resistivity of 18.2 MΩ·cm was obtained from a Milli-Q® system. Glacial acetic acid (AX0074) and N,N-Diisopropylethylamine (D125806-100 ml) were purchased from Sigma Aldrich (St Louis, MO, USA). The MassPREP Oligonucleotide Separation Technology (OST) Standard23 and hexafluoroisopropanol (IonHance™)24 were obtained from Waters Corporation (Milford, MA, USA). Rat plasma (Wistar Hannover, K2EDTA Male Pooled) was obtained from BioIVT (Westbury, NY, USA). Solvent reservoirs (10 mL, p/n 4332) were purchased from Integra Biosciences (Hudson, NH). DNA LoBind® Tubes (1.5 mL, 022431021 and 0.5 mL 022431005) were purchased from Eppendorf (Enfield, CT, USA).
Sample Preparation
The MassPREP OST Standard (15–35 mer oligodeoxythymidines mix) was prepared in distilled water and used as a daily system benchmark of chromatographic retention time (tR) and MS signal-to-noise (S/N) response.23 The stock solution was subdivided into smaller volumes and frozen (-20 °C) to minimize freeze-thaw cycles. Eppendorf DNA LoBind tubes (0.5 mL or 1.5 mL) were used to prepare the stock solutions and calibration curves. Initial dissolution of the drug was performed with the assistance of the IDT reconstitution calculator to determine the volume of distilled water to create a solution of the drug at 1 mg/mL.25 Plasma stock solutions were prepared fresh daily by spiking the drug stock solution into control blank rat plasma. The calibration curve and QCs were prepared by sequentially diluting from the stock solution in blank plasma to give a curve ranging from 0.1-1000 ng/mL and QC points ranging from 0.375-750 ng/mL. The calibration curve and QC samples were then prepared using the OligoWorks procedure outlined in the OligoWorks sample pretreatment and extraction procedure section.
OligoWorks Solid Phase Extraction (SPE) Wash Solvent Preparation
Oligoworks SPE Solvents were prepared as follows:
Wash 1: 3.84 g of ammonium acetate was weighed using a weighing boat and quantitatively transferred to a clean glass bottle. Water (1000 mL) was added to make a 50 mM ammonium acetate solution. The pH was adjusted to 5.5 with glacial acetic acid.
Wash 2: To optimize the sample preparation protocol, 100 mL total volume solutions ranging from 10%-30% methanol were prepared in clean glassware.
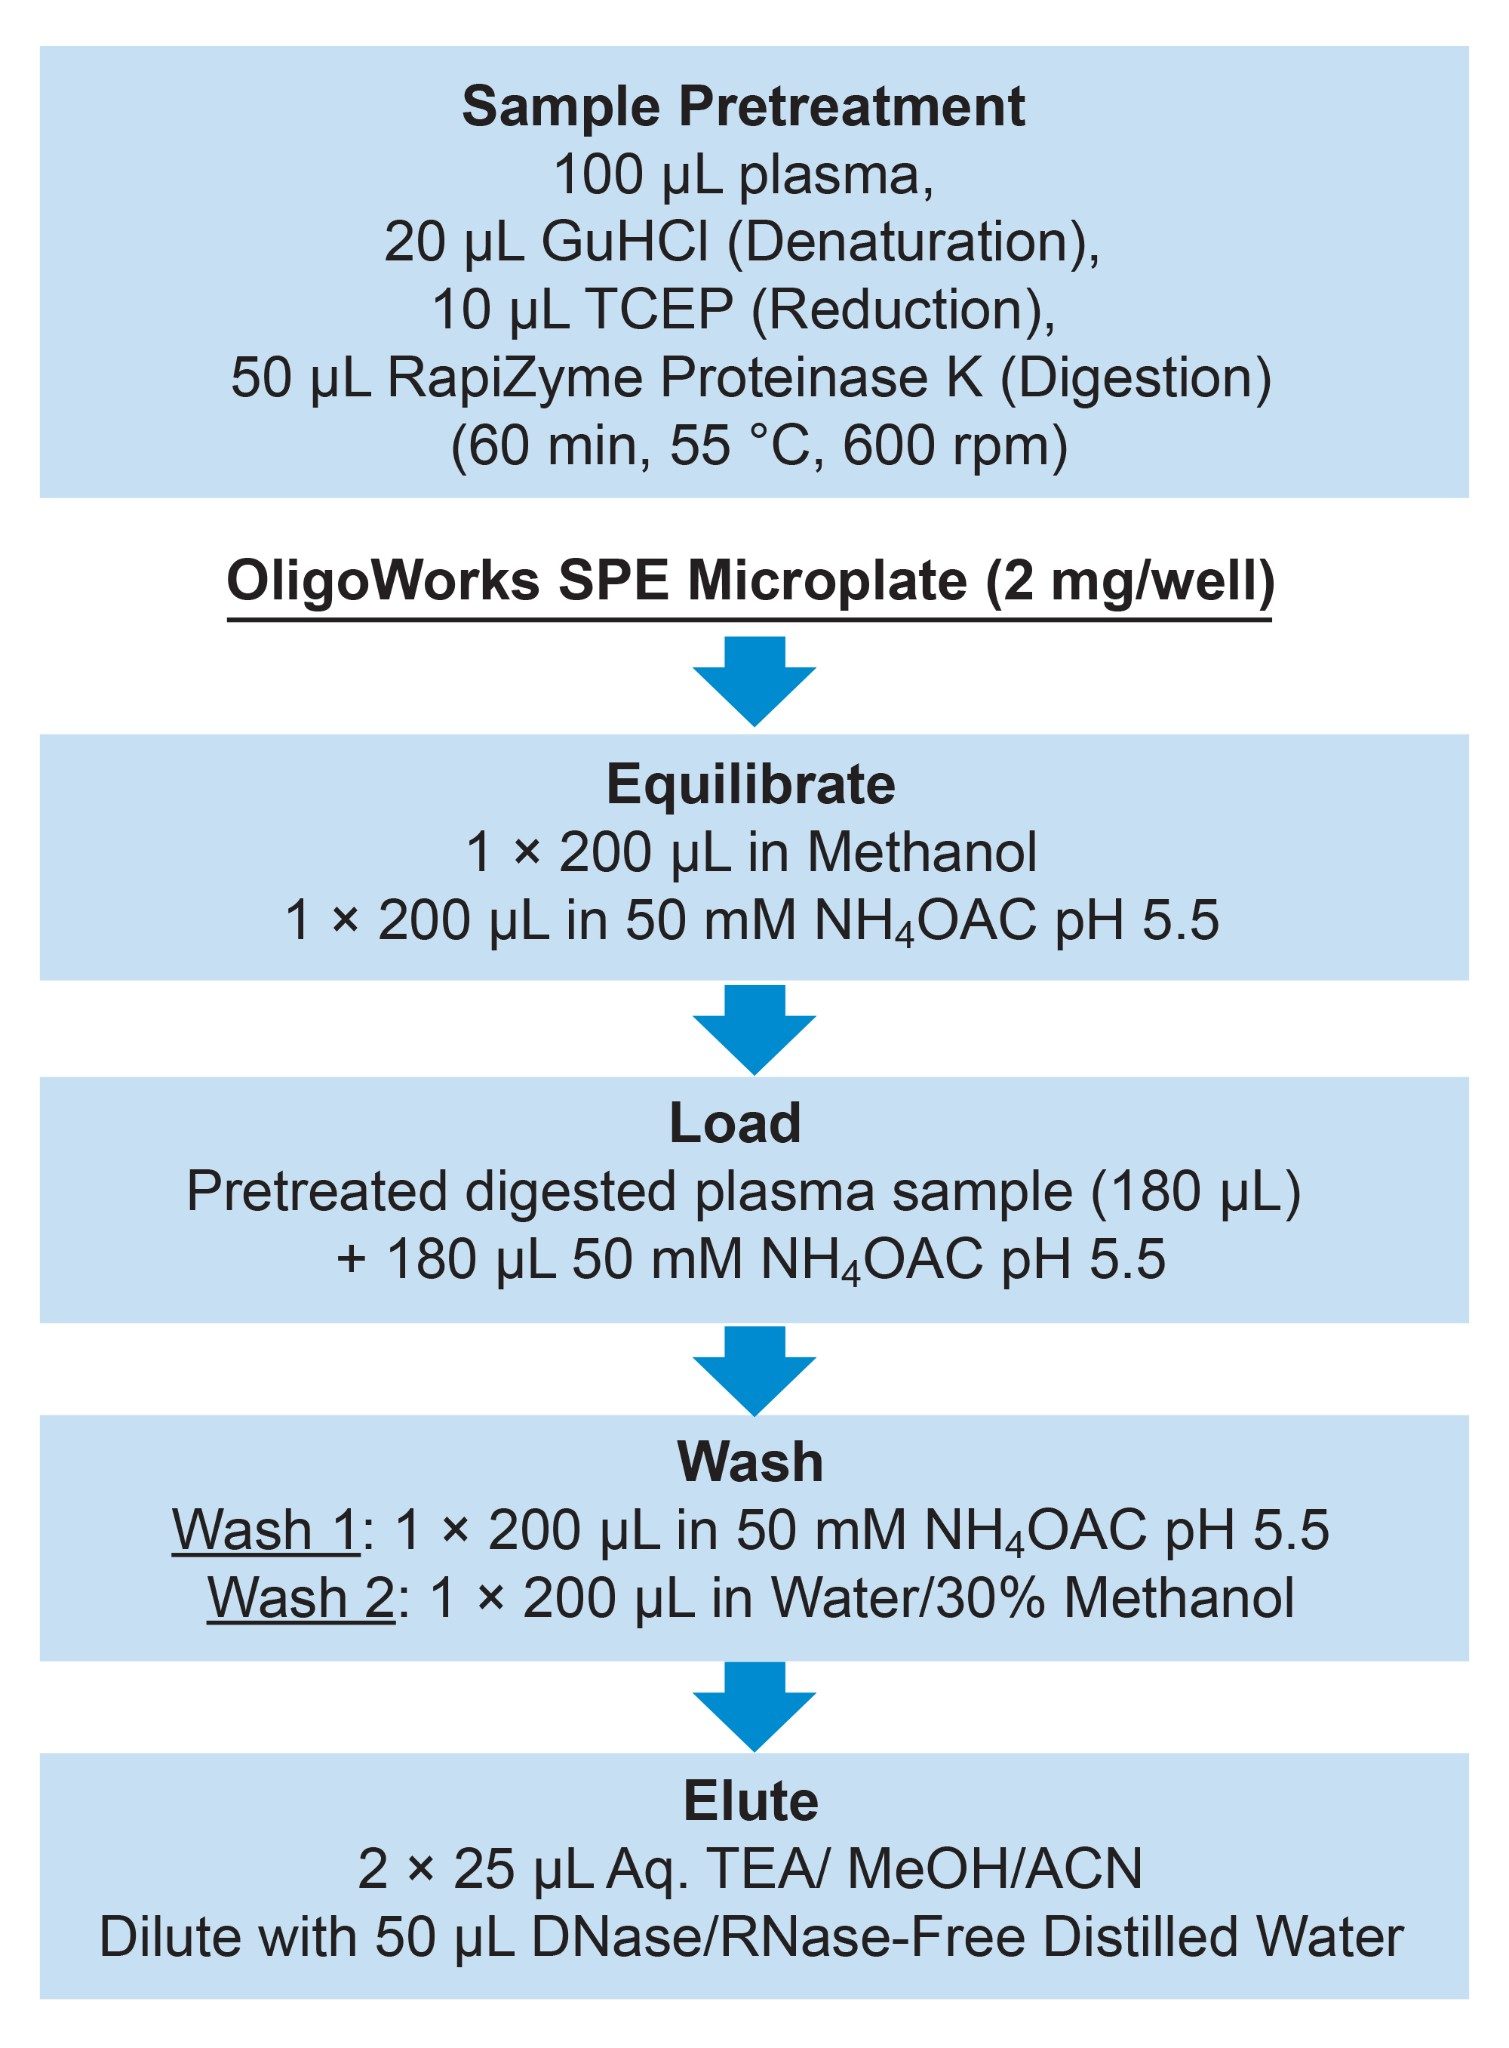
OligoWorks Sample Pretreatment and Extraction Procedure
The calibration curve and QC samples were digested according to the procedure outlined in the OligoWorks manual.26
The final sample preparation protocol is summarized in Figure 1.
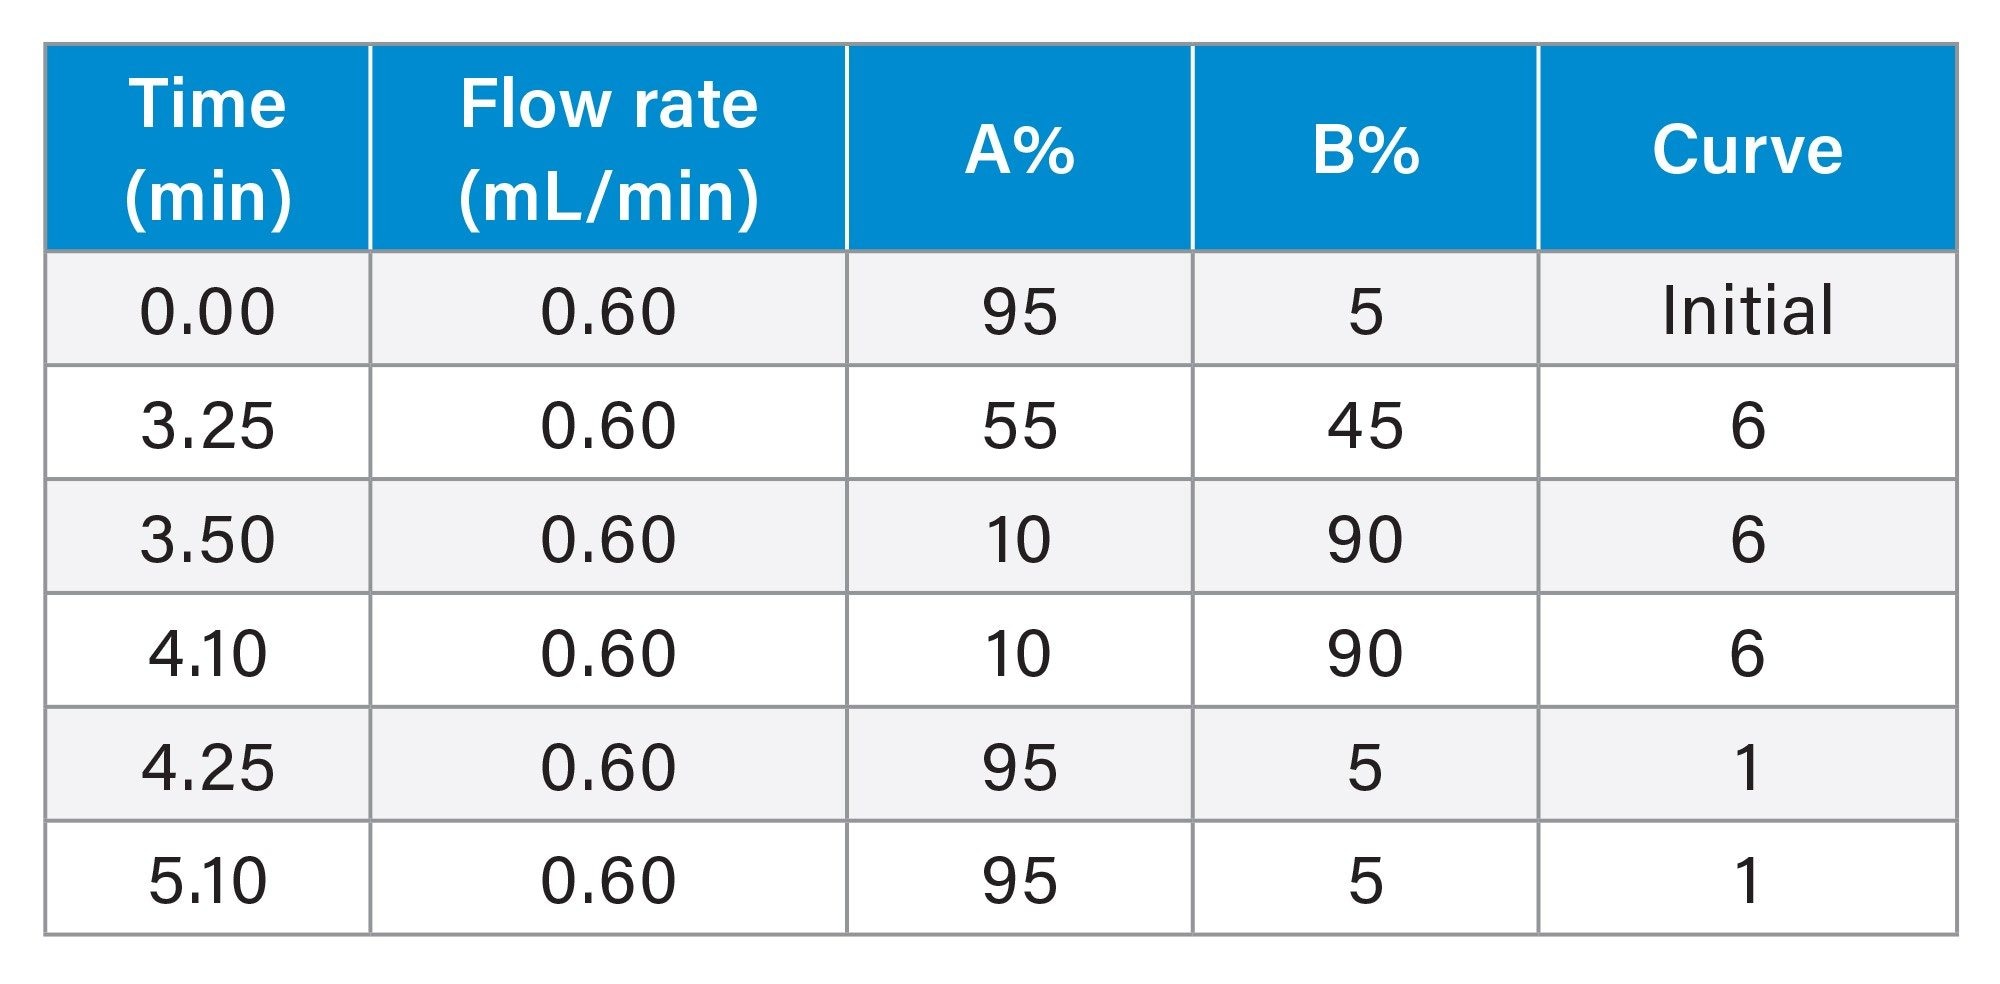
LC Method and Conditions
The mobile phase was prepared as described in Table 1:
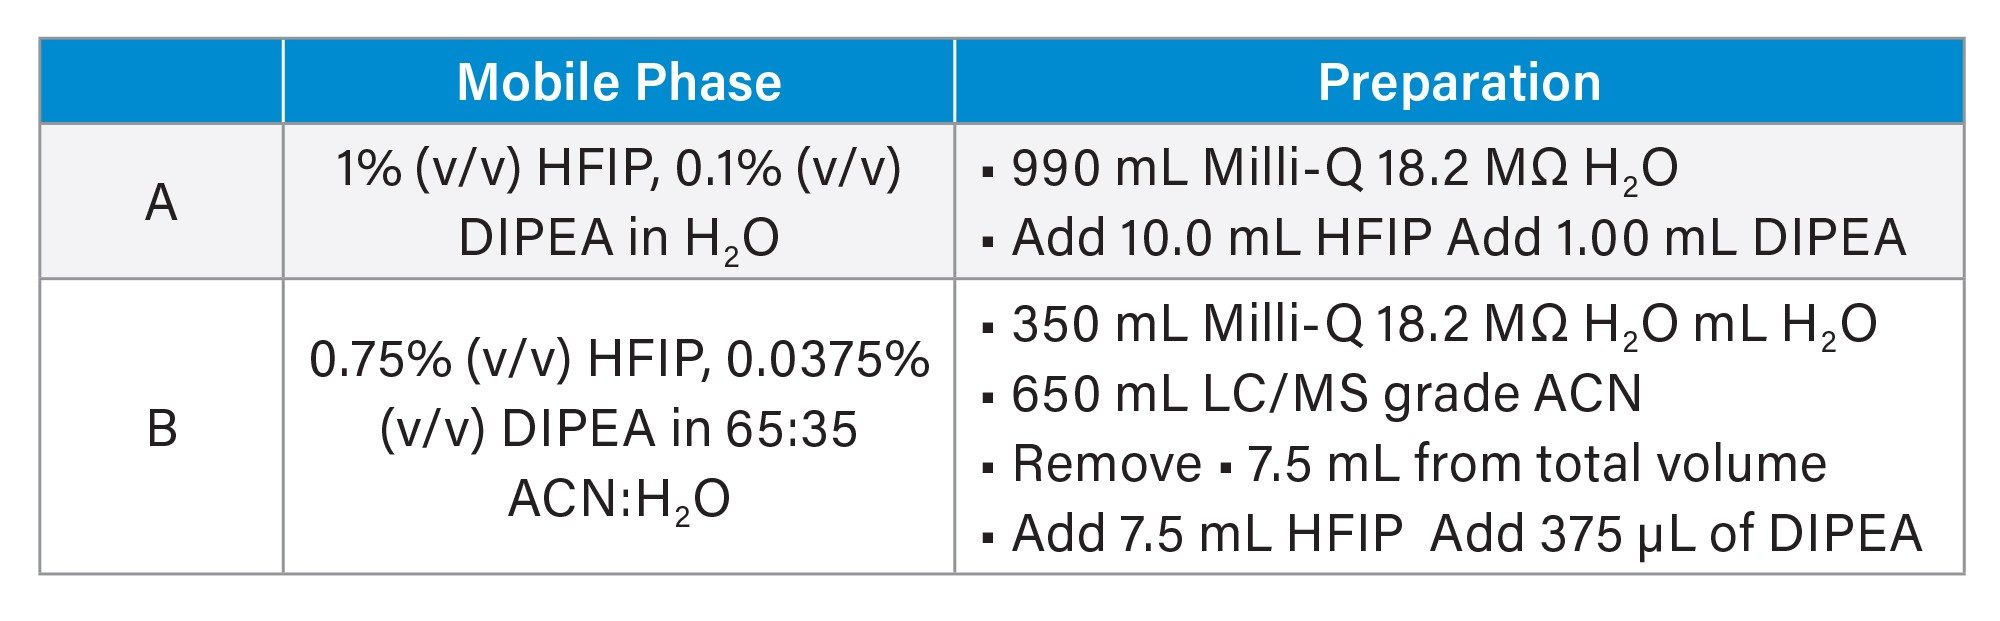
Aging of IP-RP mobile phases results in the loss of MS sensitivity over short time periods.27 To maintain optimum sensitivity, the mobile phase was freshly prepared every day.
The analytical LC system consisted of a binary pump (BSM) capable of pressures up to 15k psi and an autosampler (Table 2). Electron-rich compounds, such as those containing phosphate or carboxylate groups and others, can be lost due to non-specific adsorption on metal surfaces, resulting in reduced analyte response. The ACQUITY Premier System contains inert hardware designed to mitigate these undesired metal interactions within the flow path of the LC system. The C18 130 Å column, used for the separation, also features inert surfaces, resulting in improved peak shape, recovery, sensitivity, and stability.28
|
UPLC pump: |
ACQUITY Premier System with Binary Solvent Manager |
|
Column: |
ACQUITY PREMIER Oligonucleotide C18 Column, 1.7 µm, 2.1 x 50 mm (p/n: 186009484) |
|
Flow rate: |
0.6 mL/min |
|
Mobile phase A: |
1% HFIP and 0.1% DIPEA in H₂O |
|
Mobile phase B: |
0.75% HFIP, 0.0375% DIPEA in 65:35 ACN:H₂O |
|
Purge solvent: |
10:90 Methanol: Water |
|
Wash solvent: |
25:25:25:25 Water:Methanol:Acetonitrile:IPA |
|
Column temperature: |
60 °C |
|
Injection volume: |
20 µL |
Table 2. LC conditions.
MS Method and Conditions
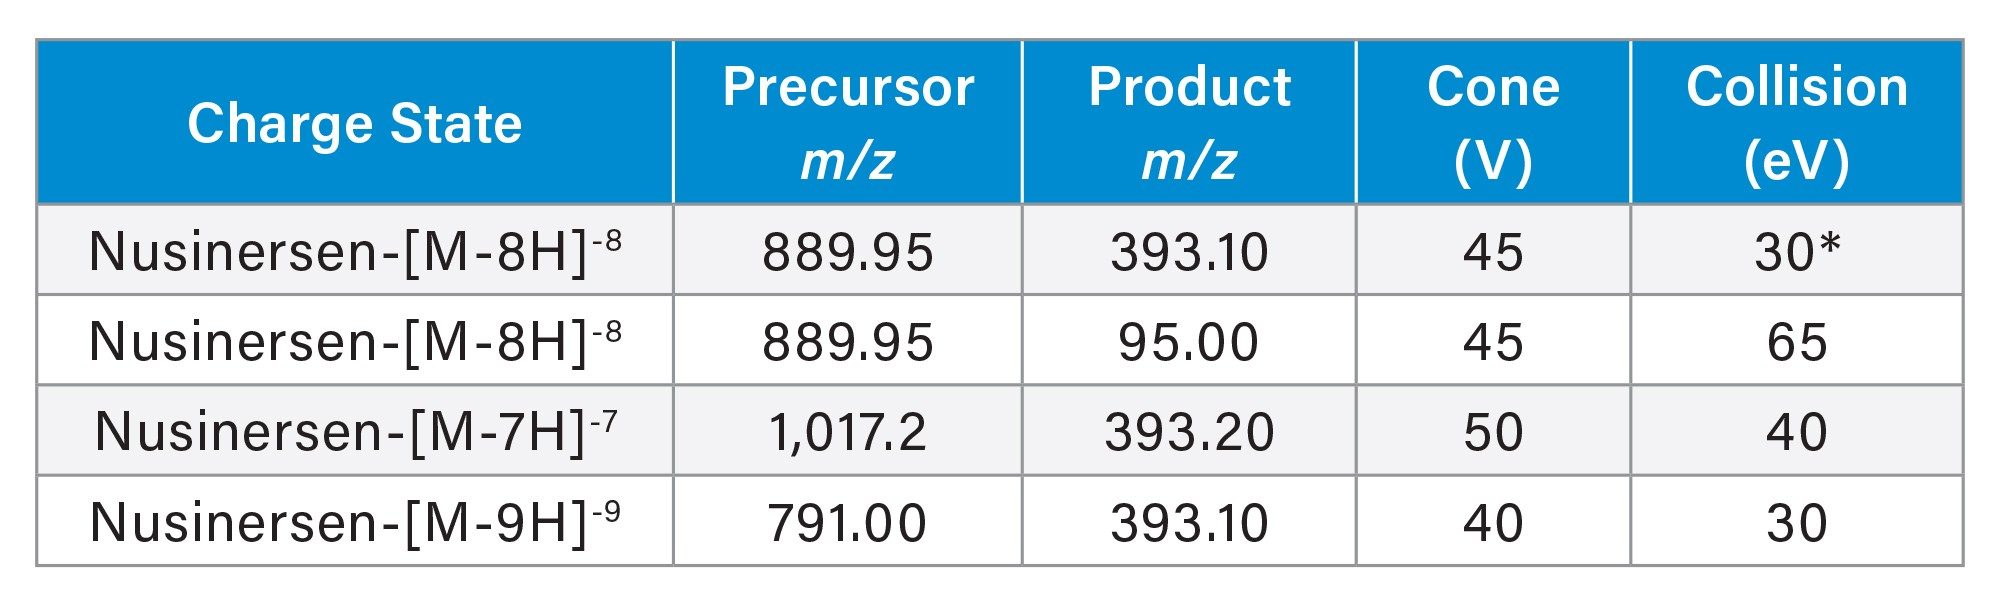
A Xevo TQ Absolute XR Mass Spectrometer was used to acquire the MS data (Table 4). The compound optimization, MRM method generation, data acquisition, quantification method generation, and data processing were managed using waters_connect Software (Table 5).
|
Ionization mode: |
ESI negative |
|
Capillary voltage (kV): |
2.5 kV |
|
Cone voltage (V): |
See Table 5 |
|
Collision energy (eV): |
See Table 5 |
|
Desolvation temperature (°C): |
600 |
|
Source temperature (°C): |
150 |
|
Desolvation gas flow (L/hr): |
1000 |
|
Cone gas flow (L/hr): |
150 |
Table 4. MS conditions.
Nusinersen MS Optimization
For the MS optimization, the nusinersen standard was prepared in DNase/RNase-free distilled water at 1 mg/mL. The source parameters were tuned by iterative LC-MS injection as well as by infusion of the analyte into the MS at the LC flow rate used for the analytical experiments (600 mL/min).
The molecular formula of nusinersen sodium is C234H323N61O128P17S17Na17. The [M-H]- ion generated from the free base has the elemental composition C234H340N61O128P17S17 (average MW 7127.21). The target charge state m/z for optimization was determined from the UNIFI™ integrated Mass Calculator and verified on the MS tune page in the system console. Following the development of the MRM method (Table 5), the source parameters were then optimized.
waters_connect Software
The waters_connect for Quantitation Software streamlined and simplified the individual steps required to develop an LC-MS method, including optimization of the MRM transitions with automatic generation of the quantitative processing method directly from the MS acquisition method. The source conditions, including ESI capillary voltage, desolvation source temperatures, and gas flows, were optimized using the Method Group function in the Acquisition Method Editor. Data review efficiency was increased using the exception focused review approach inherent in the data evaluation process in MS Quan.
Results and Discussion
SPE Method Development
OligoWorks SPE Kits are versatile, broadly applicable, and highly automation-friendly sample preparation tools, which provide pre-measured, lot-traceable reagents optimized for precise and reliable LC-MS quantification of oligonucleotide therapeutics from biological matrices such as plasma, urine, and organ tissue. The protocol is designed for retention and elution of a variety of oligonucleotides. The Proteinase K pretreatment step provides highly efficient disruption of oligonucleotide to biomatrix protein binding. A mixed-mode weak anion exchange (WAX) solid phase extraction (SPE) purification in the microplate format provides enhanced recovery, selectivity, and sample concentration with an MS-compatible eluate, eliminating the need for sample evaporation and reconstitution prior to LC-MS analysis.
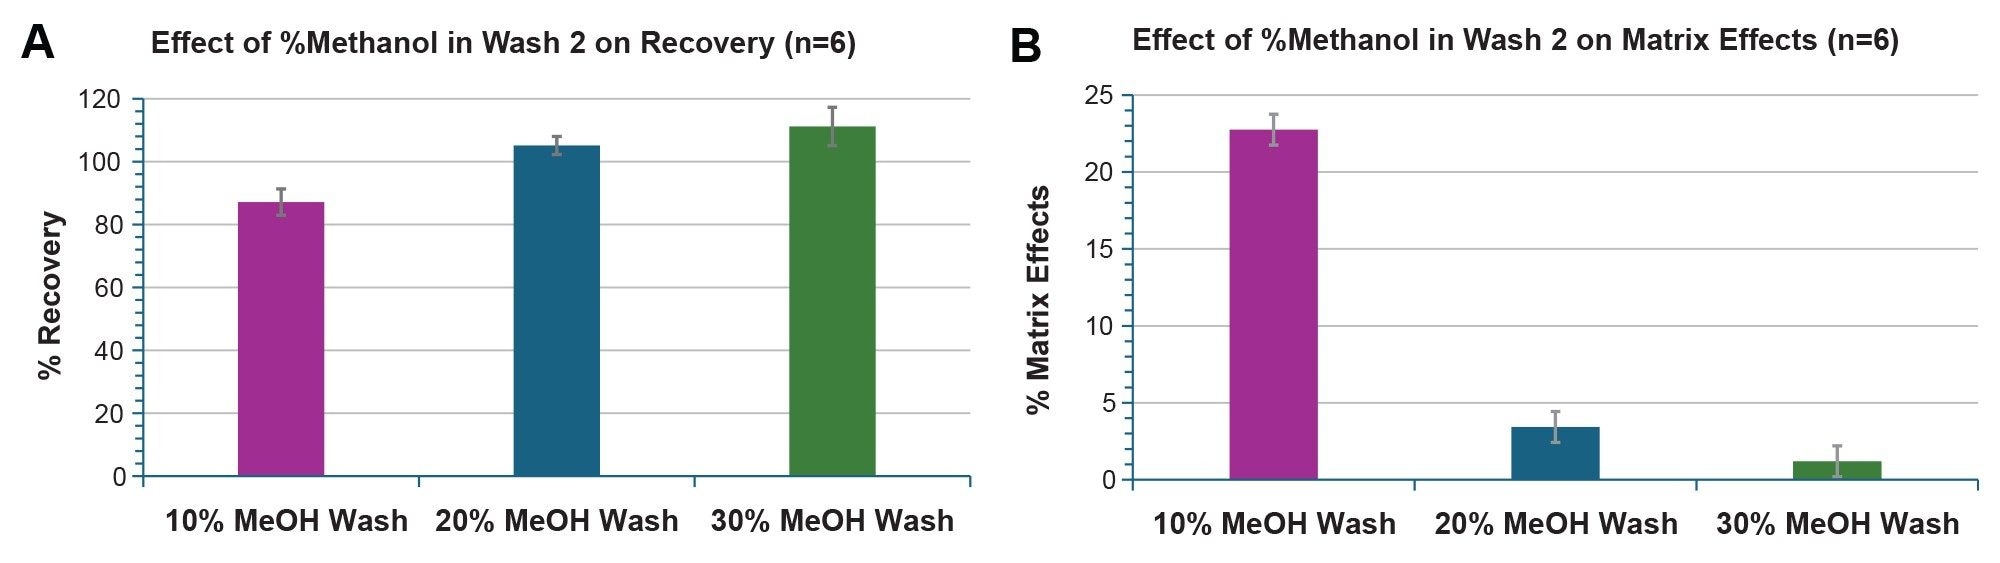
The extraction recovery of nusinersen from plasma was evaluated by comparing the analyte response in pre-spiked plasma with that of the equivalent analyte concentration post-spiked into extracted blank plasma (n=6). The matrix effects were evaluated by comparing post-spiked extracted plasma with the response for the same concentration of analyte in the final SPE eluent in the absence of matrix (n=6).
To optimize the matrix effects and recovery of nusinersen from rat plasma, the % methanol in wash 2 was evaluated using 10%, 20% and 30% methanol in water, which is the recommended starting composition in the OligoWorks Kit. Bar charts summarizing the recovery (A) and matrix effects (B) experiments are shown in Figure 2. When 10% methanol was used in wash 2, >80% recovery was achieved, and the matrix effects were 22%. Increasing the % methanol in the wash solvent to 30% resulted in matrix effects of <2% and recoveries >100%. These results were determined based on 6 replicate measurements for each wash solvent evaluated with <5.5% %RSD for all recovery experiments and SD of <5.0 for all matrix effects experiments. Thereafter, a wash solvent containing 30% methanol was used for further quantitative measurements.
LC-MS/MS Method Development
Figure 3A shows the distribution of charge states observed using the MS and LC experimental conditions. The base peak observed in the spectrum was at m/z 890, corresponding to the most abundant charge state [M-8H]8-. The spectrum from the targeted MS/MS of m/z 890 is shown in Figure 3B. The MRM transitions were evaluated across multiple precursor charge states and product ions. During LC-MS method development, several MRM transitions were evaluated by LC-MS injection for their S/N in the extracted matrix as well as matrix interferences.
![(A) MS spectrum following an MS scanning experiment (50-1950 amu) showing the charge states of the nusinersen standard. (B) Targeted MS/MS of m/z 890, the [M-8H]8- charge state showing the product ion spectrum obtained](/content/dam/waters/en/app-notes/2025/720009128/720009128en-f3.jpg.82.resize/img.jpg)
MRM Specificity and Signal-to-Noise
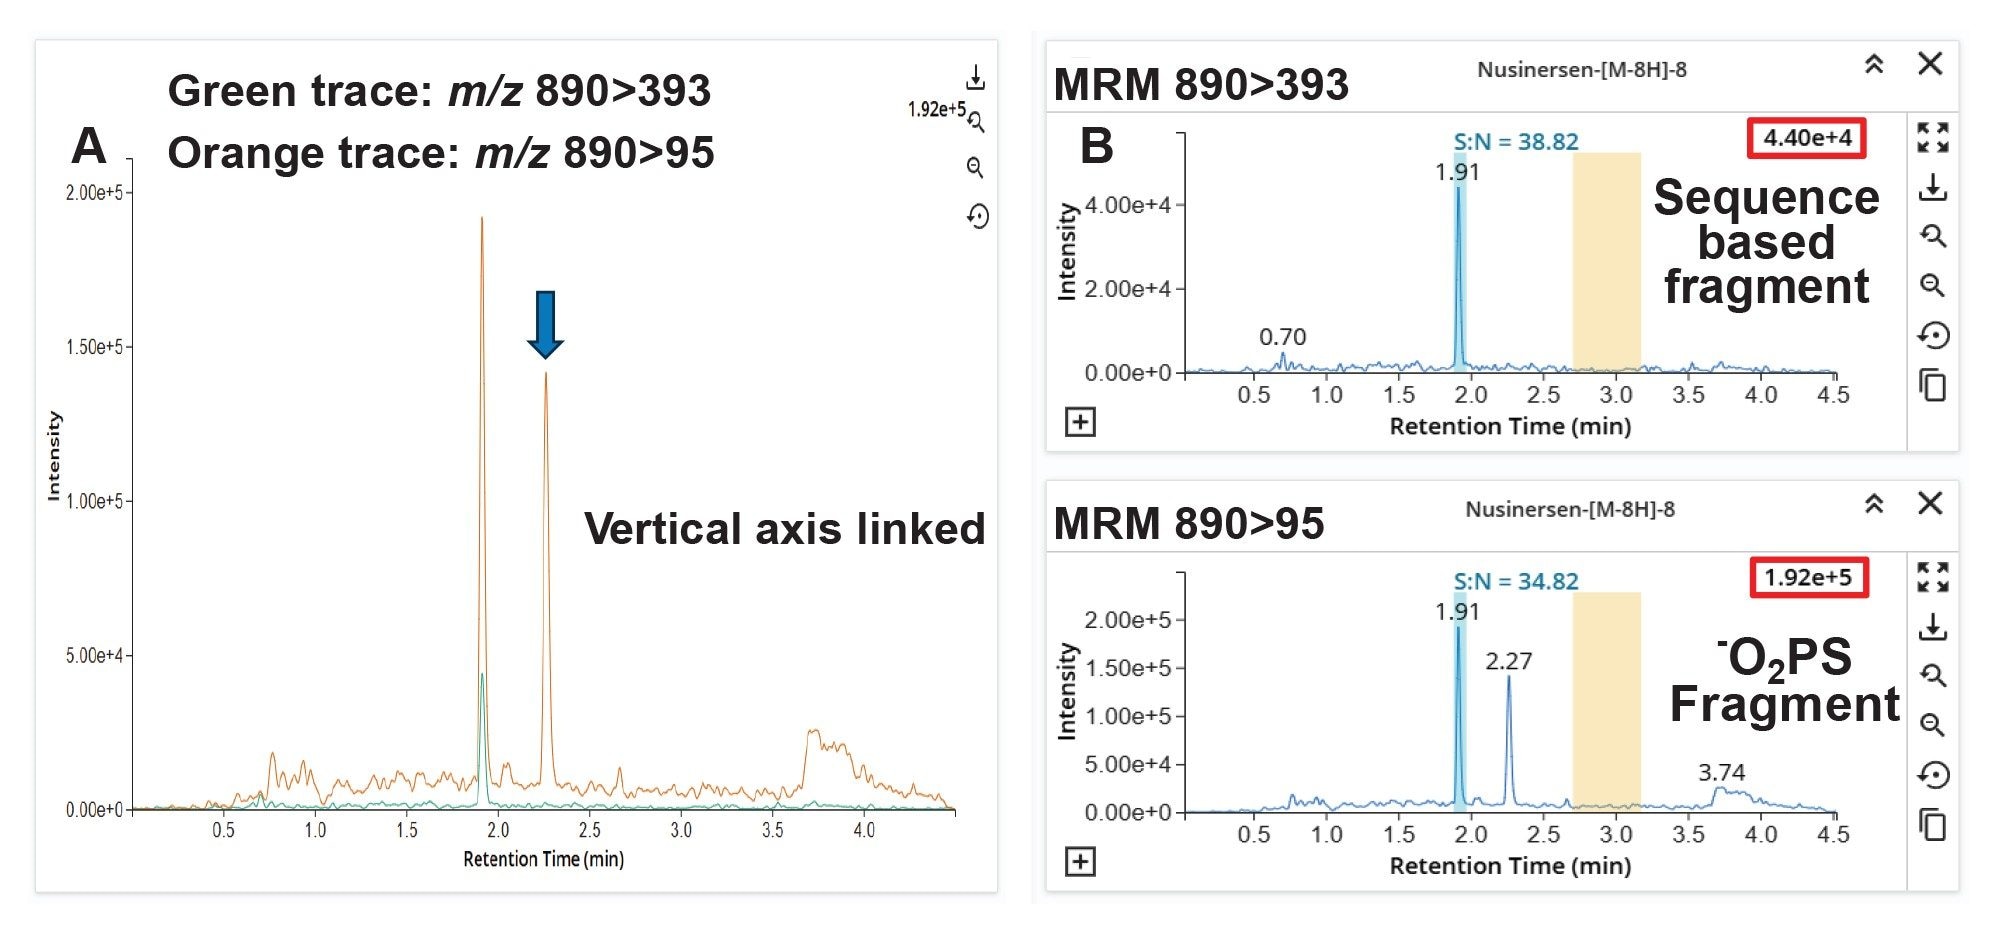
In Figure 3B, the base peak in the spectrum resulting from the MS/MS of m/z 890, is a fragment with m/z 95 (-O2PS). The second most abundant fragment observed is m/z 393 (sequence-based fragment).
When the 890>95 MRM transition (orange trace) is observed in the LC-MS analysis, the intensity is greater when compared to the 890>393 (green trace) (Figure 4A). A comparison of the S/N shows both channels are analogous (Figure 4B). The m/z 95 represents a diagnostic fragment of phosphorothioated oligonucleotides (-O2PS).29–31 Two chromatographic peaks were observed in the 890>95 transition, versus a single peak at the tR of nusinersen at 1.91 min in the 890>393 trace, indicating the increased specificity of this MRM transition in the plasma matrix.
Bioanalytical Quantitation and Data Analysis using waters_connect for Quantitation Software
The waters_connect Software coordinates the method optimization, data acquisition, processing, review, and reporting of LC-MS/MS data. All quantitative data were processed and evaluated using the MS Quan Application within the waters_connect ecosystem. The data are presented in such a way to display exceptions to rules that are set in the processing method (i.e., deviations must be <15%, R2 must be <0.99), allowing for faster interpretation and reporting of results.
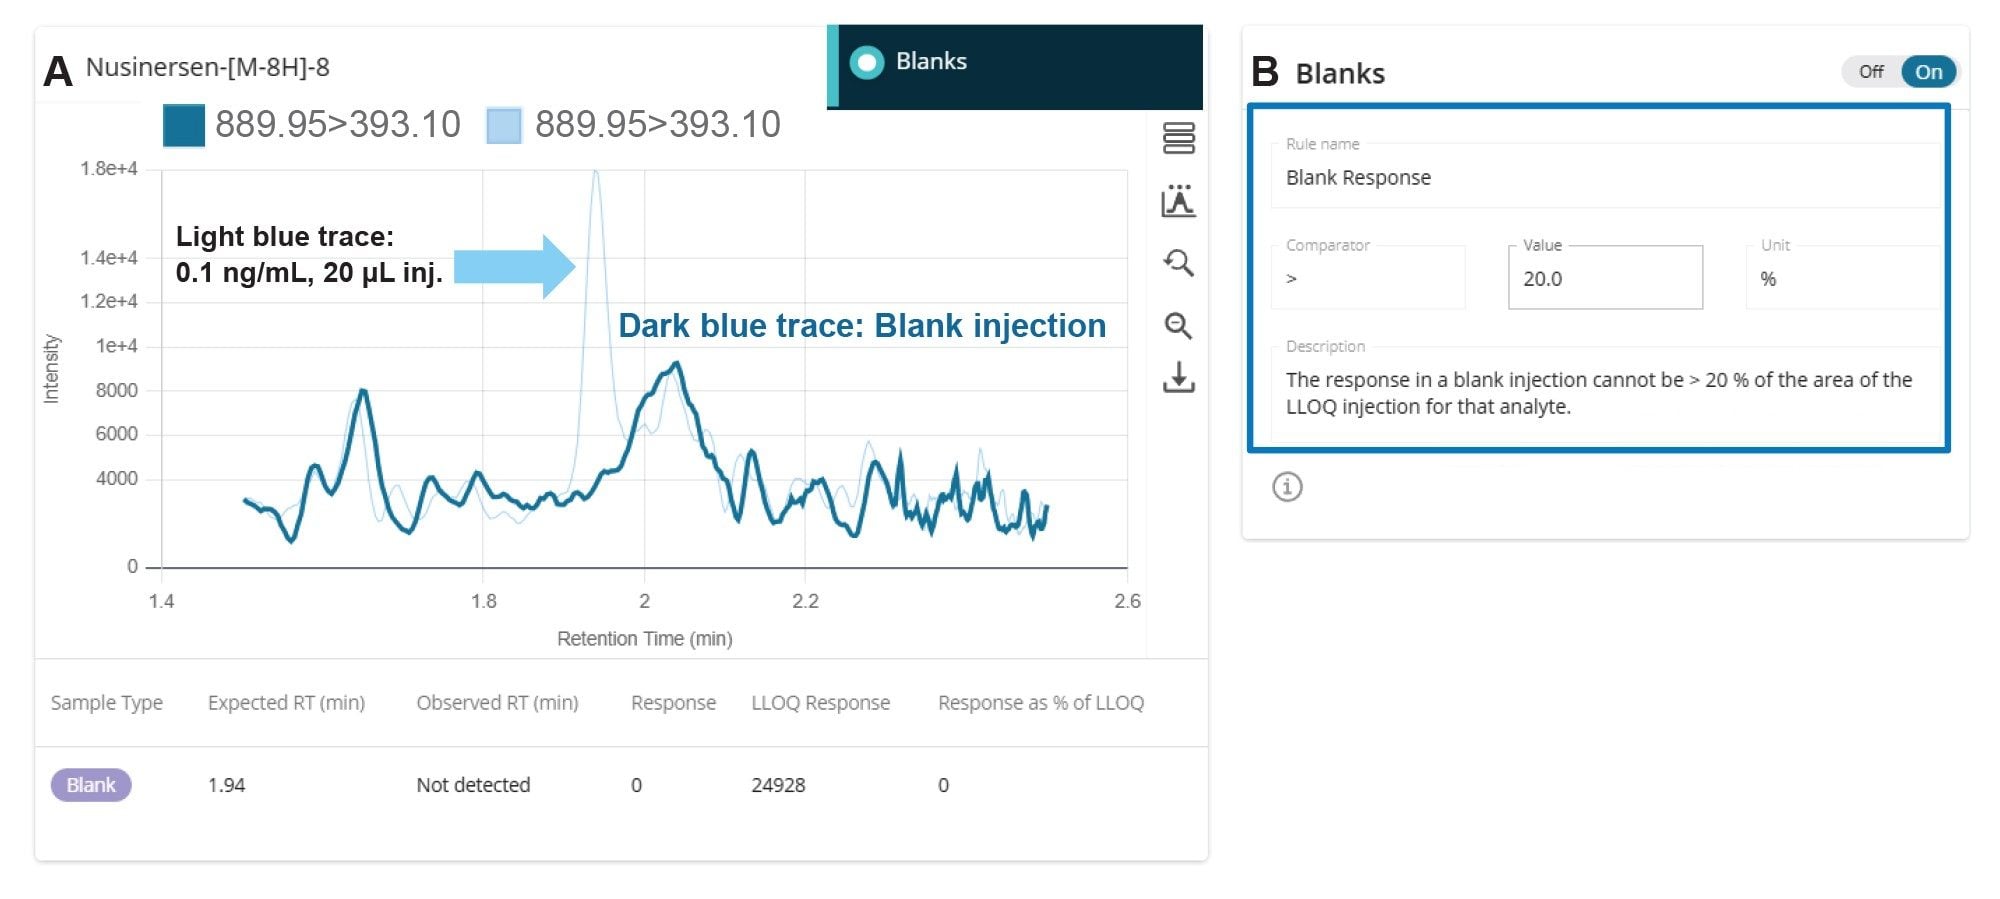
A weighted least squares regression model with 1/x weighting was used to establish the nusinersen concentration and peak area relationship. No internal standard was used. For the calibration standards and QC samples, the waters_connect Rule Set shown in Figures 5A and 5B, was configured to accept less than +/- 20% concentration deviation at the LLOQ and < +/- 15% deviation across the remainder of the calibration points. The acceptable R2 value, configured in the Rule Set, was set to a minimum of 0.99 (Figure 5C). The blank response was set to be less than 20% of the LLOQ (Figure 5D).
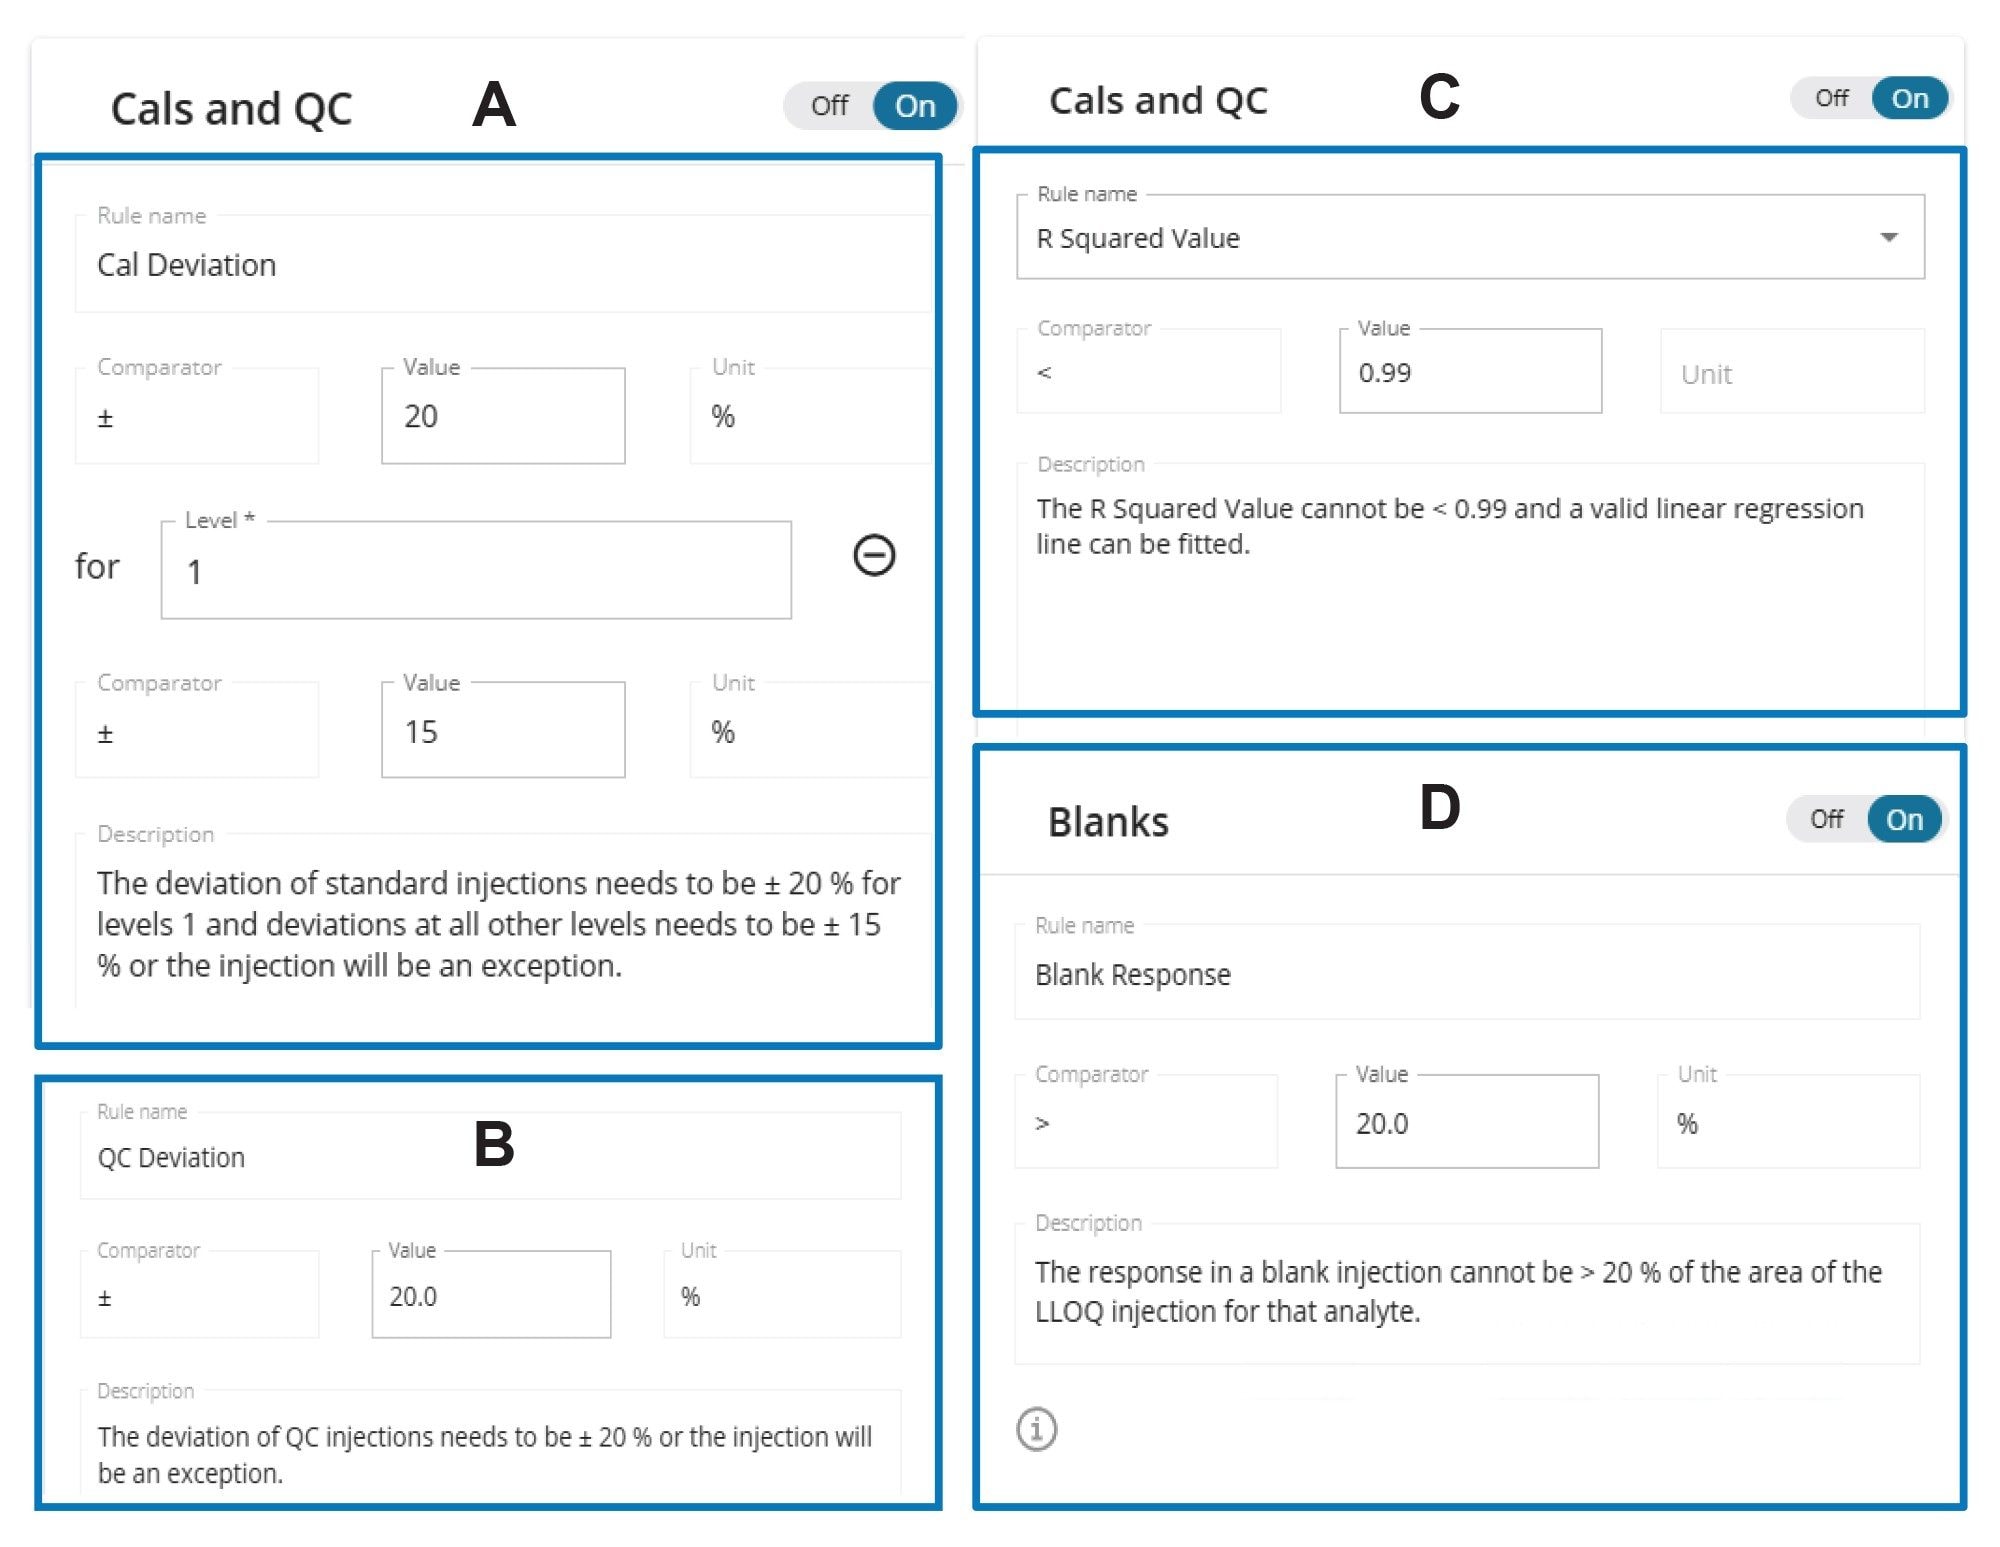
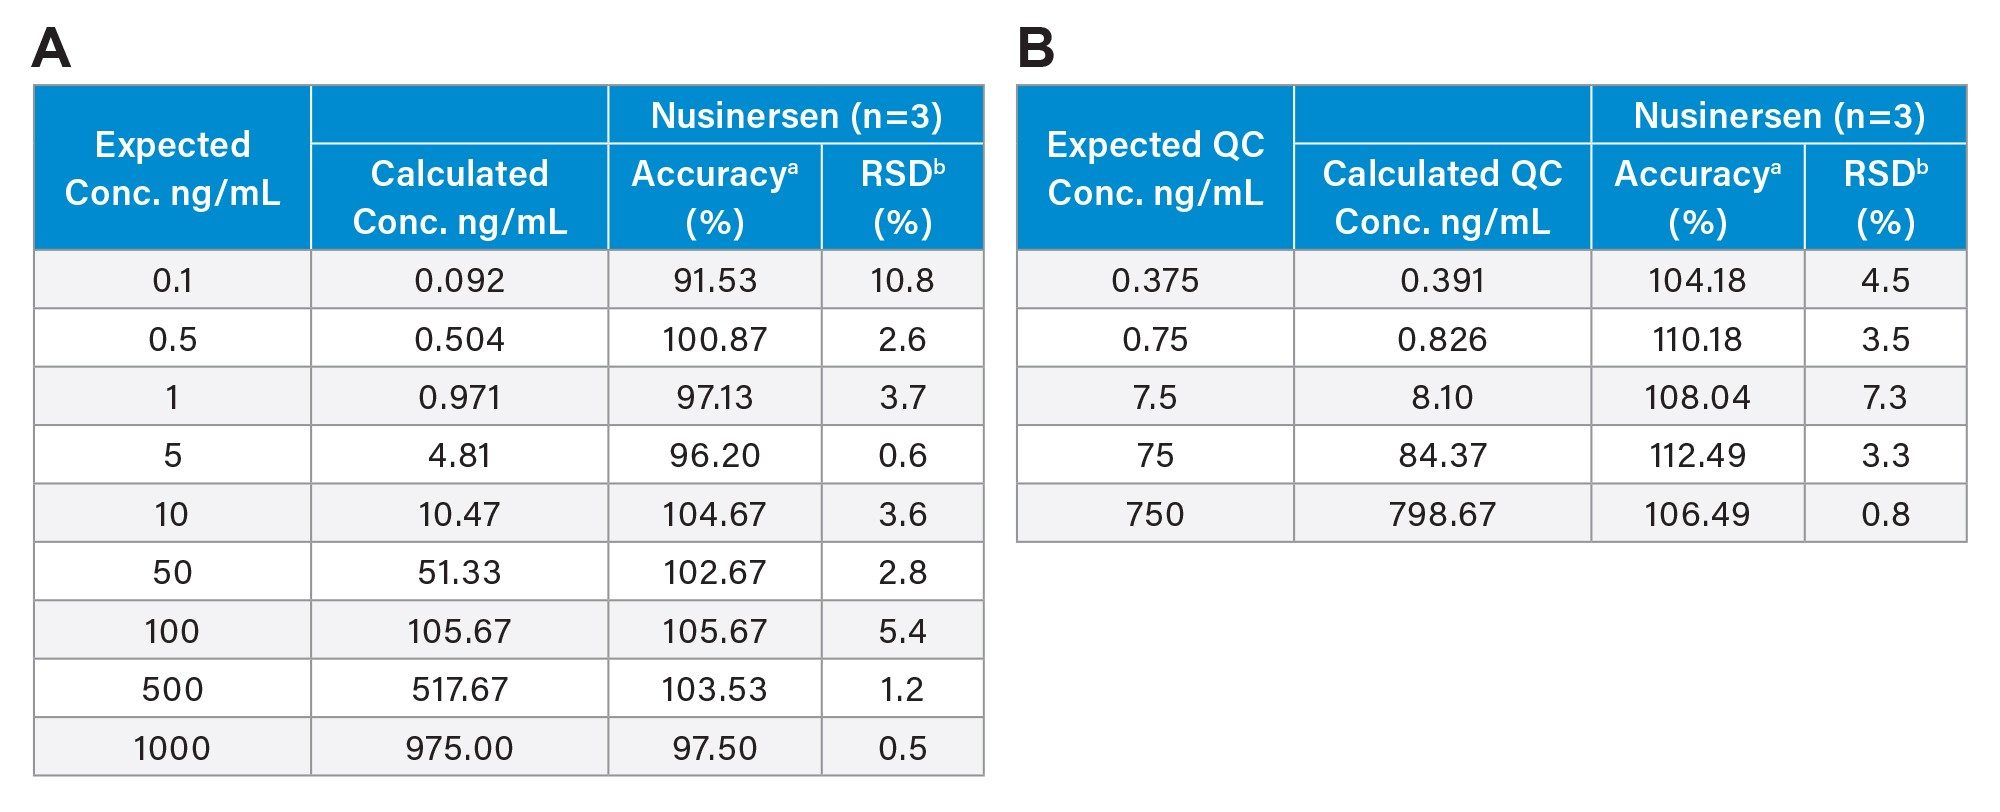
Figure 6 shows the calibration curves (n=3) plotted from 9 calibration points over the range 0.1-1000 ng/mL of nusinersen in rat plasma (R2 0.9988, 1/x weighting), demonstrating 4 orders of magnitude in dynamic range. Each of the 3 replicate calibration points and QCs were processed in individual wells of the SPE plate. Accuracy and precision were evaluated at each concentration level as well as using 5 QC points (n=3). LQC1: 0.375 ng/mL, LQC2: 0.75 ng/mL, MQC1: 7.5 ng/mL, MQC2: 75 ng/mL and HQC 750 ng/mL.
There are no exceptions flagged in the curve and QCs, indicating the data passes the acceptance criteria established in the Rule Set (Figure 5A-D).
![(A) Linearity of the nusinersen extracted plasma curves (n=3) resulting from 0.1-1000 ng/mL ([M-8H]8-, 890>393 MRM transition) demonstrating 4 orders of magnitude in dynamic range. (R2 0.9988, 1/x). (B) the concentration deviation. (C) QC points](/content/dam/waters/en/app-notes/2025/720009128/720009128en-f6.jpg.82.resize/img.jpg)
The QCs can easily be reviewed at each level in the software interface. Chromatographic data for LQC1 are shown in Figure 7A. The expected and observed tR, response, calculated concentration, % deviation, and S/N for each QC replicate are displayed in the table (7B). Statistical criteria, including number of injections, mean, standard deviation, % RSD, and bias can be accessed from the QC data icon displayed above the QC chart and can be downloaded as a CSV file, as shown in Table 6.
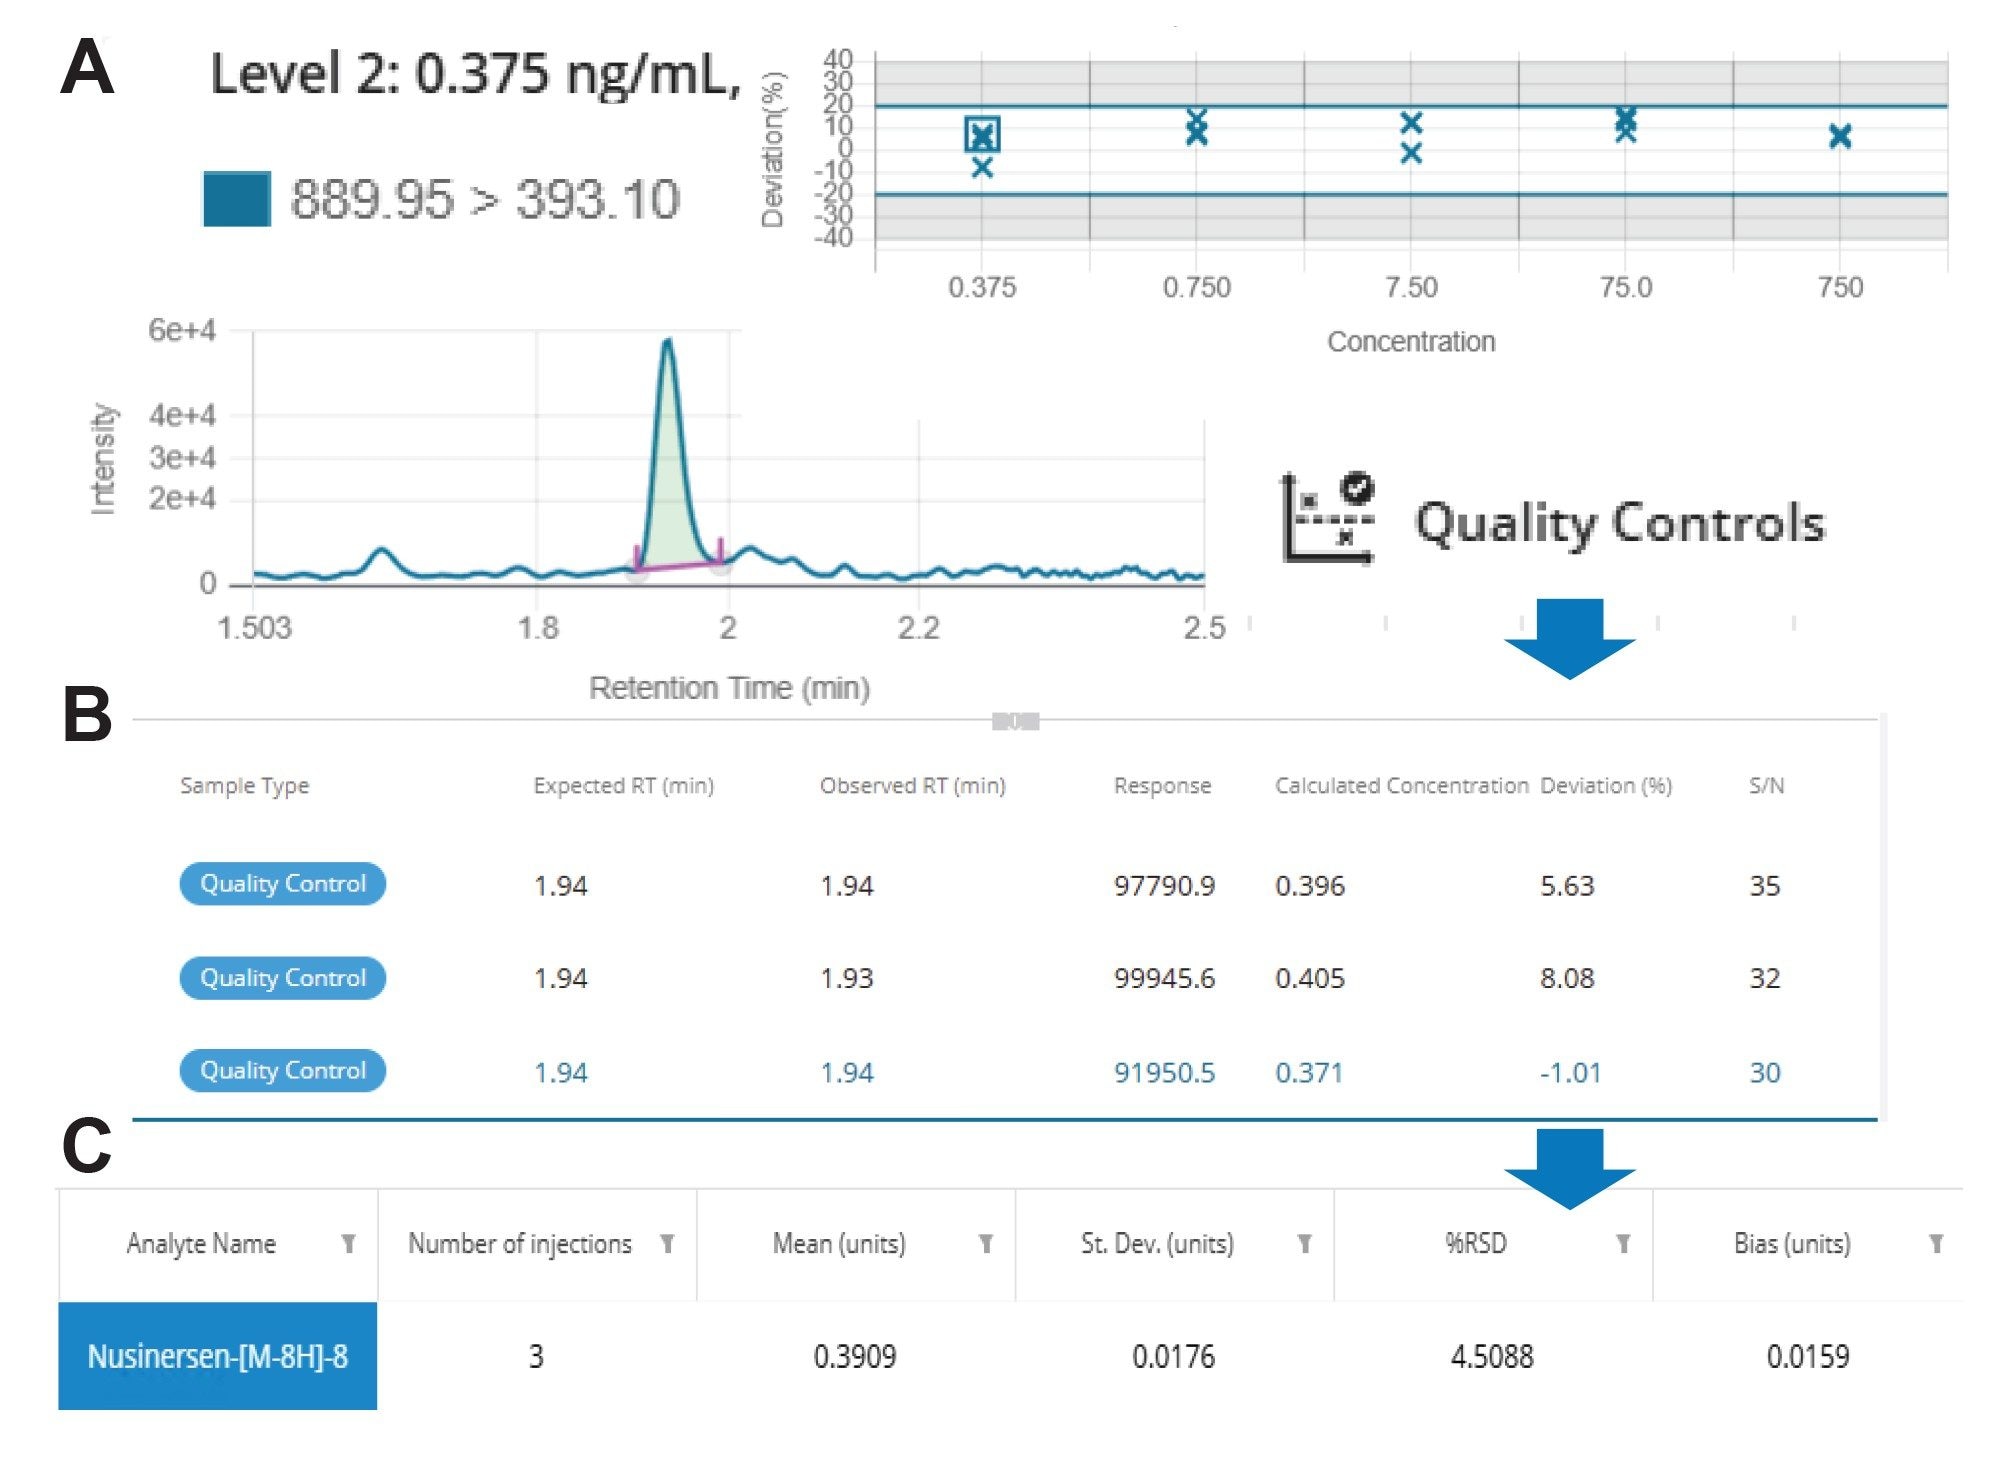
The statistical data for the QC tR mean, tR standard deviation, tR %RSD, and tR bias are also recorded (data not shown).
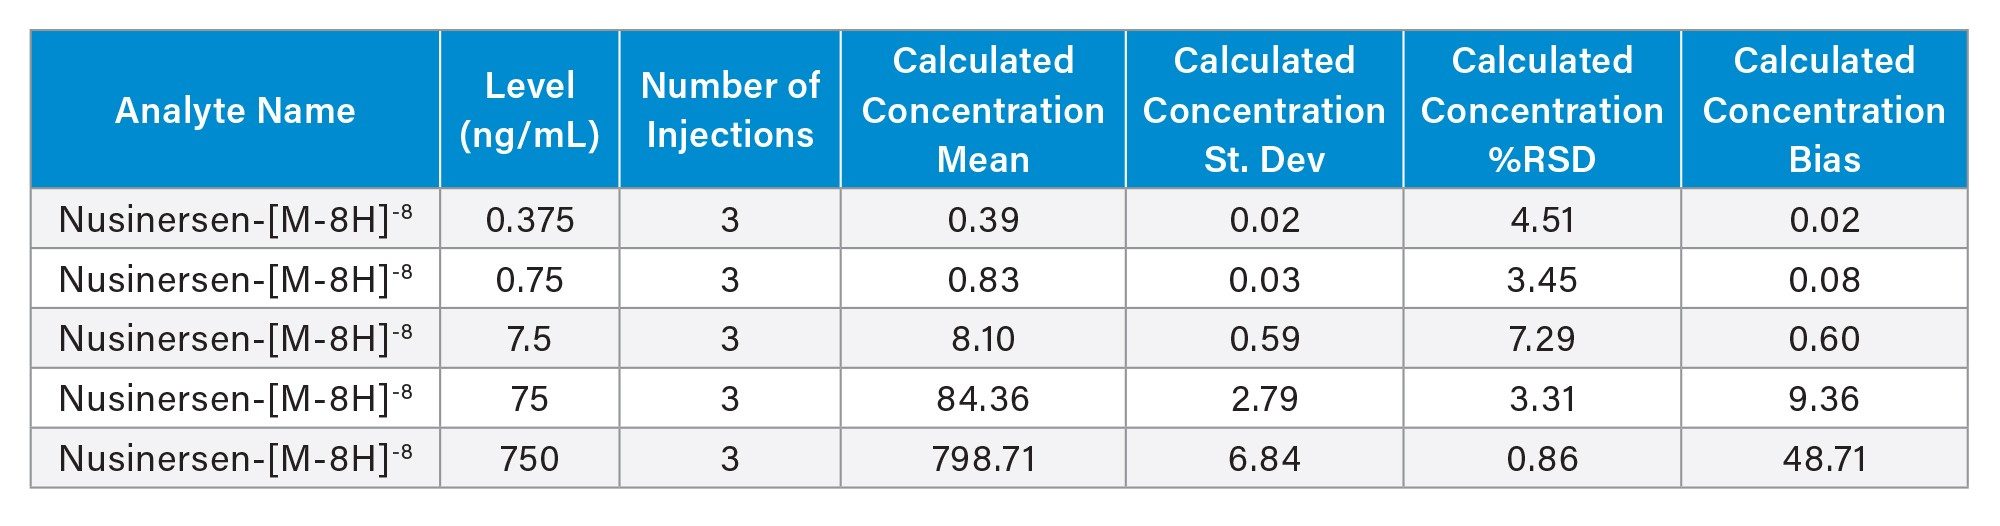
Calibration and QC performance for the nusinersen assay are reported in Table 7, with mean accuracies between 91.5–105.7% and 104.2-112.5 for the calibration points and QCs, respectively, and CVs between 0.5-10.8 and –0.8-7.3%.
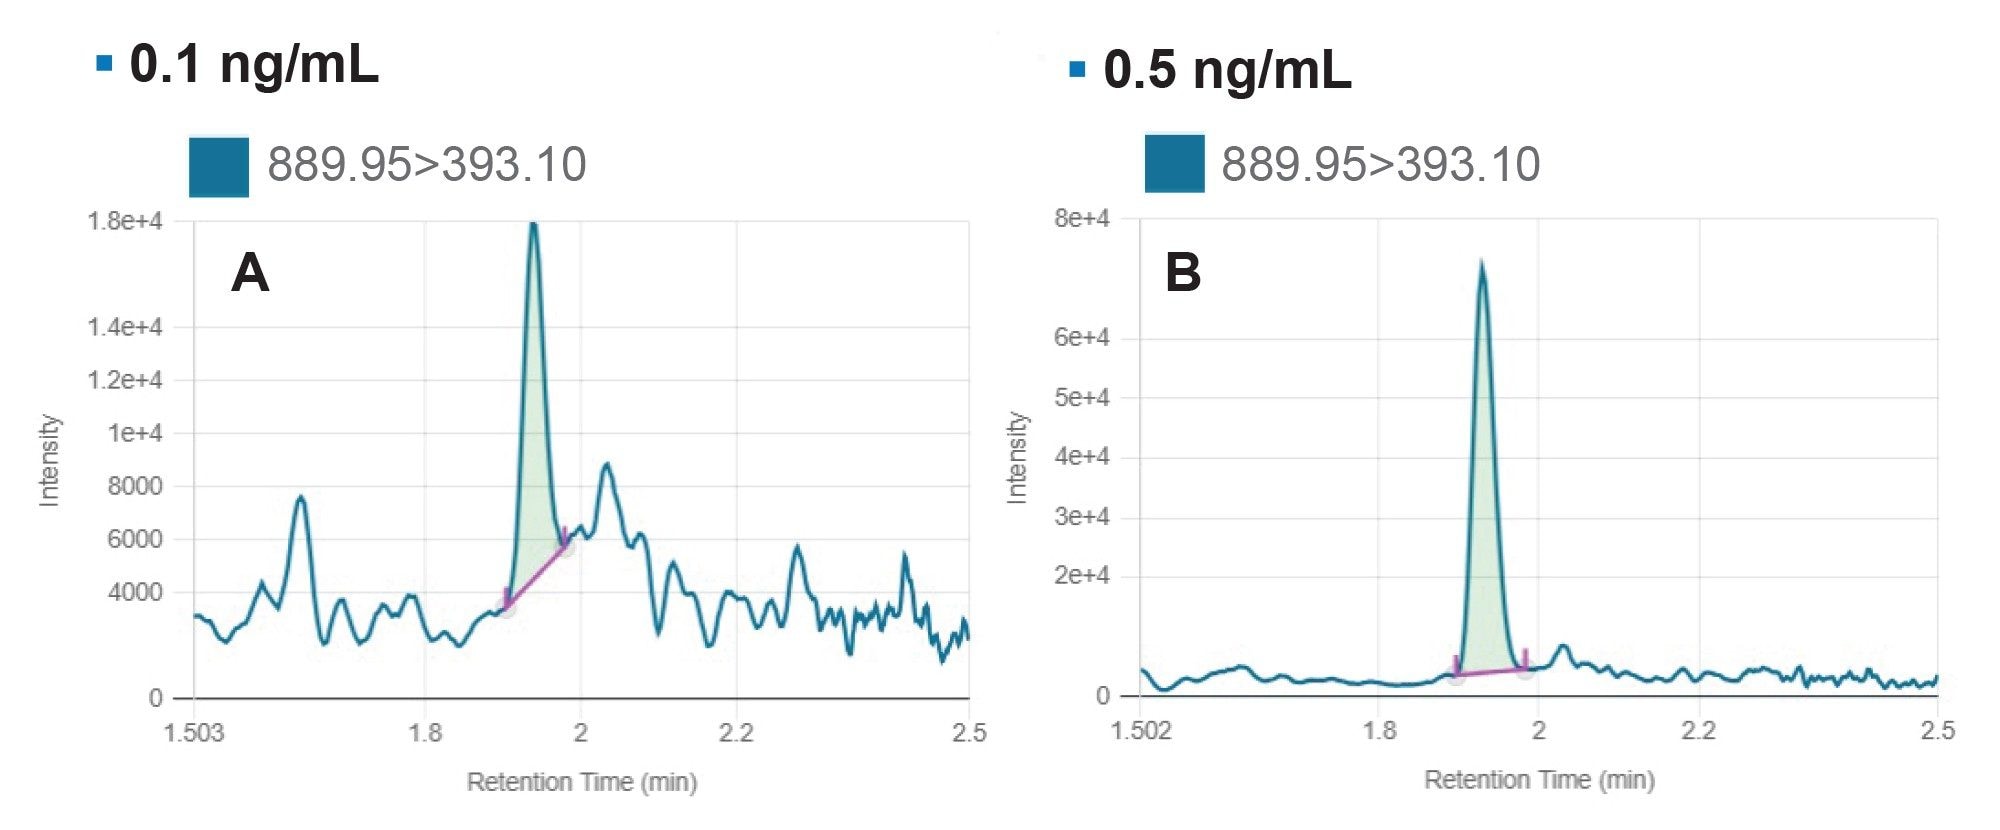
The lowest calibration points tested in the curve, shown in Figure 8, were 0.1 ng/mL and 0.5 ng/mL, using a 20 µL injection. The blank response can be assessed using the Blank Review feature in the waters_connect Software. For facile review, the lowest level calibration standard is superimposed with the plasma blank as shown in Figure 9A. As described previously, the Rule Set controls the assay acceptance criteria (Figure 5). The maximum acceptable blank response expressed as a % of the LLOQ was set to <20% (Figure 9B). In the blank rat plasma injection, no signal was found at the tR for nusinersen.
Conclusion
- The developed IP-RP-LC/MRM method was used for the quantitative determination of nusinersen in rat plasma, demonstrating sub ng/mL levels of sensitivity and four orders of linear dynamic range.
- This application note details the reproducible, efficient sample pretreatment and extraction of nusinersen from rat plasma using 30% methanol in the SPE wash.
- The ACQUITY Premier System and the Oligonucleotide BEH C18 Column are designed to mitigate nonspecific binding and absorption to metallic surfaces, enabling excellent sensitivity and low-level detection.
- The Xevo TQ Absolute XR Mass Spectrometer generates high-quality data for routine LC-MRM-based quantitation of ASOs in biological matrices.
- This analytical methodology and software are suitable for labs needing to analyze biological samples to increase analytical efficiency and reduce the method development and data processing burden.
References
- Takakusa, H., et al. (2023). Drug Metabolism and Pharmacokinetics of Antisense Oligonucleotide Therapeutics: Typical Profiles, Evaluation Approaches, and Points to Consider Compared with Small Molecule Drugs. Nucleic Acid Ther 33(2): 83–94.
- Yuan, L., et al. (2023). A Novel Hybridization LC-MS/MS Methodology for Quantification of siRNA in Plasma, CSF and Tissue Samples. Molecules 28(4).
- Liu, A., et al. (2022). Bioanalysis of Oligonucleotide by LC–MS: Effects of Ion Pairing Regents and Recent Advances in Ion-Pairing-Free Analytical Strategies. International Journal of Molecular Sciences 23(24): 15474.
- Damase, T. R., et al. (2021). The Limitless Future of RNA Therapeutics. Frontiers in Bioengineering and Biotechnology Volume 9–2021.
- Hayashi, Y. and Y. Sun (2024). Overcoming Challenges in Oligonucleotide Therapeutics Analysis: A Novel Non-ion Pair Approach. Journal of The American Society for Mass Spectrometry 35(9): 2034–2037.
- McCarthy, S. M., Pourshahian, S. (2011). Chapter 4. Analysis of Oligonucleotides by Liquid Chromatography and Mass Spectrometry. Handbook of Analysis of Oligonucleotides and Related Products CRC Press. Edited by Bonillia, J.V., and Drivasta, S.G.
- Azarani, A. and K. H. Hecker (2001). RNA Analysis by Ion-Pair Reversed-Phase High Performance Liquid Chromatography. Nucleic acids research 29 2: E7.
- McGinnis, A. C., et al. (2012). Chromatographic Methods for the Determination of Therapeutic Oligonucleotides. J Chromatogr B Analyt Technol Biomed Life Sci 883–884: 76–94.
- Guimaraes, G. J. and M. G. Bartlett (2021). The Critical Role of Mobile Phase pH in the Performance of Oligonucleotide Ion-Pair Liquid Chromatography–Mass Spectrometry Methods. Future Science OA 7(10): FSO753.
- Donegan, M., et al. (2022). Effect of Ion-Pairing Reagent Hydrophobicity on Liquid Chromatography and Mass Spectrometry Analysis of Oligonucleotides. J Chromatogr A 1666:
- Hannauer, F., et al. (2022). Advancements in the Characterisation of Oligonucleotides by High Performance Liquid Chromatography-Mass Spectrometry in 2021: A short review. Anal Sci Adv 3(3-4): 90–102.
- Malarvannan, M., et al. (2024). Advances in Analytical Technologies for Emerging Drug Modalities and their Separation Challenges in LC-MS Systems. Journal of Chromatography A 1732: 465226.
- Nuckowski, Ł., et al. (2018). Review on Sample Preparation Methods for Oligonucleotides Analysis by Liquid Chromatography. Journal of Chromatography B 1090: 90–100.
- Geary, R. S., et al. (2015). Pharmacokinetics, Biodistribution and Cell Uptake of Antisense Oligonucleotides. Advanced Drug Delivery Reviews 87: 46–51.
- Geary, R. S. (2009). Antisense Oligonucleotide Pharmacokinetics and Metabolism. Expert Opin Drug Metab Toxicol 5(4): 381–391.
- Yu, R. Z., et al. (2004). Tissue Disposition of 2'-O-(2-methoxy) Ethyl Modified Antisense Oligonucleotides in Monkeys. J Pharm Sci 93(1): 48–59.
- Chen, B. and M. G. Bartlett (2013). Evaluation of Mobile Phase Composition for Enhancing Sensitivity of Targeted Quantification of Oligonucleotides using Ultra-High Performance Liquid Chromatography and Mass Spectrometry: Application to Phosphorothioate Deoxyribonucleic Acid. J Chromatogr A 1288: 73–81.
- Zhang, X., et al. (2024). Development and Validation of an HILIC/MS/MS Method for Determination of Nusinersen in Rabbit Plasma. Heliyon 10(10): e31213.
- Xu, T., et al. (2025). Development and Validation of an LC–MS/MS Assay for Quantitative Analysis of Nusinersen in Human CSF and Plasma. Biomedical Chromatography 39(7): e70138.
- Tanna, N., Lee, M., Trudeau, M., (2023) An Automated, Standardized, Kit-Based Sample Preparation Workflow for Bioanalytical Quantification of Therapeutic Oligonucleotides.
- Araya, M., Trudeau, M., Addepalli, B., Lauber, M.A. (2025) Improved Bioanalytical Extraction of Therapeutic Antisense Oligonucleotides, Including a Lipid Conjugated ASO From Liver and Brain Tissue Using the OligoWorks™ SPE Microplate Kit.
- Chiriboga, C. A., et al. (2016). Results From a Phase 1 Study of Nusinersen (ISIS-SMN(Rx)) in Children with Spinal Muscular Atrophy. Neurology 86(10): 890–897.
- Oligonucleotide Separation Technology Standard Care and Use Manual | Waters
- IonHance HFIP Care & Use Manual | Waters
- Integrated DNA Technologies Resuspension Calculator https://www.idtdna.com/Calc/resuspension/
- OligoWorks SPE Kits and Components | Waters
- Guimaraes, G. J., et al. (2023). Mobile Phase Aging and Its Impact on Electrospray Ionization of Oligonucleotides. Journal of The American Society for Mass Spectrometry 34(12): 2691–2699.
- Take Separations to the Max with MaxPeak Premier Columns
- Huang, M., et al. (2021). Analytical Characterization of DNA and RNA Oligonucleotides by Hydrophilic Interaction Liquid Chromatography-Tandem Mass Spectrometry. J Chromatogr A 1648: 462184.
- Kilanowska, A., et al. (2020). Application of Hydrophilic Interaction Liquid Chromatography Coupled with Tandem Mass Spectrometry for the Retention and Sensitivity Studies of Antisense Oligonucleotides. Journal of Chromatography A 1622: 461100.
- Studzińska, S., et al. (2017). Application of Hydrophilic Interaction Liquid Chromatography Coupled with Mass Spectrometry in the Analysis of Phosphorothioate Oligonucleotides in Serum. Journal of Chromatography B 1040: 282–288.
Featured Products
720009128, November 2025