Method Development of Orlistat Forced Degradation Sample using MaxPeak™ Premier Columns and QDa™ Mass Detection
Abstract
New drug development requires a variety of testing to ensure safety for the consumer. From bioavailability studies to stability studies, a wide range of information is needed about the drug and how it works before it can be released. Often during development, it is necessary to perform forced degradation studies to better understand how the compound breaks down under stressed conditions. This not only provides vital information into the stability of the molecule, but also gives insight into the degradants found, which can be subsequently studied for potential issues. During these forced degradation studies, it is important to develop a robust liquid chromatography (LC) method to fully separate the different degradants so that future work, such as isolation of the degradants, can be more easily performed.
This application note shows the method development process for a forced degradation study of orlistat, an FDA approved weight loss drug which inhibits pancreatic lipases, leading to potential weight loss when combined with diet and exercise. A total of 11 conditions were tested using five different stationary phases, two different strong solvents, acetonitrile, and methanol, and two mobile phase pHs. Final method conditions showed good resolution for most peaks including non-degraded orlistat using an ACQUITY™ Premier BEH™ C18 Column with methanol mobile phases at low pH. Method development was completed in just under two days for this sample.
Benefits
- Fast method development using the systematic screening protocol
- Good peak shape for all 14 compounds
- Baseline resolution of all detected degradants and orlistat main peak
Introduction
A variety of testing is needed when developing new drugs, including degradation studies to ensure any degradant formed is safe for the consumer while also testing overall stability of the molecule. Forced degradation studies are usually performed along storage stability studies, both attempting to gain information about the molecule under different conditions. In the case of forced degradation studies, the intent is to better understand the chemical stability of the molecule when subjected to conditions that promote hydrolysis, or peroxide degradation. Additionally, photolytic and thermal degradation are often included to check those degradation path ways as well. Storage stability testing is done under more realistic conditions where the final product is placed into typical storage conditions and tested after several months to ensure no degradation of the molecule is found. For either study, a robust LC method is needed to identify all degradants. Whether that identification uses specialized MS equipment, such as a High-Resolution Mass Spectrometer (HRMS), or identification via standard addition, having baseline resolution for all peaks is important to ensure accurate and reliable data generation.
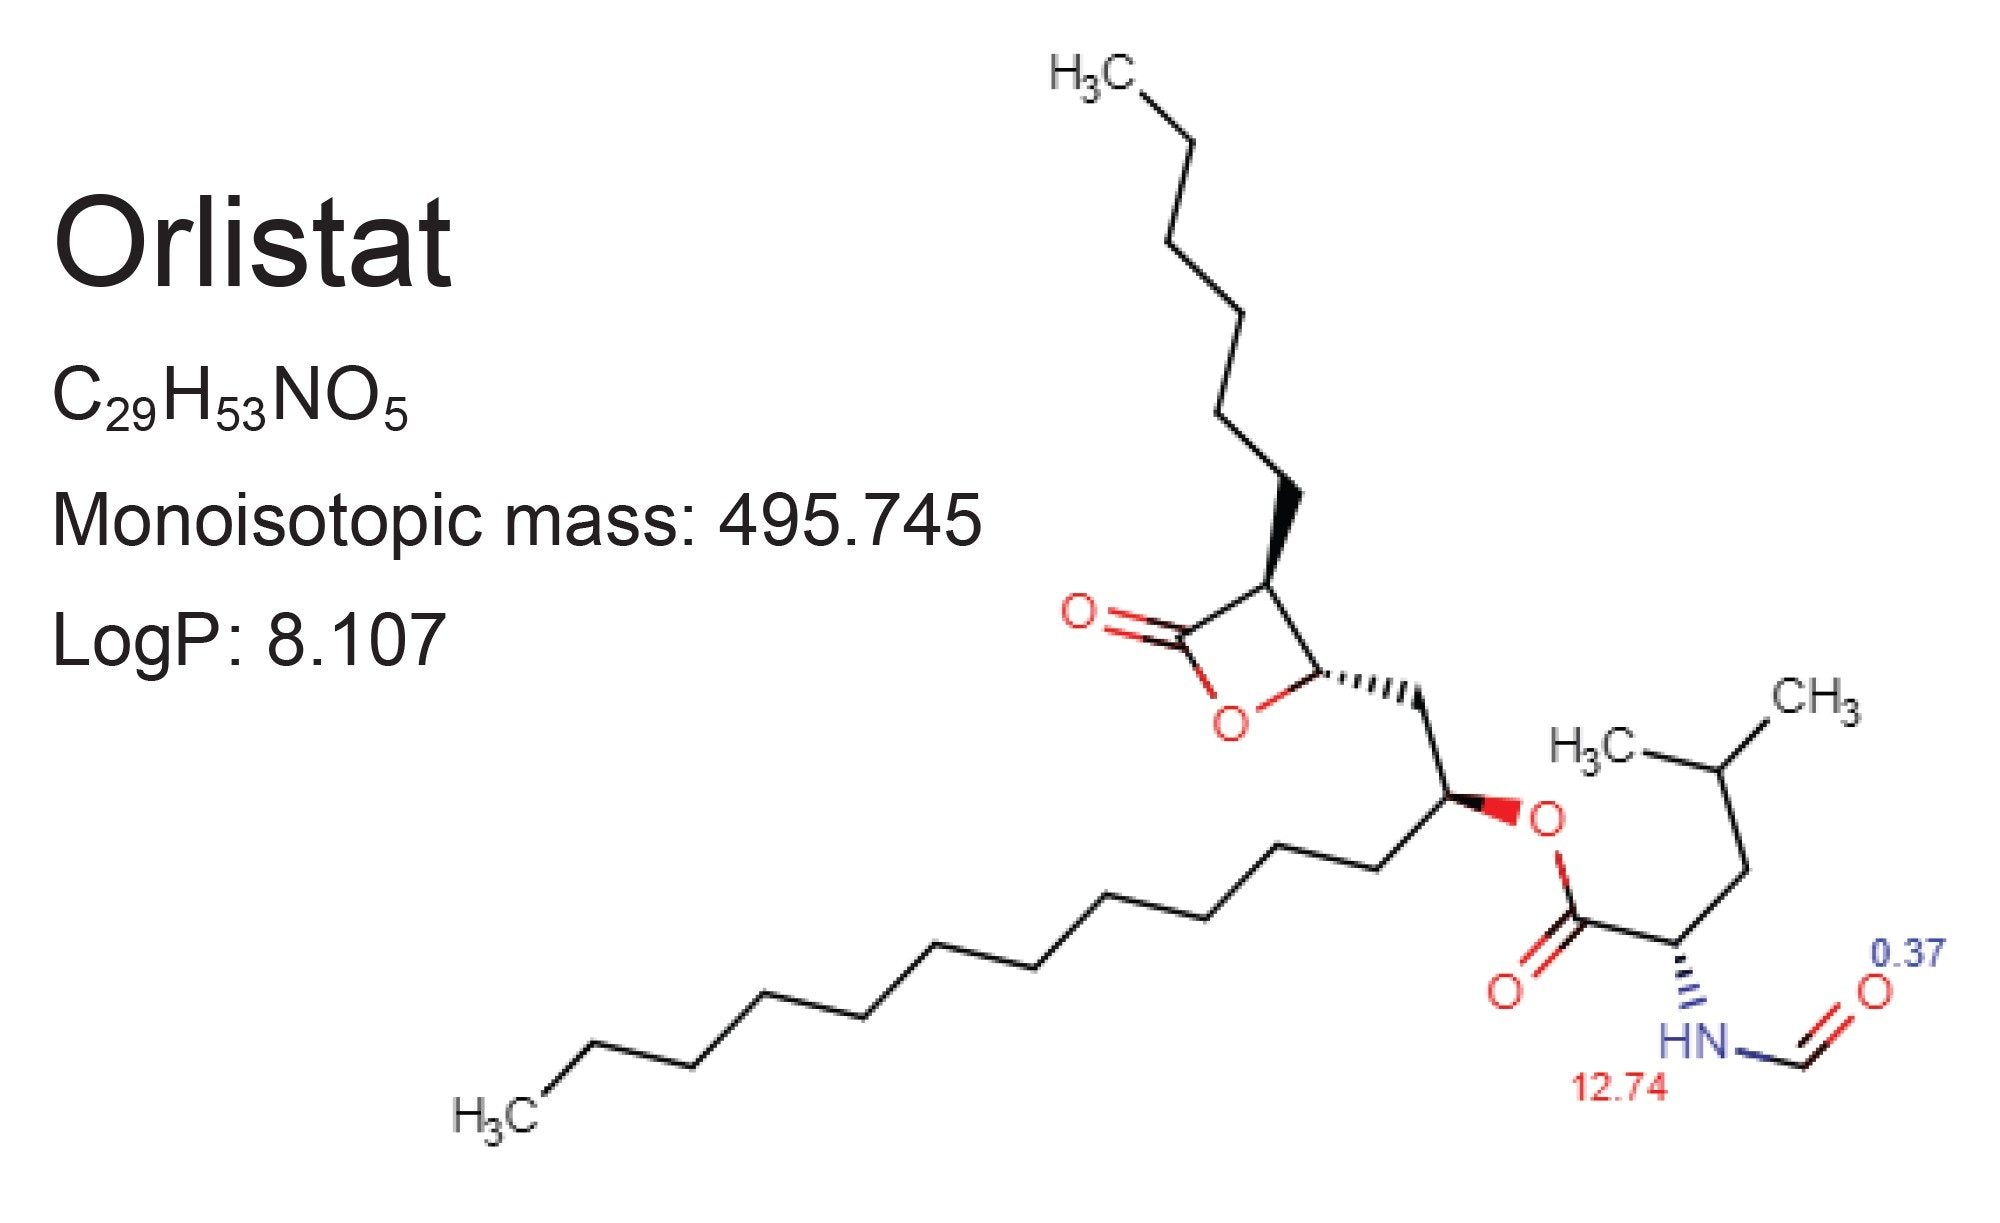
In this application note, a method was developed for the forced degradation study of orlistat, an FDA approved weight loss drug available over-the-counter as well as by prescription. Orlistat, shown in Figure 1, is a statin derivative that inhibits pancreatic lipases, preventing the breakdown of ingested fats causing them to be excreted and not absorbed into the body.1–2
The method was developed using a systematic screening protocol, which in the past has proven to be effective at developing new LC methods quickly and reliably.3–6 The systematic screening protocol guides users through specific steps of the method development process, eliminating the uncertainty that can come with method development. When this process is combined with MaxPeak Premier Columns utilizing MaxPeak High Performance Surfaces (HPS) Technology, the results are even more reliable. MaxPeak Premier Columns employ a specially designed column hardware that eliminates non-specific adsorption between analytes and metal surfaces found in the column.7–9 By eliminating these deleterious interactions, more reliable data can be generated. The benefits of this hardware are best seen on biomolecules, such as oligonucleotides and peptides, as well as some small molecules, such as nucleotides.10–12 However, these columns can also provide benefit for metal coordinating compounds, as well as formulated drug products.13–14 The use of these columns for forced degradation studies has shown benefit in the past and they were therefore used for this work as well.15–16
Experimental
Sample Description
A 1 mg/mL stock solution of orlistat was created using 71:29 acetonitrile:water. Forced degradation took place in three separate vials. For each vial, 1 mL of stock solution was added. For degradation, all samples were heated at 70 °C. For acid and base hydrolysis, 100 µL of 1 N HCl or 1 N NaOH was added. For thermal degradation, 100 µL of sample diluent was added. After allowing samples to sit at temperature for two hours, all three vials were combined to not only quench the acid and base degradation, but also to combine all degradants into a single sample. The sample was then analyzed, and degradants tracked by mass using the ACQUITY QDa Mass Detector.
Method Conditions
LC Conditions
|
LC system: |
ACQUITY UPLC H-Class Plus System with Quaternary Solvent Manager (QSM) with optional solvent select valve, Sample Manager Flow Through Needle (SM-FTN), Column Manager, Two Column Manager Auxs, and QDa Mass Detector |
|
Detection: |
MS full scan (ESI+) SIRs of degradants and API used as indicated |
|
Columns: |
ACQUITY Premier BEH C18, 2.1 x 50 mm, 1.7 µm (p/n: 186009452) ACQUITY Premier CSH™ Phenyl-Hexyl, 2.1 x 50 mm, 1.7 µm (p/n: 186009474) ACQUITY Premier HSS™ PFP, 2.1 x 50 mm, 1.7 µm (p/n: 186010036) ACQUITY Premier HSS T3, 2.1 x 50 mm, 1.7 µm (p/n: 186009467) ACQUITY Premier BEH Shield RP18, 2.1 x 50 mm, 1.7 µm (p/n: 186009497) |
|
Column temperature: |
30 °C |
|
Sample temperature: |
10 °C |
|
Injection volume: |
1.0 µL |
|
Flow rate: |
0.50 mL/min |
|
Mobile phase A: |
Milli-Q Water |
|
Mobile phase B: |
Acetonitrile |
|
Mobile phase C: |
Methanol |
|
Mobile phase D1: |
2% Formic acid in water |
|
Mobile phase D6: |
200 mM Ammonium hydroxide in water |
|
Screening gradient conditions: |
Constant 5% Dx maintained throughout gradient. Linear gradient of 5–95% B/C in 6.86 minutes, hold for 1.14 minutes. Return to 5% B/C and hold for 2.3 minutes. Total run time: 10.30 minutes. |
Data Management
|
Chromatography software: |
Empower™ 3 Feature Release 4 |
Results and Discussion
When utilizing the systematic screening protocol, each step is designed to answer a specific question. Prior to any testing, however, method goals must be set. These goals can be based on data, i.e., achieving baseline resolution for all peaks, or based on the need of the end user, for example having as short a run time as possible. These goals are set by the analyst and often align with laboratory best practices. For this work, the goals set are 1) having good peak shape as defined as USP tailing values between 0.8 and 1.2 and 2) baseline resolution for all peaks. Achieving these two goals ensures that any quantitation work can be performed easily and reliably as well as providing a good starting point for other activities such as method validation or transfer to another laboratory. Once goals are set, an analyst will know when the method development process can stop, preventing additional work to optimize an already acceptable method and actual testing can begin.
The first step of the systematic screening protocol is to test the sample at high and low pH using acetonitrile mobile phases and a C18 stationary phase which must be high pH stable. For this work, an ACQUITY Premier BEH C18 Column was selected as it is stable up to pH 12. The goal of this step is to determine at which pH the sample is best retained. Only analyte retention is assessed during this step to simplify the decision-making process. Figure 2 shows the separation of the forced degradation sample at high pH and low pH using ammonium hydroxide and formic acid mobile phases, respectively.
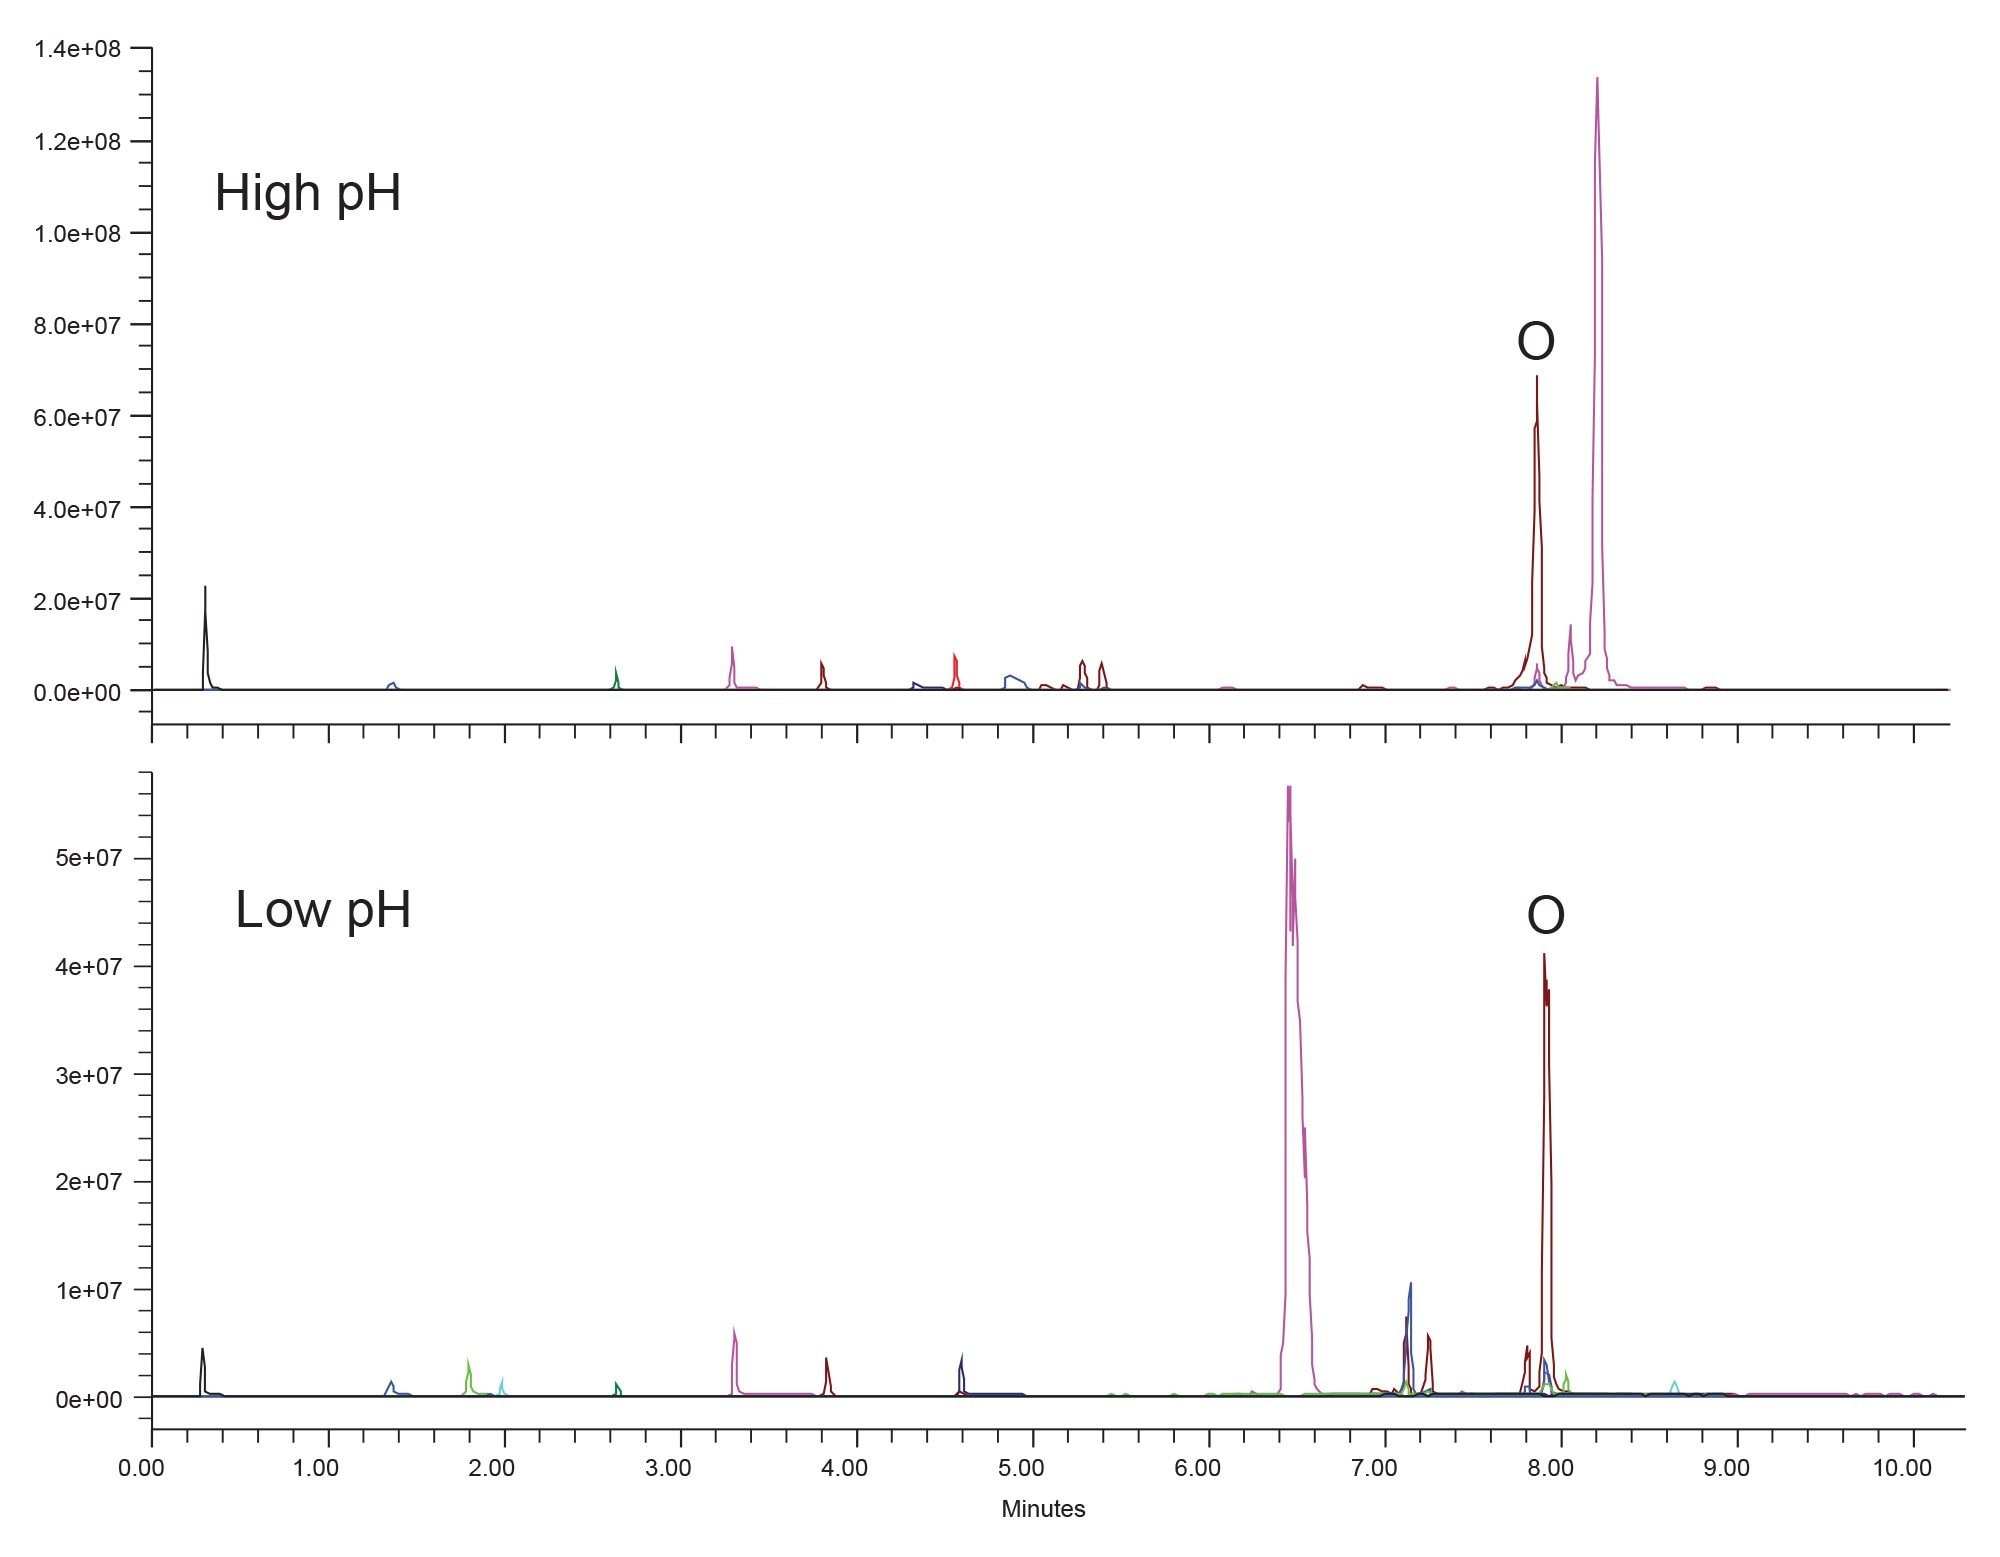
Examining the results at high and low pH shows that neither is particularly better. For some peaks, low pH has higher retention, while for other peaks the high pH conditions are better. The main peak, orlistat, denoted with an O in the Figure, shows no retention change between the two pHs. This is expected given that the pKa of the amide functional group is above the testing pH. As such, under both low and high pH conditions, orlistat is unionized. When there is no clear better condition, it is best to default to low pH for further testing. There are considerably more columns which are stable at low pH allowing a wider range of stationary phases to be used. High pH limits the potential selectivities that can be used, potentially hampering the next step, which is screening column stationary phases, and mobile phase strong solvent. For these reasons, low pH is selected for the next steps.
As previously mentioned, the next step of the systematic screening protocol is screening various stationary phases and mobile phase strong solvents. In order to get the most out of this step, a diverse group of stationary phases should be selected. This means selecting different bonded ligands, base particles, and even vendors if possible. For this work, five columns were selected, all in MaxPeak Premier Column hardware. The ACQUITY Premier BEH C18 Column was selected as it was used in the previous step and provides a good general-purpose column. Next, the ACQUITY Premier CSH Phenyl-Hexyl Column was selected. The phenyl-hexyl bonded ligand can provide a variety of unique secondary interactions, especially when methanol is used, including pi-pi interactions. Additionally, since this column uses the Charged Surface Hybrid (CSH) particle technology, there can be weak ionic exchange interactions between anionic analytes and the slight positive charge on the particle.17 Next, the ACQUITY Premier HSS PFP Column was used as it provides even greater selectivity differences compared to the other two previously selected columns. The pentafluorophenyl (PFP) bonded ligand can not only provide pi-pi interactions similar to a phenyl-hexyl, but the fluorinated ring can also participate in dipole-dipole interactions with the analytes. The High Strength Silica (HSS) particle is pure silica while the previously selected particles are both hybrids. The use of the HSS particle here can provide unique interactions for basic probes with the potential risk of poor peak shape. The fourth column selected was the ACQUITY Premier HSS T3 Column, which is specifically designed to retain polar analytes due to the mid-coverage C18 bonded phase on the highly retentive HSS particle. In the initial screening, a single peak is poorly retained, so this phase may provide some additional retention for that probe. The last column selected was the ACQUITY Premier BEH Shield RP18 Column. Utilizing the BEH particle and a bonded ligand which contains an embedded carbamate group, this phase should improve basic peak shape for some analytes compared to BEH C18, while also providing some unique selectivity. Figures 3 and 4 show the screening results using acetonitrile and methanol mobile phases, respectively.
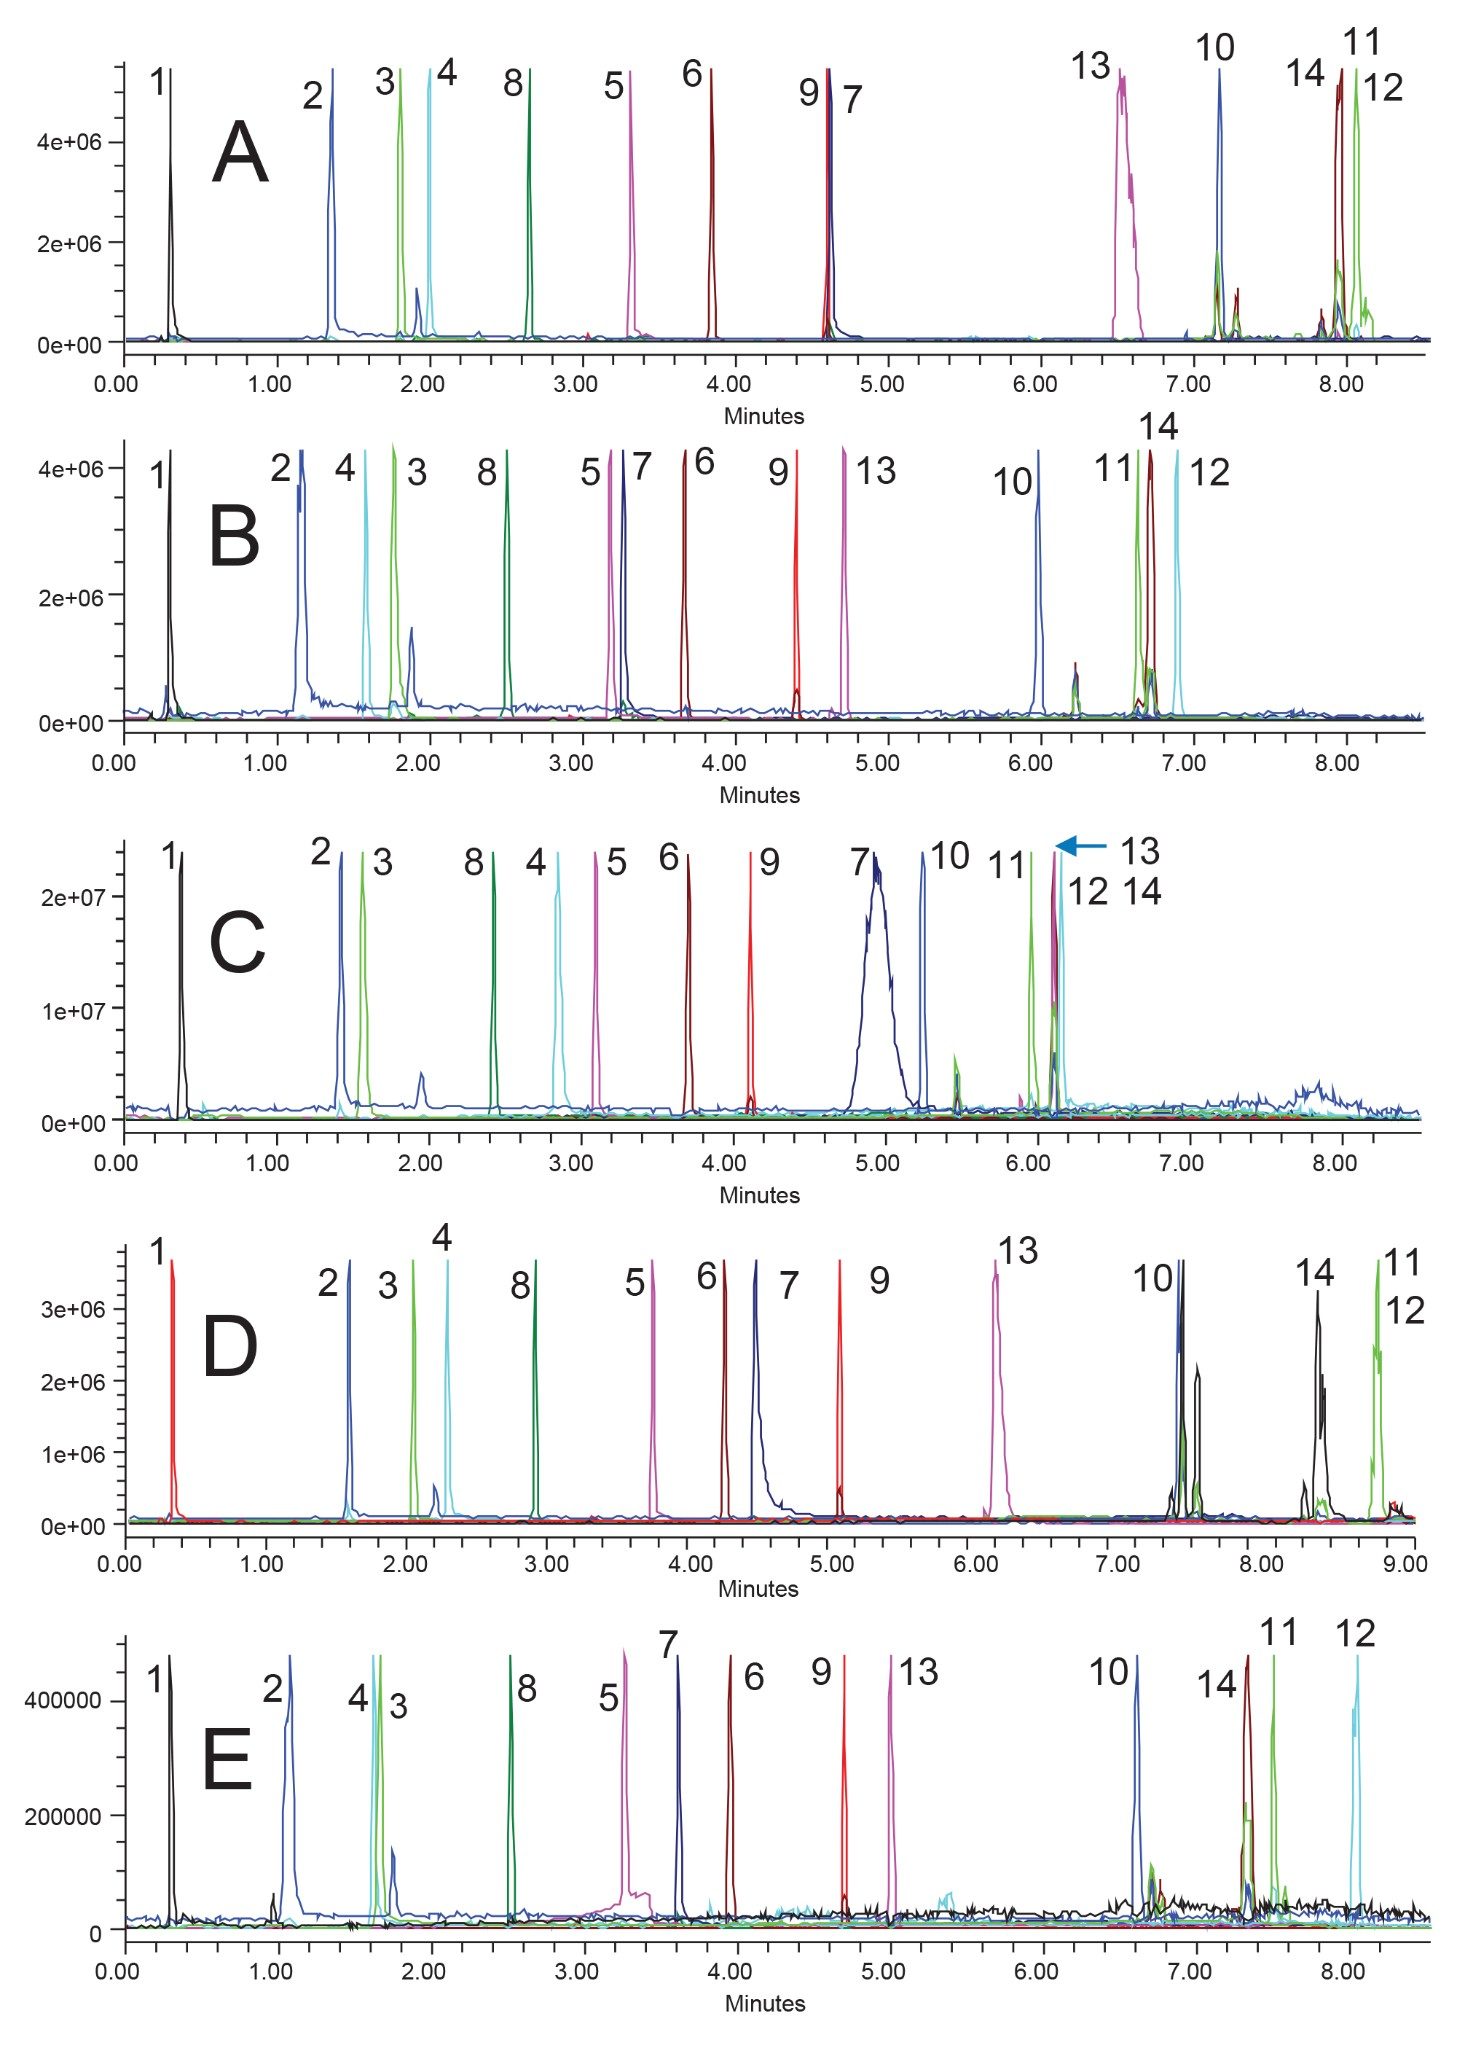
The use of acetonitrile unfortunately does not provide a usable method for this sample. On all columns tested there is at least one set of co-eluting peaks. Additionally, for the HSS PFP (3C), HSS T3 (3D), and BEH Shield RP18 (3E), there is at least one peak with poor peak shape. On the HSS PFP Column, component 7 is very wide, albeit with good symmetry. On the HSS T3 Column, component 10 is showing a split peak, and component 7 is tailing significantly. The BEH Shield RP18 Column produces poor peak shape for component 5 and a secondary peak with the same mass as component 2, which elutes after component 3. Because none of these conditions meet our goals, they will only be pursued if a suitable chromatogram is not seen with methanol mobile phases. Only after examining both acetonitrile and methanol results will the best separation be selected for optimization.
Some selectivity differences can be seen across the columns however, even if no suitable chromatogram was achieved. Examining the elution order of components 3 and 4 and tracking those peaks across the various columns provides insights into the chemical properties of these components. For instance, component 4 is retained the most on HSS particle columns, both the PFP and T3 phases. This would indicate a slight basic functionality as the probe can better interact with the free silanols of the HSS particle compared to the hybrid BEH and CSH particles. The idea that component 4 has a basic functionality is supported by the retention on the CSH Phenyl-Hexyl and BEH Shield RP18 Columns, where it elutes before component 3. This is one example as to why selecting diverse stationary phases is critical to method development. Even if the results from a column are not ideal or meet assay goals, the results can still provide great insight into the chemical properties of the analyte, by examining how the analyte interacts with different stationary phases.
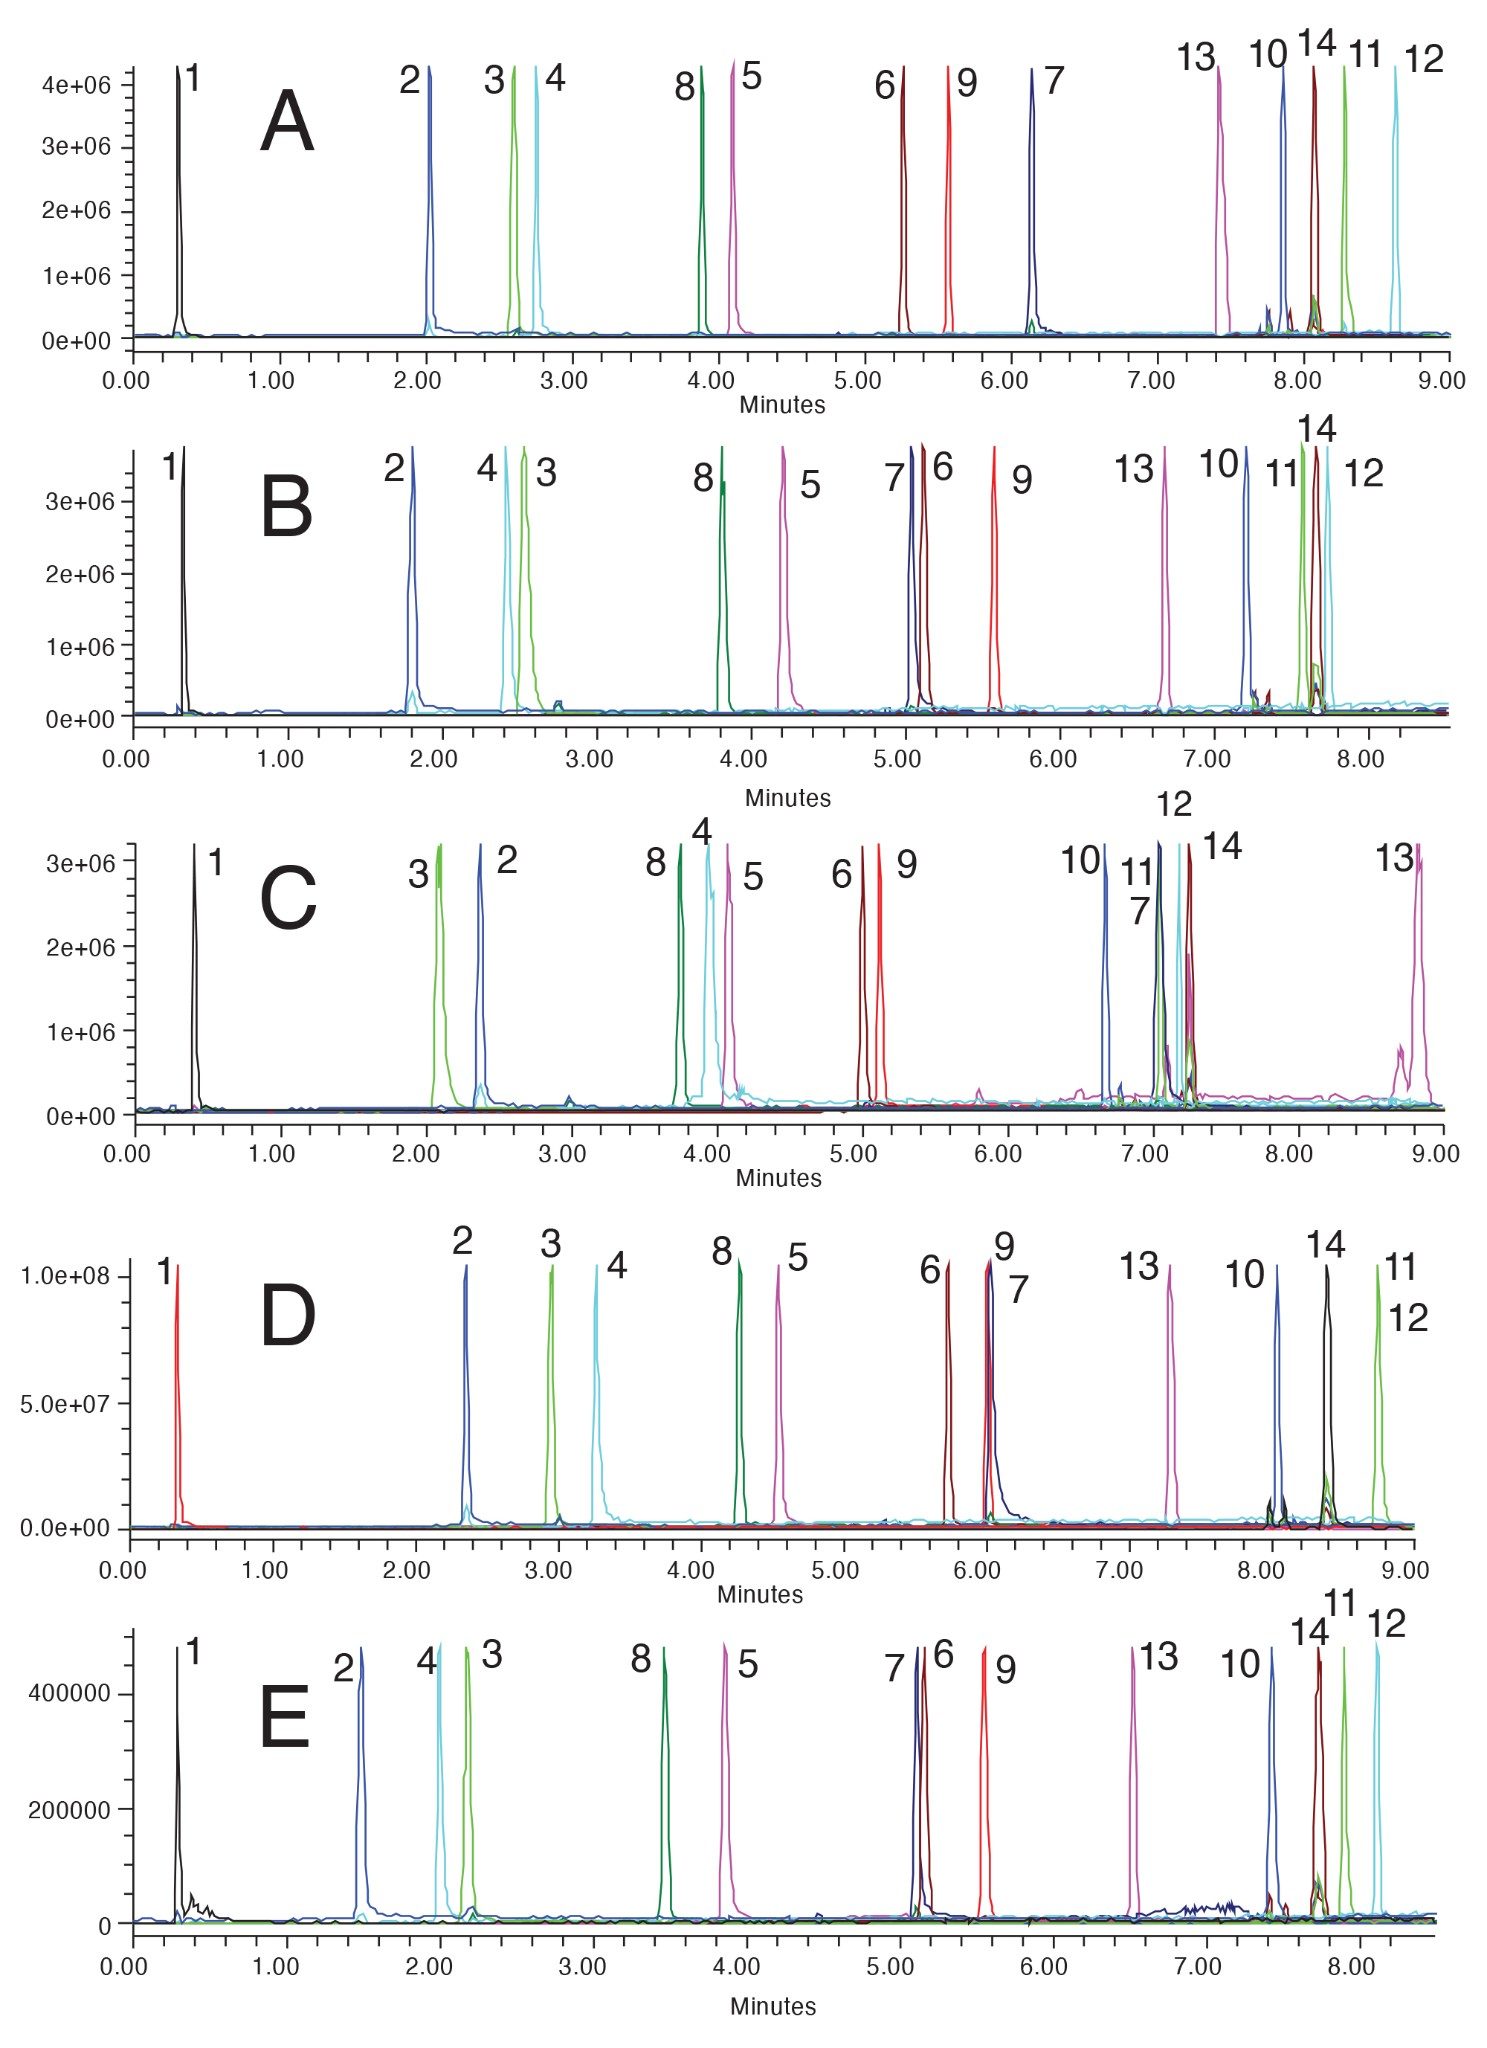
The use of methanol mobile phase provides a single result which meets the goals of the method. That is achieved using the ACQUITY Premier BEH C18 Column. As can be seen in Figure 4A, all the peaks are well separated. Components 3 and 4 are closely eluting but are baseline resolved, as well as the cluster of components 10, 14, and 11. Good peak shape is also achieved for these probes. All the other tested columns using methanol provided worse results, including co-elutions. Interestingly, the wide peak seen for component 7 on the HSS PFP column with acetonitrile (3C) is not observed with methanol mobile phases (4C). This is likely because methanol allows some of the secondary interactions to occur between stationary phase and analyte. Other peak shape issues seen with acetonitrile mobile phases are not seen with methanol, likely caused by the slightly different selectivity that the mobile phase provides.
As seen with acetonitrile, the use of different stationary phases with methanol provides unique selectivity. Additionally, since both acetonitrile and methanol have been used, comparisons can be made between the two mobile phases on a given stationary phase. For instance, if the CSH Phenyl-Hexyl results with acetonitrile (3B) are compared to the results for the same column with methanol (4B), selectivity differences can be seen. While the elution order of the analytes does not change, the selectivity for components 5, 7, 6, 9, and 13 all change between the two solvents. With acetonitrile, components 5 and 7 are co-eluting while the use of methanol pulls those two components apart, forcing component 7 to co-elute with component 6. Component 13 elutes much closer to component 9 when acetonitrile is used compared to methanol, which can only be partially explained by the elution strength of the mobile phase. These comparisons highlight the importance of screening both acetonitrile and methanol as part of method development. While this adds time to the testing process, the information gleaned from the results is vital.
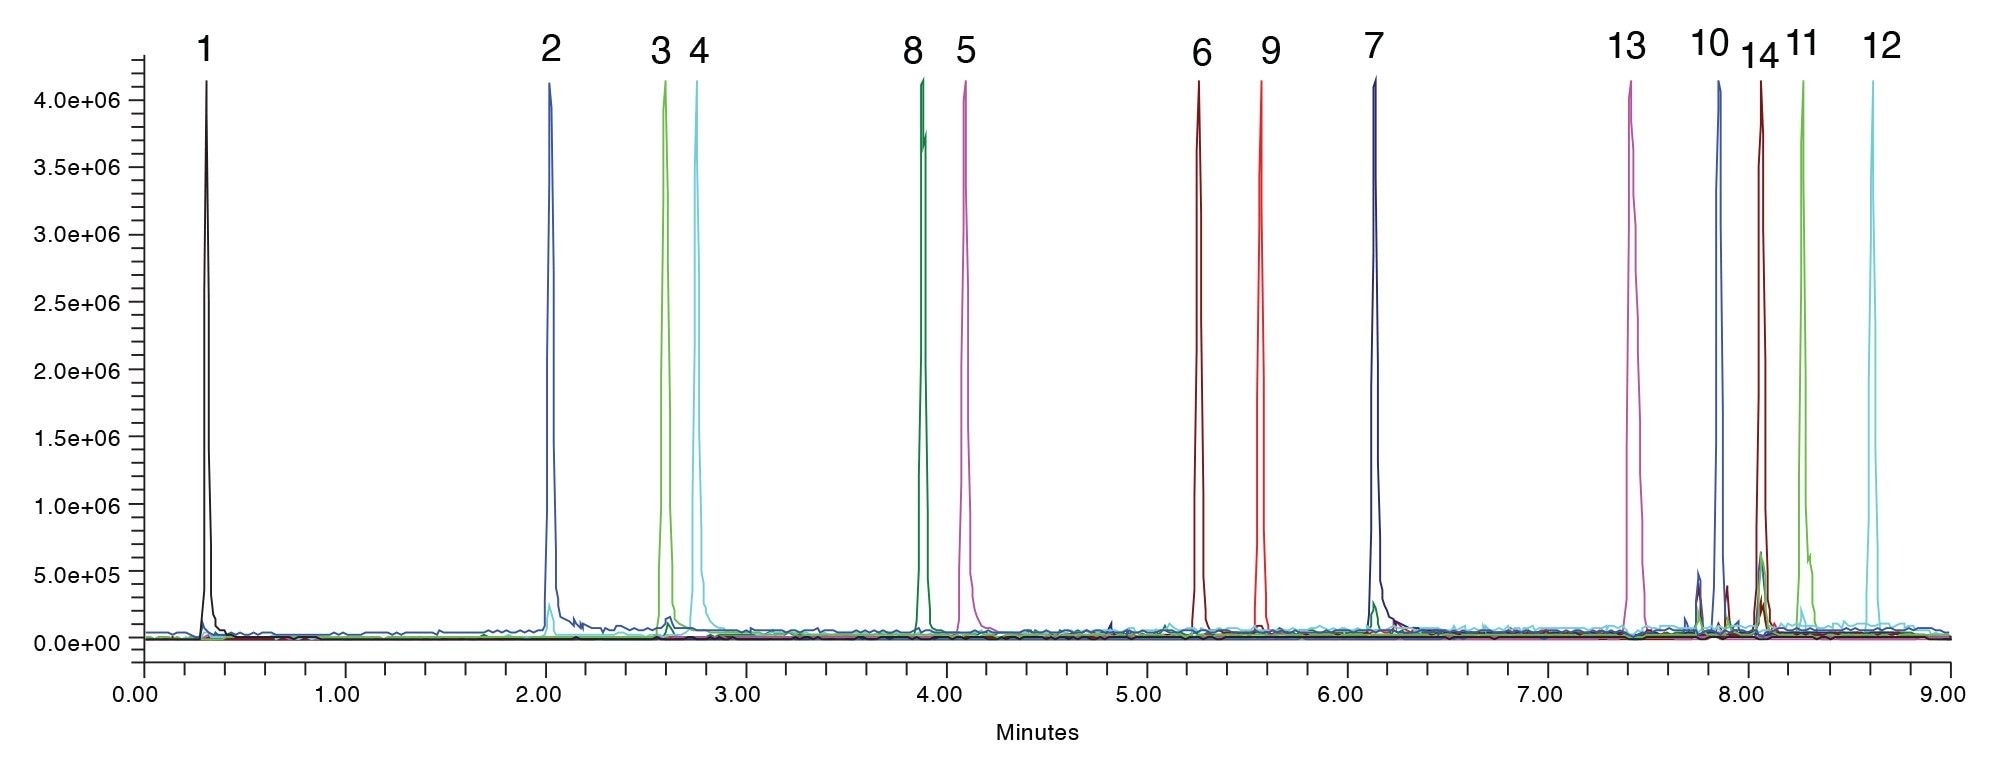
The final testing conditions for this sample using the ACQUITY Premier BEH C18 Column with methanol mobile phase was modified using formic acid, Figure 5. This method can now be used for other testing, including quantitation or even identification of the degradants. Additionally, this method could be transferred into a QC group to be used for release testing as the degradants may be monitored as part of batch testing.
Conclusion
Forced degradation studies are common during pharmaceutical development as they probe not only the stability of the molecule but also provide potential degradants which can be assessed for potential toxicity or other effects. These studies are also used as a first step in creating stability indicating methods for batch release testing of a formulated drug product. This application note showed the forced degradation of the weight loss drug orlistat and the method development process for creating a suitable stability indicating method. The method development process was streamlined by using the systematic screening protocol combined with MaxPeak Premier Columns. The systematic screening protocol reduces errors and doubt in method development by providing a rigid framework of steps an analyst should take when developing new methods. Taken in three steps, the sample is first tested with high and low pH mobile phase to assess retention. Next, the pH is locked in, and column screening occurs using a diverse panel of stationary phases along with both acetonitrile and methanol mobile phases. Lastly, if needed, the best separation from the column screening step is optimized to meet all assay criteria set by the analyst.
The use of MaxPeak Premier Columns further improves the method development process, by eliminating any non-specific adsorption that can occur between the analyte and the column hardware. This eliminates any doubt in the results, providing reliable data on the first injection. Having that kind of certainty in the results allows for faster decision making during the method development process. In the case of orlistat forced degradation, a suitable method for all 14 analytes was developed in just under two days.
References
- Al-Suwailem A.K., Al-Tamimi A.S., Al-Oumar M.A., Al-Suhibani M.S. Safety and Mechanism of Action of Orlistat (Tetrahydrolipstatin) as the First Local Antiobesity Drug. Journal of Applied Sciences Research. (2006). 205–208.
- Hadvary P, Lengsfeld H, Wolfer HJ. Inhibition of Pancreatic Lipase In Vitro by the Covalent Inhibitor Tetrahydrolipstatin. Biochemical Journal. (1989) 357–361.
- Maziarz M, McCarthy S, Wrona M. Improving Effectiveness in Method Development by Using a Systematic Screening Protocol. Waters Application Note. 720005026.
- Berthelette KD, Nguyen JM, Turner, J. Method Development of Ten Antibiotic Compounds Using a Systematic Screening Protocol on an ACQUITY ARC with UV and QDa Detection. Waters Application Note. 720007352.
- Berthelette KD, Turner JE, Walter TH, Haynes K. Using a Systematic Screening Protocol and MaxPeak HPS Technology to Develop a UHPLC Method for the Analysis of Deferoxamine and its Forced Degradation Products. Waters Application note. 720007834.
- Hong P, McConville P. A Complete Solution to Perform a Systematic Screening Protocol for LC Method Development. Wates White Paper. 720005268.
- Delano M, Walter TH, Lauber M, Gilar M, Jung MC, Nguyen JM, Boissel C, Patel A, Bates-Harrison A, Wyndham K. Using Hybrid Organic-Inorganic Surface Technology to Mitigate Analyte Interactions with Metal Surfaces in UHPLC. Anal. Chem. 93 (2021) 5773–5781.
- Walter TH, Alden BA, Belanger J, Berthelette K, Boissel C, DeLano M, Kizekai L, Nguyen JM, Shiner S. Modifying the Metal Surfaces in HPLC Systems and Columns to Prevent Analyte Adsorption and Other Deleterious Effects. LCGC Supplements (2022) 28–34.
- Smith K, Rainville P. Utilization of MaxPeak High Performance Surfaces and the Atlantis Premier BEH C18 AX Column to Increase Sensitivity of LC-MS Analysis. Waters Application Note. 720006745.
- Reed C, Hong P, Wong N, Birdsall R. Improving Peptide Mapping Separations Containing Phosphopeptides using MaxPeak Premier Column Technology on an ACQUITY Premier System. Waters application note. 720008136.
- Addepalli B, Araya M, Lauber MA. Enhanced Resolution for Longer Oligonucleotide Analytes with a MaxPeak Premier Oligonucleotide BEH C18 300 Å Column. Waters Application Note. 720007926.
- Jung MC, Lauber MA. Demonstrating Improved Sensitivity and Dynamic Range with MaxPeak High Performance Surfaces (HPS) Technology: A Case Study on the Detection of Nucleotides. Waters Application Note. 720007053.
- Zabala G, Berthelette K, Gu W, Haynes K. Improved Reproducibility for Acetaminophen Assay USP Monograph Using MaxPeak Premier Columns after Modernization to 2.5 µm Particles. Waters Application Note. 720007938.
- Boissel C, Walter TH, Shiner S. ACQUITY Premier Solution Improves the UPLC-MS Analysis of Deferoxamine–an Iron Chelating Drug. Waters Application Note. 720007239.
- Berthelette K, Deloffi M, Kalwood J, Haynes K. Forced Degradation Study of Janus Kinase Inhibitor, Baricitinib, using MaxPeak Premier HPLC Columns on an Alliance HPLC System. Waters Application Note. 720008113.
- Berthelette K, Turner J, Walter TH, Haynes K. Using a Systematic Screening Protocol and MaxPeak HPS Technology to Develop a UHPLC Method for the Analysis of Deferoxamine and its Forced Degradation Products. Waters Application Note. 720007834.
- Alden B, Smith K, Rainville P, Walter TH, Gilar M. Retention of Anions on Charged Surface Hybrid Columns. Waters Poster. https://www.waters.com/webassets/cms/library/docs/2018hplc_alden_csh_anions.pdf
720008225, March 2024