Analysis of Antidepressant Drugs in Plasma for Clinical Research
For research use only. Not for use in diagnostic procedures.
Abstract
Pharmacokinetic and drug interactions for antidepressant drugs and other classes of neuropharmacology drugs have been documented.1 As such, a reliable analytical method may play a role in clinical research.
Here we describe a clinical research method for the analysis of antidepressant drugs using protein precipitation of plasma with internal standards. Chromatographic elution was completed within 5 minutes using a Waters XSelect™ Premier HSS T3 Column on a Waters ACQUITY™ UPLC™ I-Class System followed by detection on a Xevo™ TQD Mass Spectrometer (Figure 1).
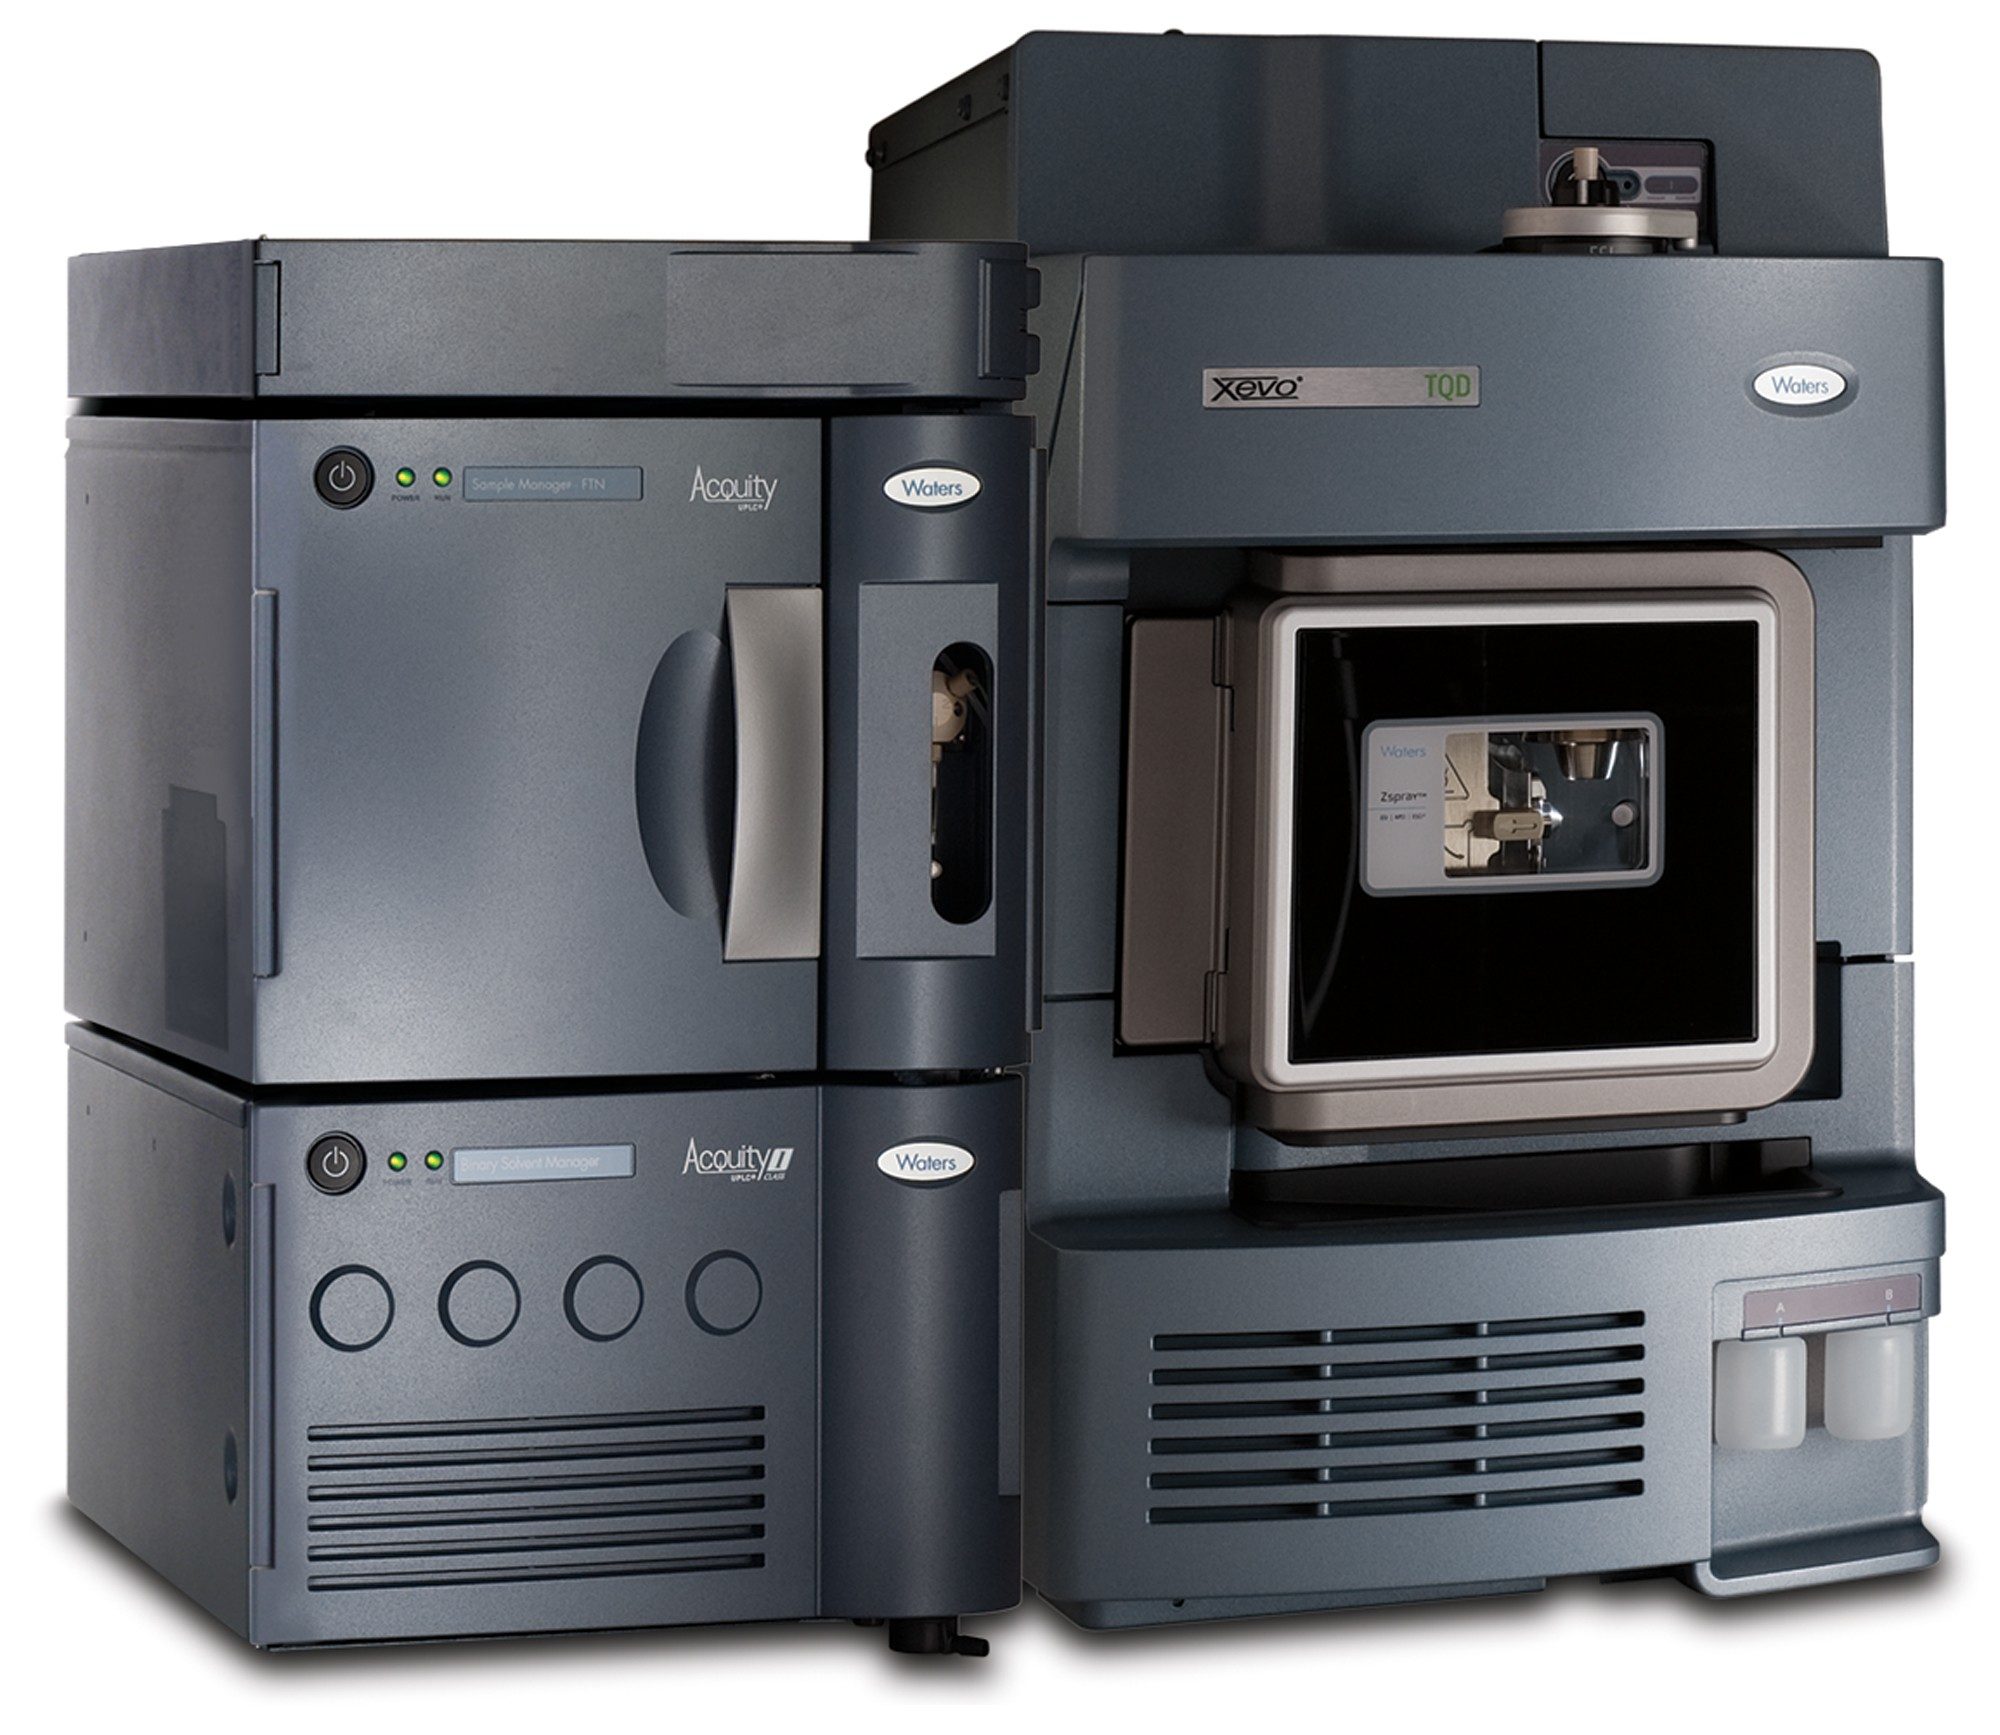 Figure 1. The Waters ACQUITY UPLC I-Class System and Xevo TQD Mass Spectrometer.
Benefits
- Analytical selectivity afforded by chromatography and mass detection
- Simple and inexpensive sample preparation using low sample volumes
- Fast analytical run time
Experimental
Sample Preparation
Plasma calibrators and quality control materials were prepared in house using pooled human plasma supplied by BioIVT (West Sussex, UK). Concentrated stock solutions were prepared from certified powders supplied by Cambridge Bioscience (Cambridgeshire, UK), Merck Life Science (Dorset, UK), and Toronto Research Chemicals (Ontario, Canada). Stable labelled internal standards were supplied by Cambridge Bioscience (Cambridgeshire, UK), Merck Life Science (Dorset, UK) and Toronto Research Chemicals (Ontario, Canada). The calibration range was 10–1000 ng/mL for all analytes, with the exception of mirtazapine (5–500 ng/mL) and trazadone (30–3000 ng/mL).
Sample Extraction
To 50 µL of sample in a microcentrifuge tube, 150 µL of internal standard in acetonitrile was added, the concentrations of internal standards are detailed in Table 1.
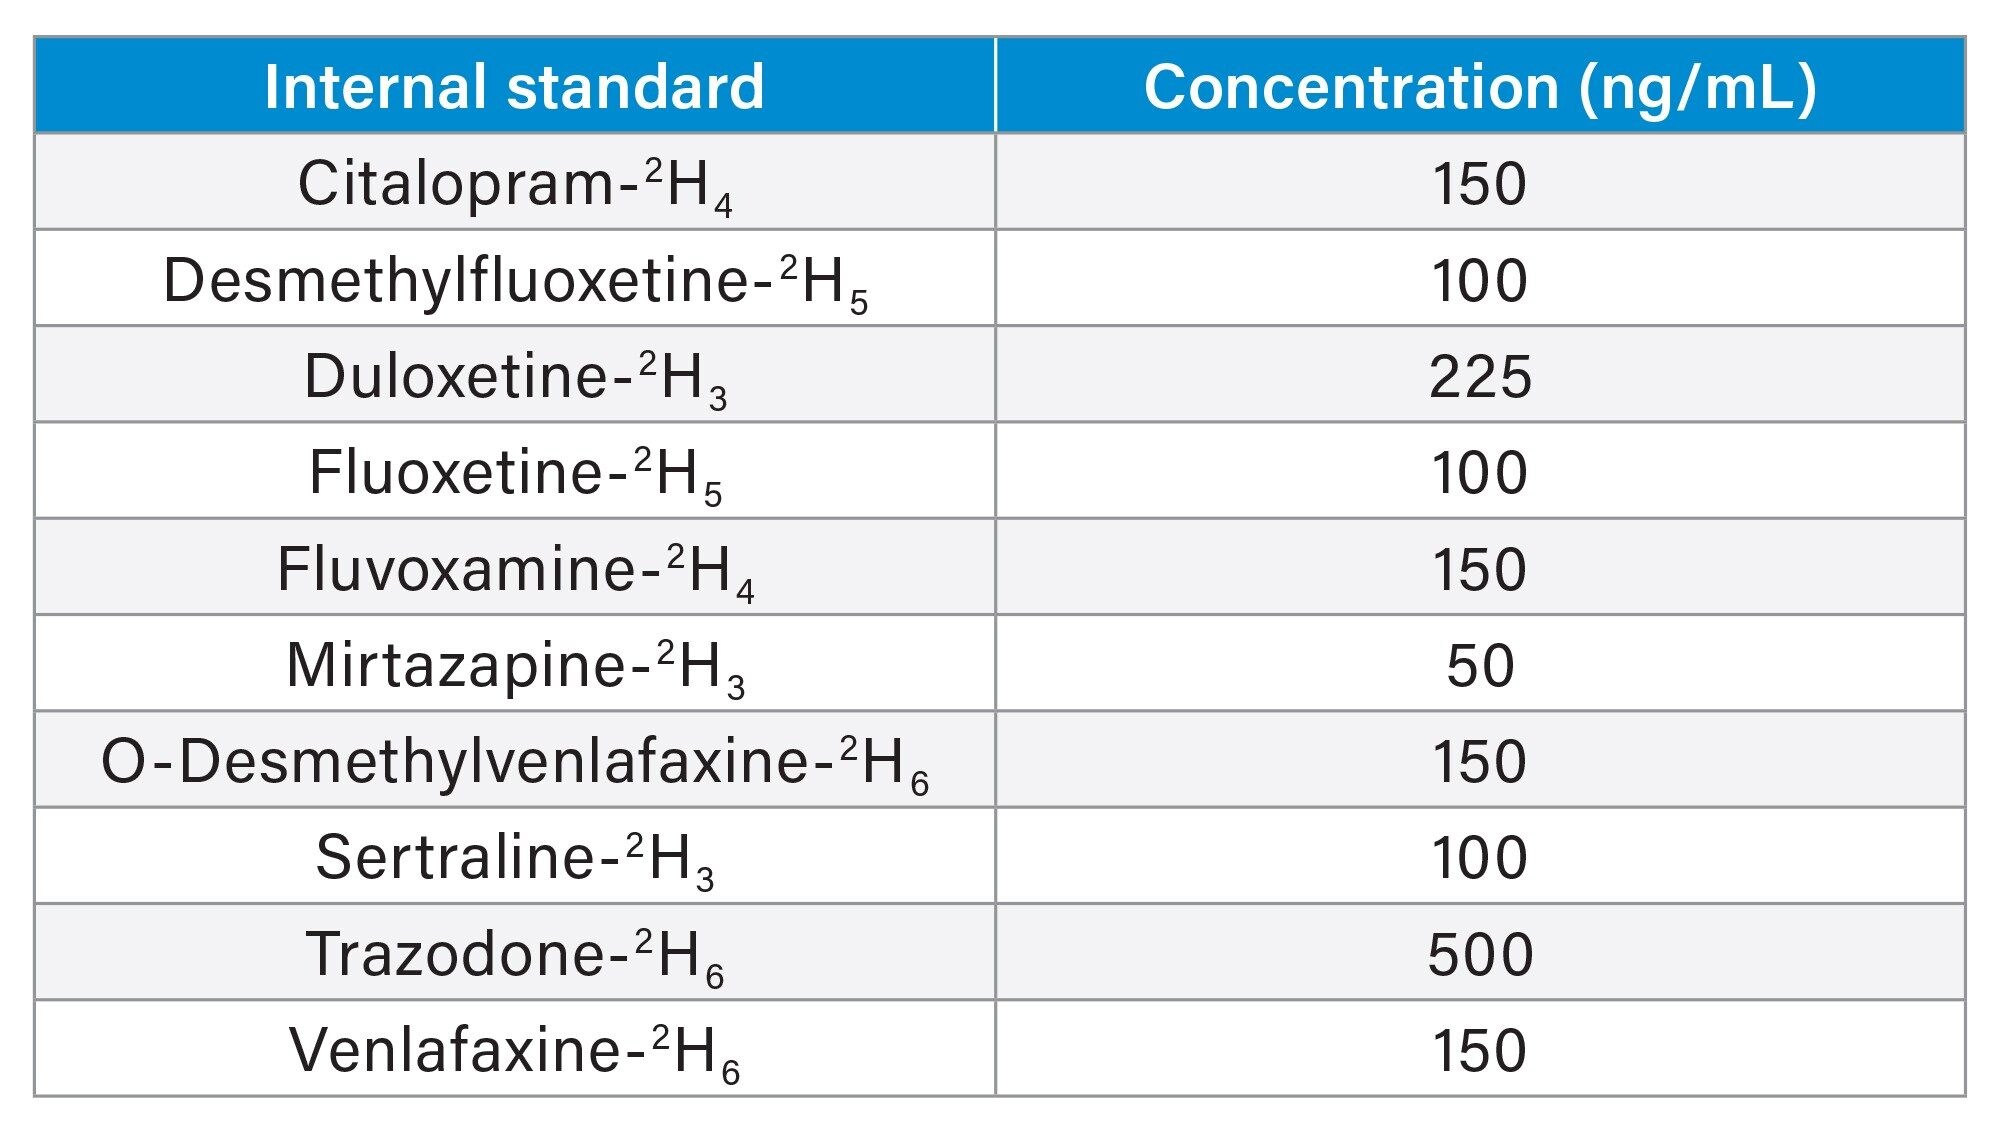 Table 1. Internal standard concentrations.
Tubes were placed on a multi-tube vortex mixer at 2500 r.p.m. for 30 seconds, then centrifuged for 2 minutes at 16,100 g. 50 µL of supernatant was transferred to a 1 mL 96 well plate and 450 µL water added.
The mobile phase and column were chosen for compatibility with other panels, for example anti-epileptic drugs, tricyclic antidepressants, and antipsychotic drugs.
UPLC Conditions
|
System: |
ACQUITY UPLC I-Class with FTN |
|
Needle: |
30 µL |
|
Column: |
XSelect HSS T3 Column; 2.5 µm, 2.1 x 100 mm (p/n: 186009831) |
|
Mobile phase A: |
Water + 2 mM ammonium acetate |
|
Mobile phase B: |
Methanol + 2 mM ammonium acetate |
|
Needle wash solvent: |
80% aqueous methanol + 0.1% formic acid |
|
Purge solvent: |
Water:Methanol 40:60 v:v |
|
Seal wash: |
20% aqueous methanol |
|
Column temp: |
45 °C (precolumn heater active) |
|
Injection volume: |
20 µL |
Gradient Table
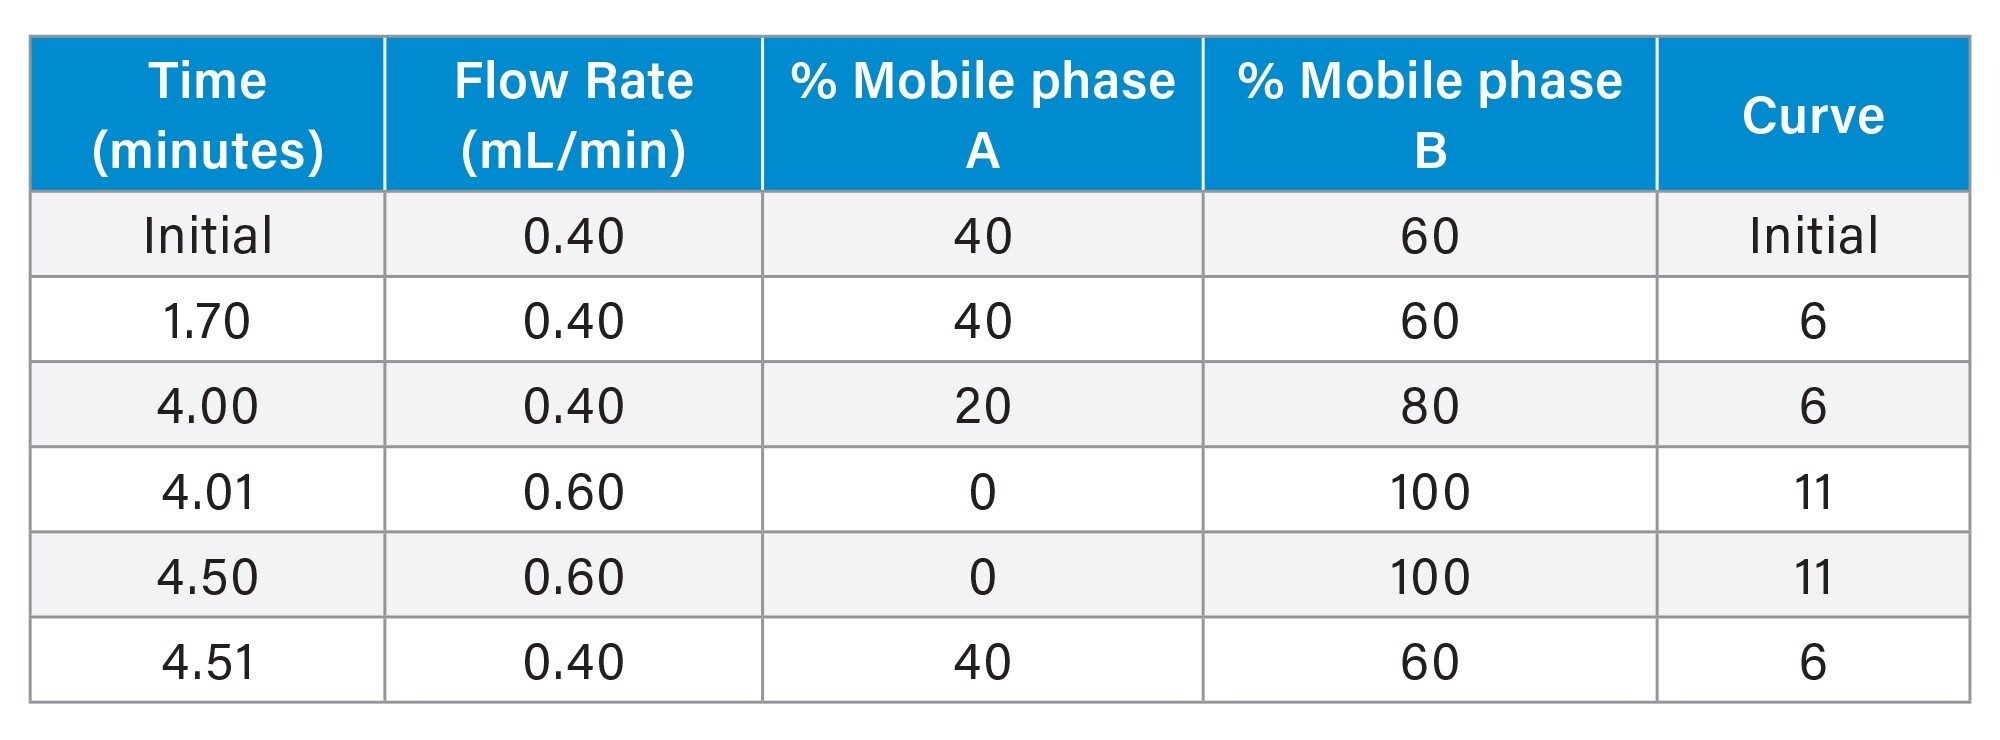
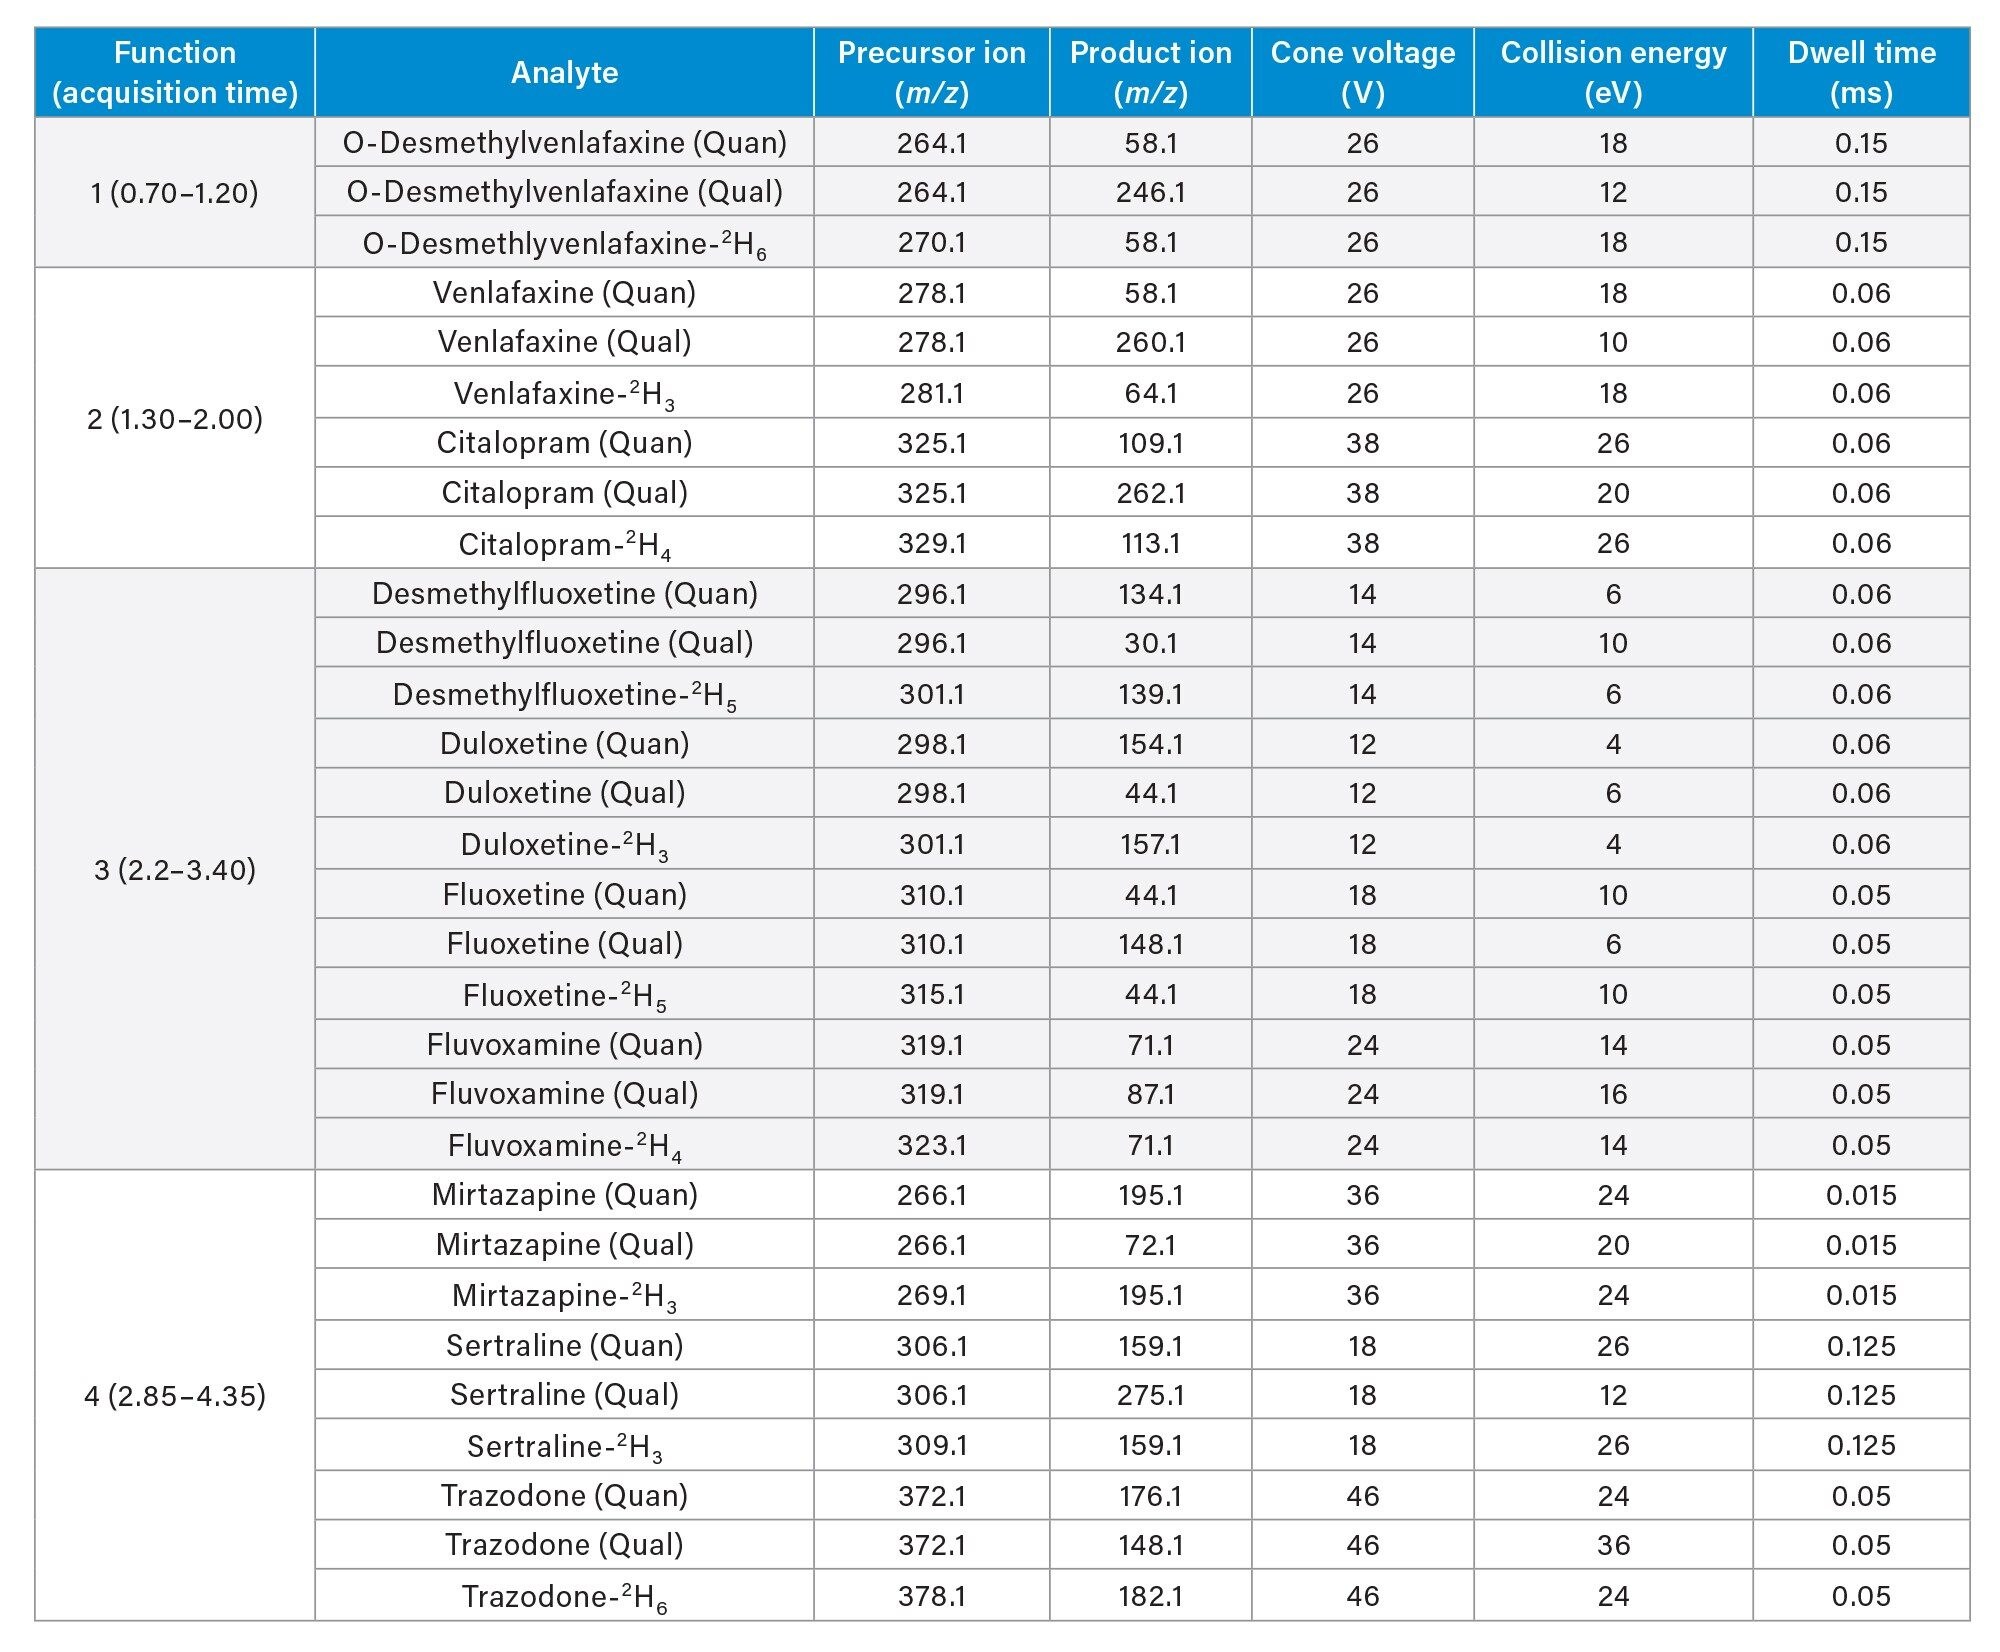 Table 2. Chromatographic elution timetable.
|
Run time: |
5.0 minutes (5.7 minutes injection-to-injection) |
MS Conditions
|
System: |
Xevo TQD |
|
Resolution: |
MS1 (0.7 FWHM) MS2 (0.7 FWHM) |
|
Acquisition mode: |
Multiple Reaction Monitoring (MRM) (see Table 2 for details |
|
Polarity: |
ESI+ ionization |
|
Capillary: |
0.5 kV |
|
Source temperature: |
150 °C |
|
Desolvation temperature: |
400 °C |
|
Cone gas: |
50 L/hr |
|
Desolvation gas flow: |
1000 L/hr |
|
Inter-scan delay: |
0.003 seconds |
|
Polarity/Mode switch Inter-scan delay: |
0.020 seconds |
|
Inter-channel delay: |
0.020 seconds |
Data Management
MassLynx™ v4.2 with TargetLynx™ Application Manager.
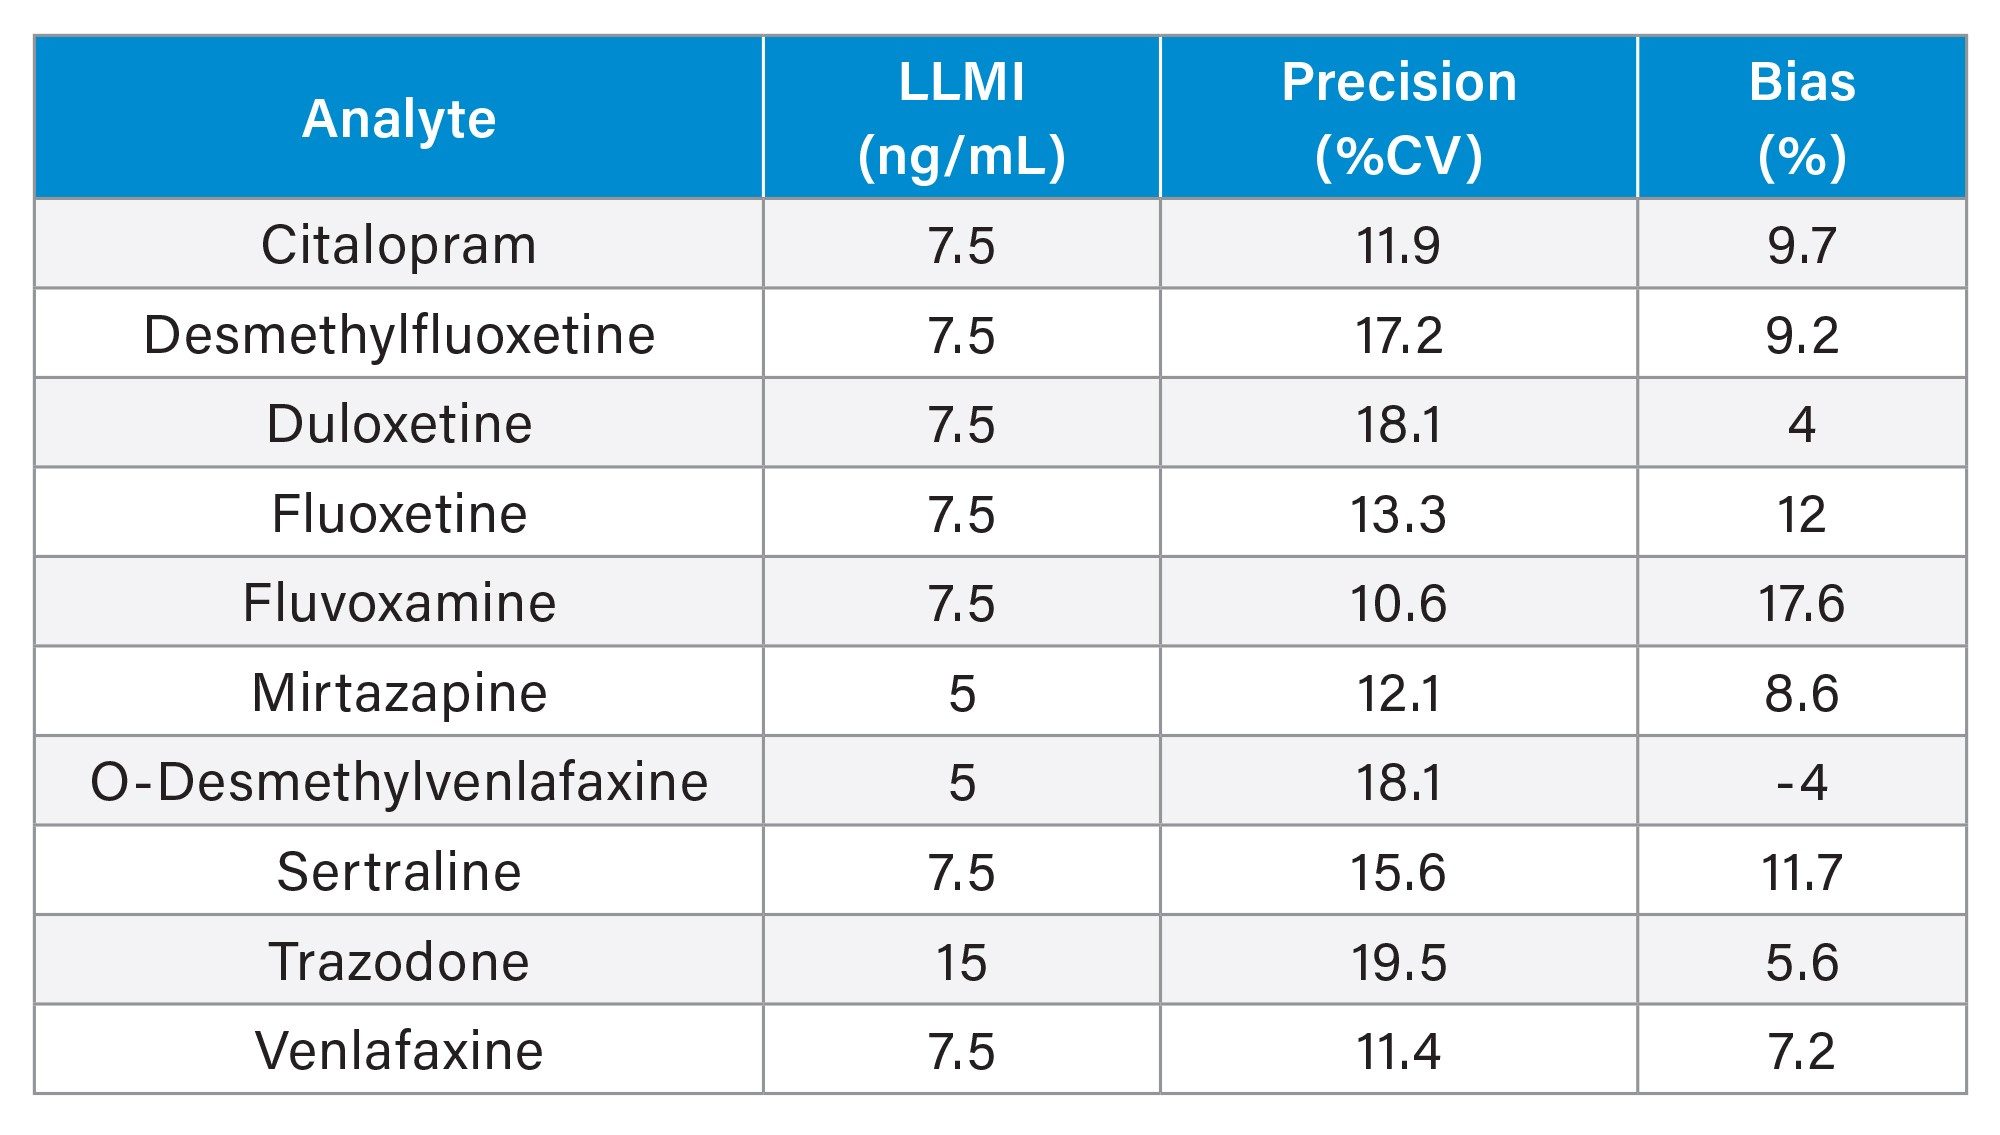 Table 3. Guideline MRM parameters for analytes and internal standards used in this study.
Results and Discussion
Figure 2 shows an example chromatogram.
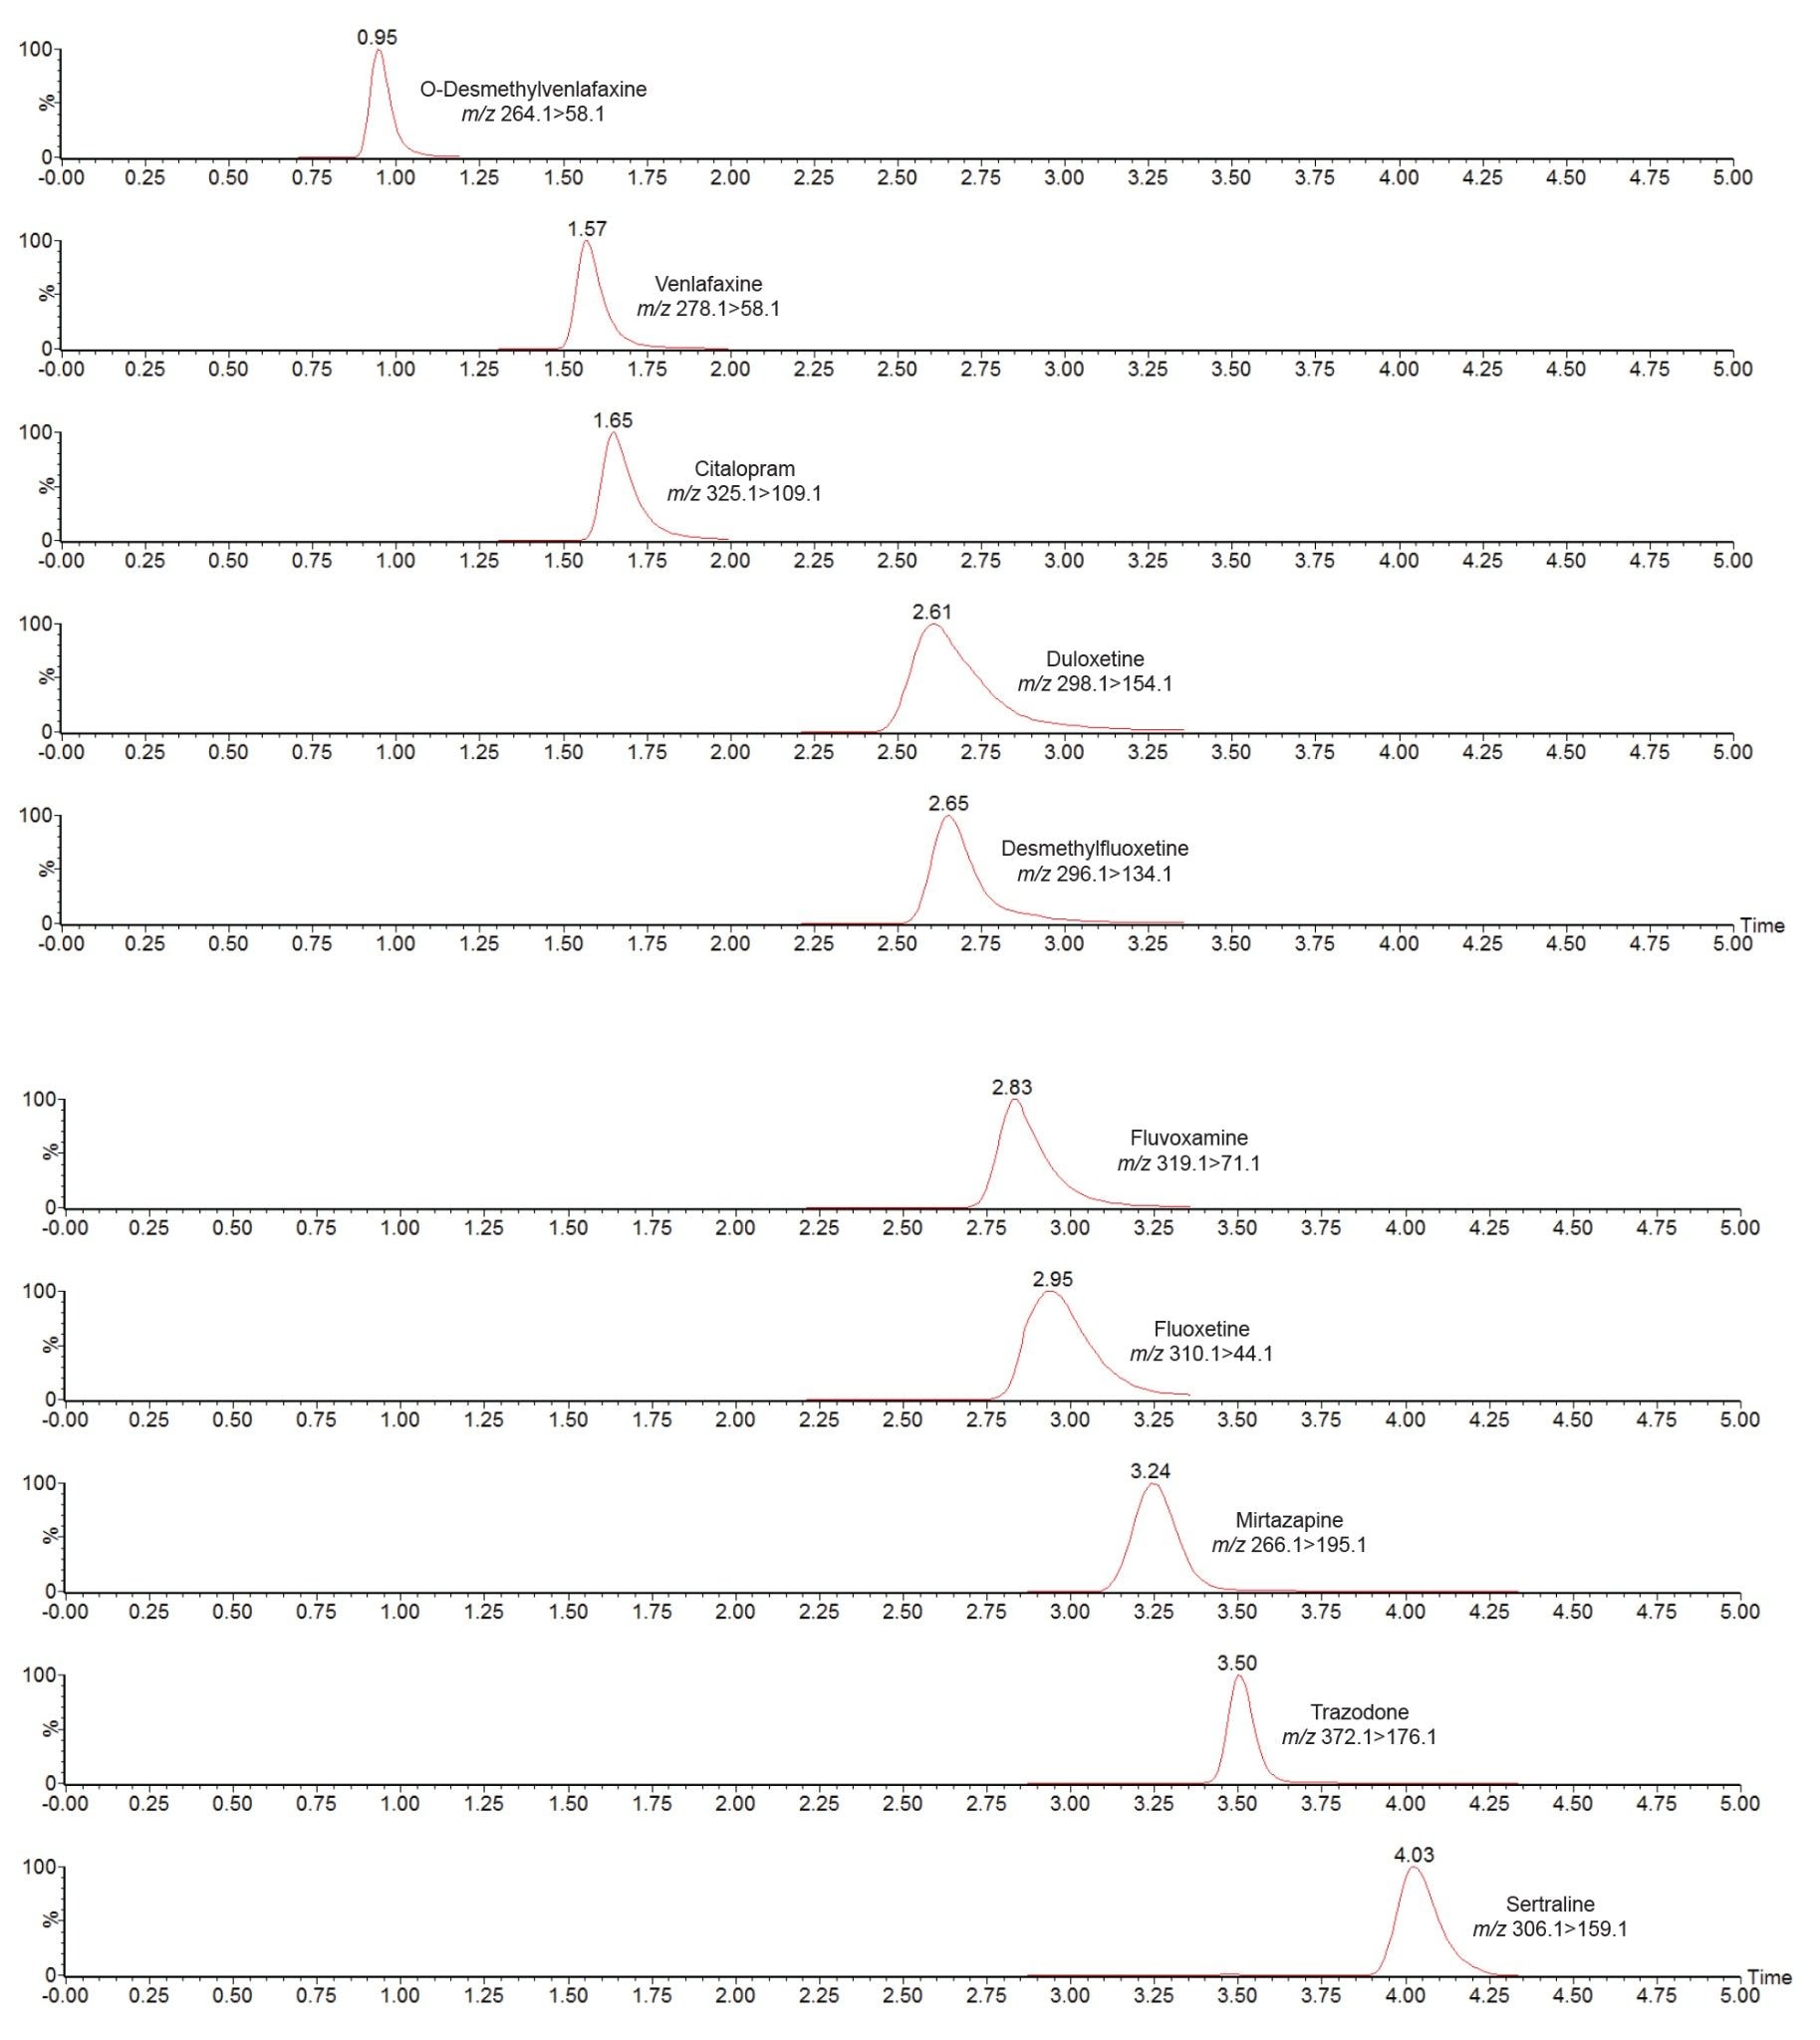 Figure 2. Chromatogram showing the analysis of antidepressant drugs using the ACQUITY UPLC I-Class/ Xevo TQD IVD System.
No system carryover was observed following analysis of plasma samples containing 1000 ng/mL citalopram, desmethylfluoxetine, duloxetine, fluoxetine, fluvoxamine, O-desmethylvenlafaxine, sertraline, and venlafaxine, 500 ng/mL mirtazapine and 3000 ng/mL trazadone.
Analytical sensitivity was assessed by extracting and quantifying 10 replicates of low concentration samples prepared in plasma over five days. Investigations indicated the method would allow for precise quantification (≤20% CV, ≤15% bias) at the concentrations shown in Table 4.
Table 4. Analytical sensitivity summary (LLMI is lower limit of the measuring interval).
The only exception was for fluvoxamine, for which bias was slightly >15%, however at 17.6%, this is ≤20%, which is the permissible % deviation for calibrator 1, at 10 ng/mL.
Total precision was determined by extracting and quantifying five replicates of three concentrations of plasma pools over five separate days (n=25). Repeatability was assessed by analyzing five replicates at each QC level. Figure 3 presents results of these experiments, where total precision and repeatability at the three concentrations assessed (25, 75 and 800 ng/mL for all analytes, with the exception of mirtazapine, for which concentrations were 12.5, 37.5, and 400 ng/mL and trazadone, for which they were 75, 225, and 2400 ng/mL) was ≤10.0% CV.
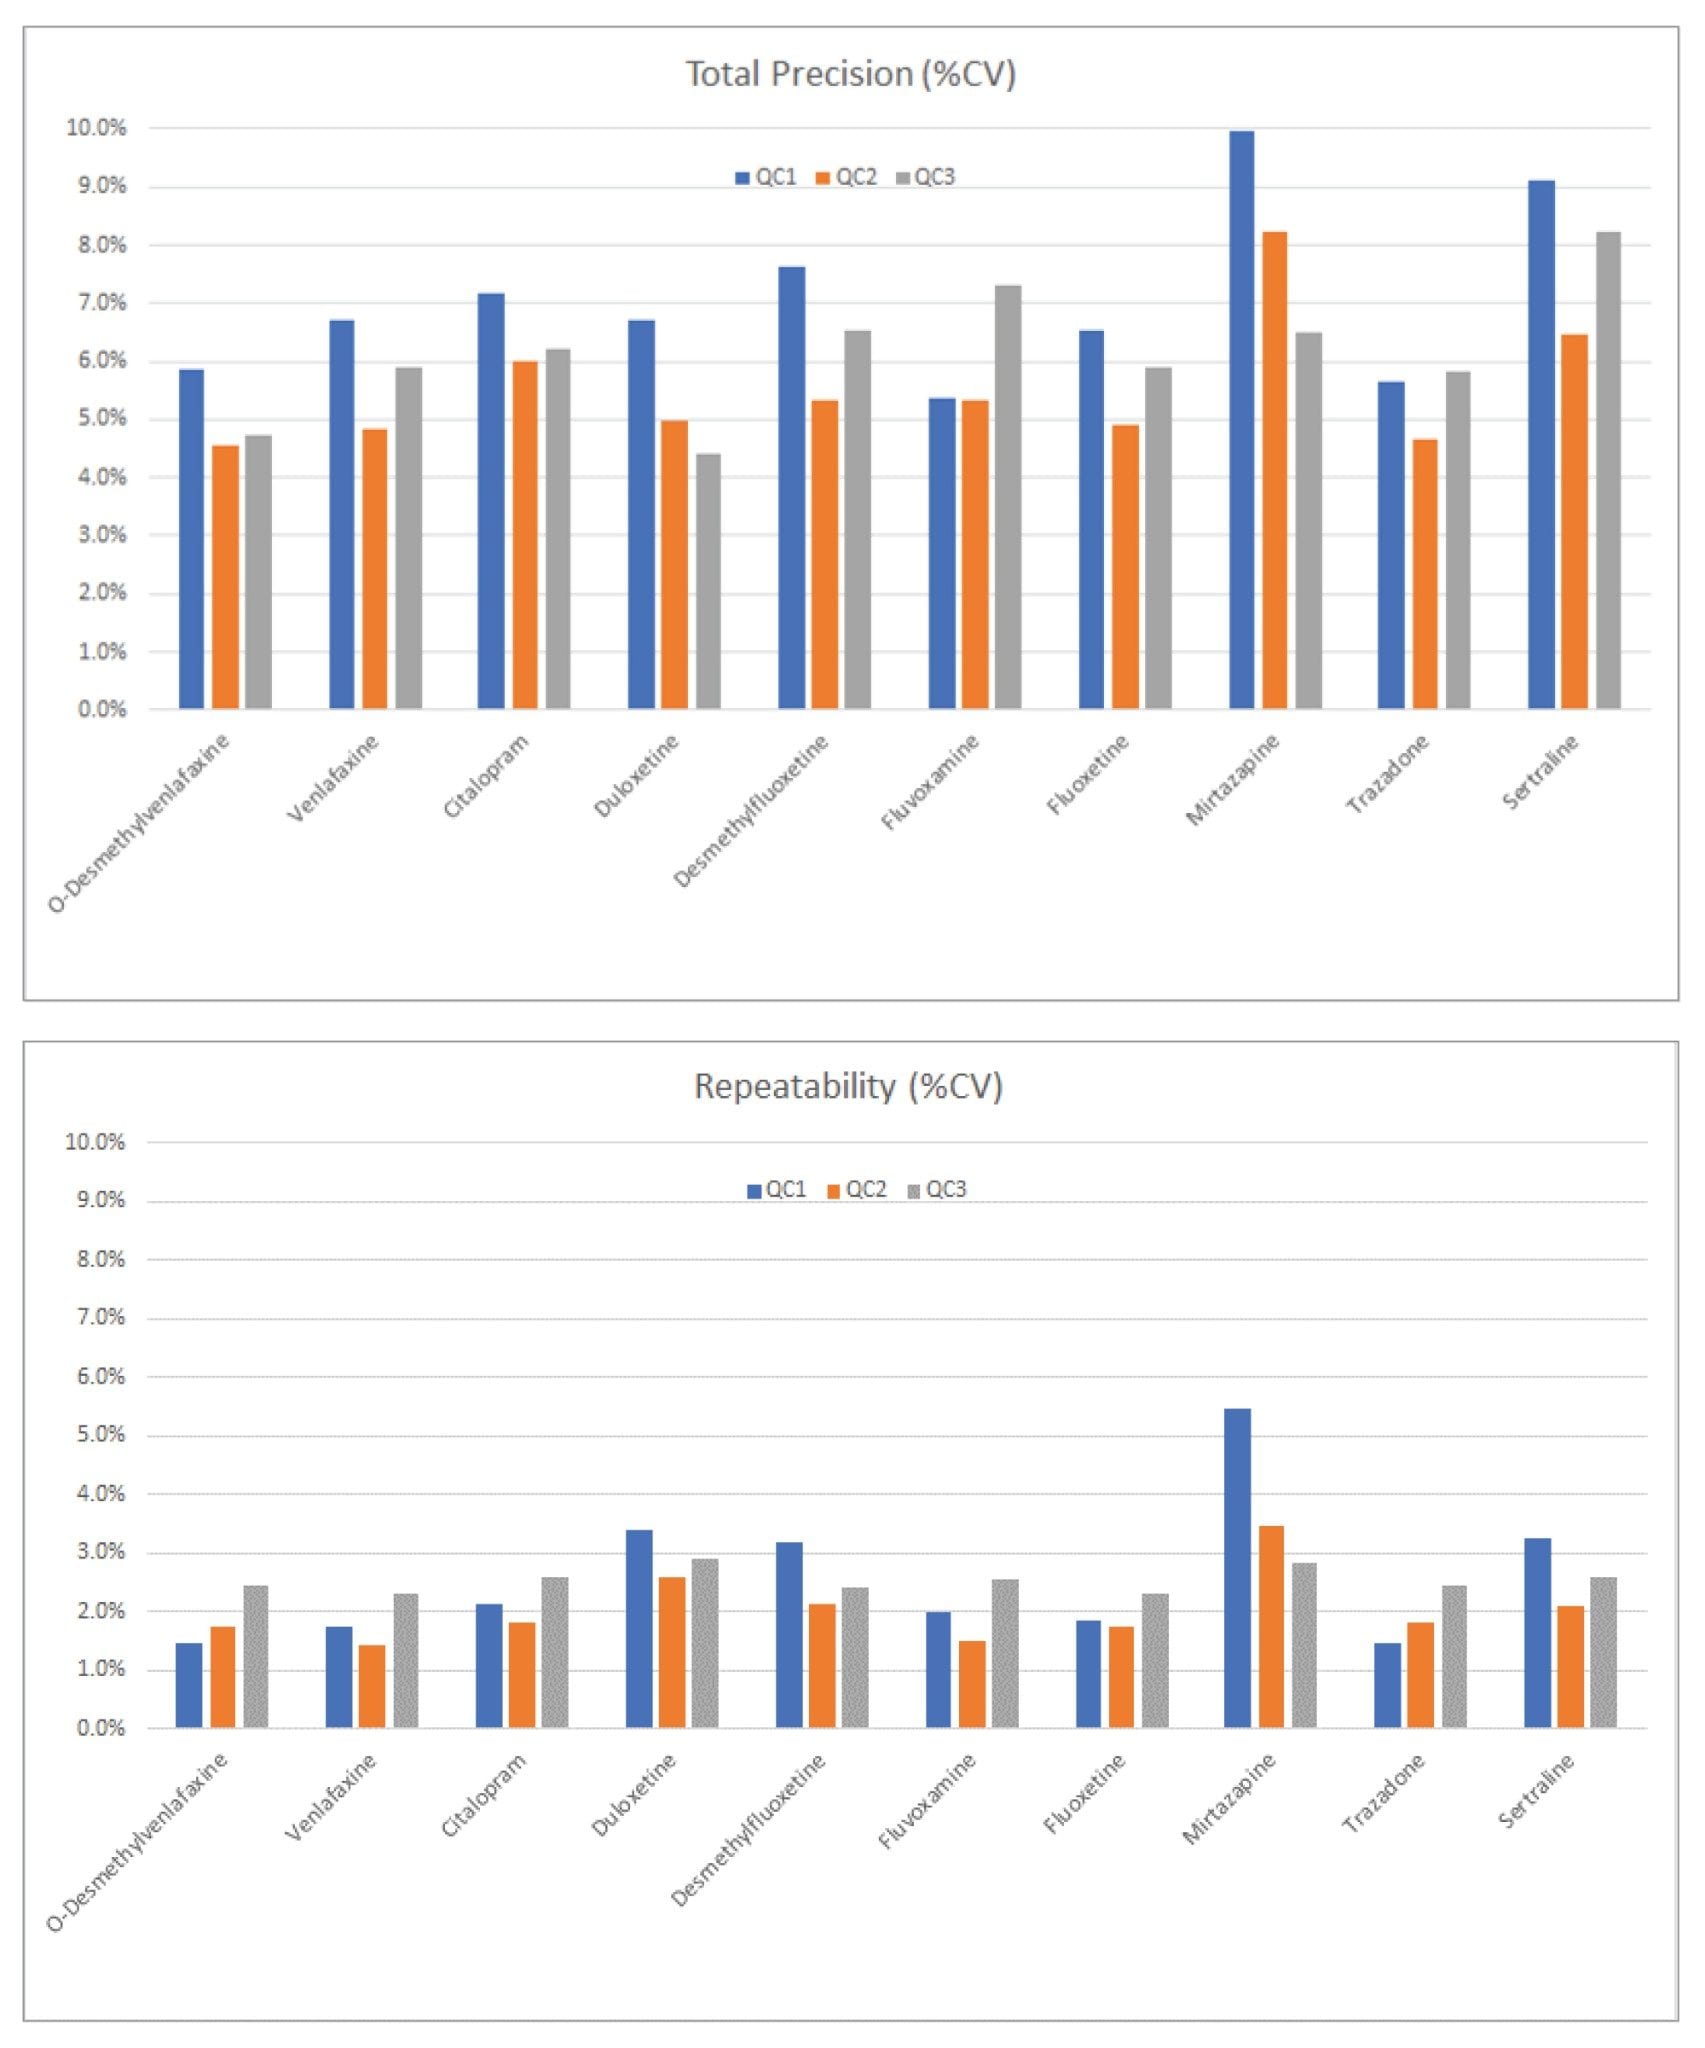 Figure 3. Total precision and repeatability performance.
The method was shown to be linear over the ranges of 7.7–1300 ng/mL for O-Desmethylvenlafaxine and duloxetine when low and high pools were mixed in known ratios over the range. Citalopram, desmethylfluoxetine, fluvoxetine, fluvoxamine, sertraline, and venlafaxine were all determined to have quadratic fits over 7.7–1300 ng/mL, similarly mirtazapine was deemed quadratic over the range 3.8–650 ng/mL and trazadone over 23–3900 ng/mL.
Matrix effects were evaluated at low (QC1) and high (QC3) concentrations in plasma (n=6) taken as a percentage of extracted solvent samples spiked to equivalent concentrations. Calculation using analyte:internal standard response ratio indicated compensation for signal enhancement or suppression by the internal standard (Table 5).
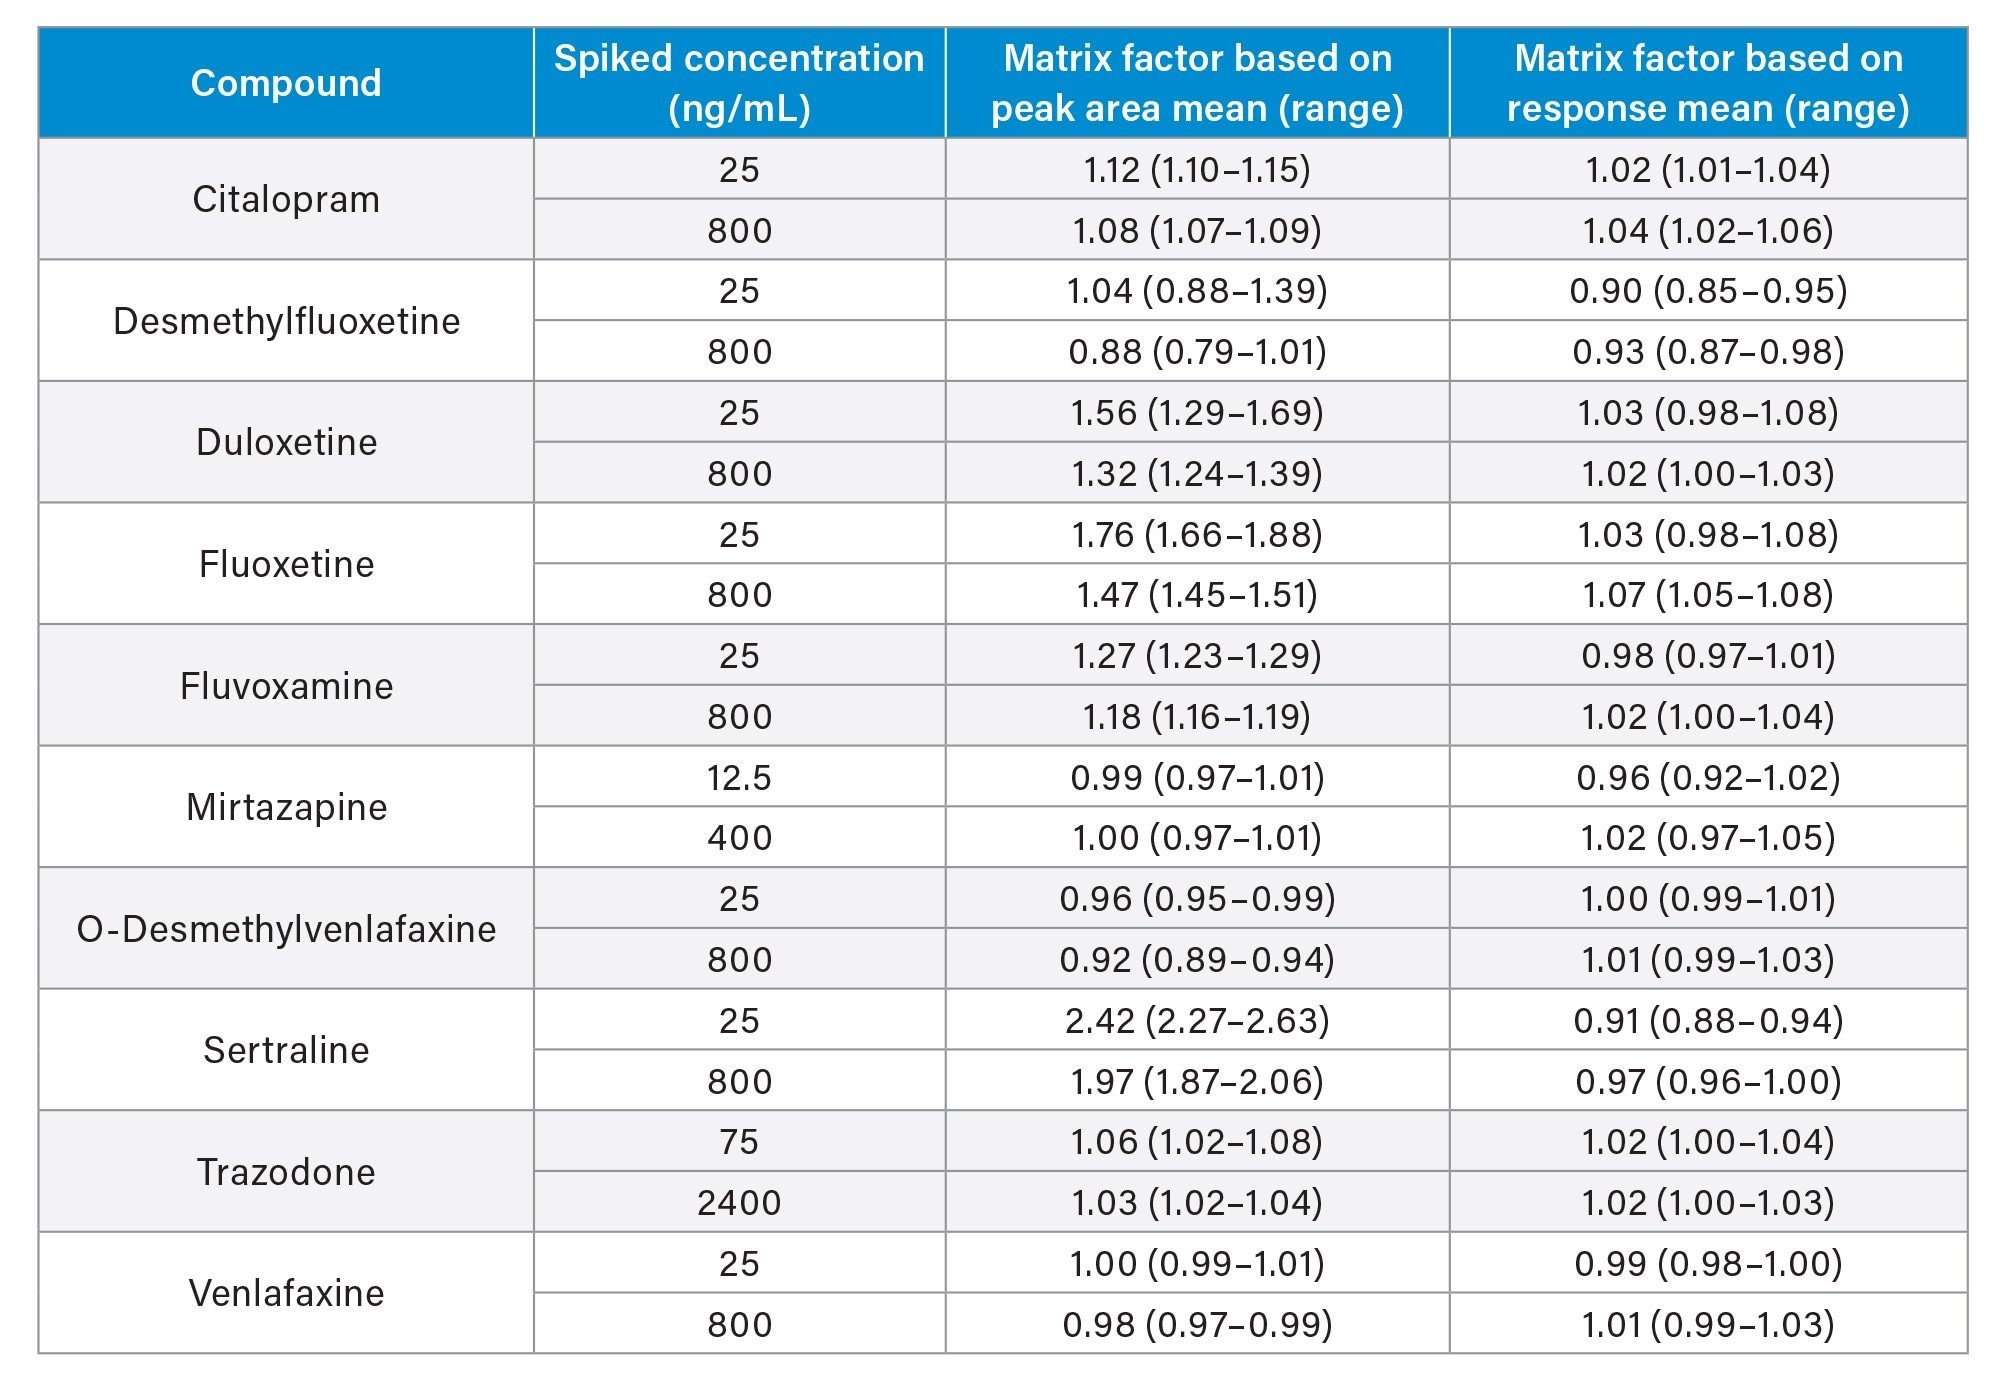 Table 5. Quantitative matrix effects summary.
Potential interference from endogenous compounds (albumin, bilirubin, cholesterol, creatinine, triglycerides, and uric acid) spiked at high concentrations was assessed by determining the recovery (n=3) from low and high pooled plasma samples (QC1 and QC3 concentrations). Recoveries ranged from 86.9–112.9%. A substance was deemed to interfere if a recovery range of 85%–115% was exceeded. Additionally, full chromatographic resolution of O-Desmethylvenlafaxine from isobaric tramadol was established.
Conclusion
Using only 50 µL of sample with fast, inexpensive, sample preparation, this analytical method demonstrated total precision and repeatability of ≤10.0% CV for ten antidepressants and metabolites over three orders of magnitude in a five-minute run time.
Additionally, no system carryover was demonstrated for the test range and matrix effects, where present, were compensated for very effectively using the stable labeled internal standards.
720007859, February 2023