Utilizing Empower™ Software to Streamline and Automate the Detection of Sample-to-Sample Differences within Peptide Maps of Biopharmaceuticals
Abstract
High-throughput biopharmaceutical workflows require efficient data analysis to minimize analysis time while providing the user with pertinent information. Waters Empower Chromatography Data System (CDS) supports all steps in the workflow from data acquisition to report generation. It also offers powerful, customizable features to meet analysis needs from process development to quality control. This study demonstrates how Empower Software can be used throughout biopharmaceutical workflows. Using Infliximab as an example, binary comparison of peptide mapping data and custom fields were employed to facilitate rapid assessment of process control parameters. Attributes of interest were selected based on peak ratio as well as their absence/presence in comparison to a reference sample analysis. Once identified, product quality attributes (PQAs) were transferred to Empower Software’s integrated impurity monitoring workflow to enable rapid monitoring and reporting using a targeted high-throughput liquid chromatography (LC) method. This comparative method provides users a workflow that can be deployed in a seamless and compliant manner to support drug development and manufacturing activity.
Benefits
- ACQUITY™ Premier LC System with the QDa™ mass detector enables sensitive and reproducible results for peptide mapping assay workflows
- Empower Software increases efficiency in data analysis for rapid identification and monitoring of attributes of interest
- Comparative workflows can be quickly adapted to downstream activity, facilitating efficient technology transfer
Introduction
In biopharmaceutical workflows, methods that can be easily deployed and assessed are critical for delivering results in a timely manner. An often-overlooked bottleneck in this process is data analysis, which traditionally has been cumbersome and often involves multiple software platforms to communicate meaningful results. This case is particularly true for peptide mapping assays which are commonly relied on in the characterization, development, and manufacture of protein-based biotherapeutics. These assays often require user intervention to complete data analysis, which can slow down the review process, decrease consistency of results, and increase risk of errors in reported results. For these reasons, software platforms that can be broadly deployed across an organization and executed in an automated fashion are highly desirable.
Waters Empower CDS is a powerful compliant-ready software platform that is readily utilized in regulated and non-regulated pharmaceutical environments. By streamlining processes within this single platform from data acquisition to report generation, users can easily adapt, transfer, and execute their workflows from development to manufacturing with increased efficiency, enabling rapid assessment and monitoring of quality attributes.
Here, we demonstrate how Empower Informatics can simplify data analysis and automate the task of highlighting sample to sample differences in a peptide mapping assay. Infliximab was used as an example to show how attributes of interest can be identified and migrated to a QC or manufacturing environment for monitoring specific attributes in Empower Software. These results demonstrate how Empower Software can be readily utilized in biopharmaceutical workflows to reduce analysis time, increase result accuracy, and enable more efficient analyses.
Experimental
Remicade® (Infliximab) samples were incubated at 37 °C for 0 weeks (no stress), 1 week, or 2 weeks. Samples were then reduced, alkylated, desalted, tryptic digested, and acidified to 0.1% formic acid. The final concentration was measured to be 0.16 µg/µL based on a peptide assay.
LC Conditions
|
LC system: |
ACQUITY Premier UPLC™ BSM, FTN Sample Manager with Column Manager |
|
Detection: |
ACQUITY Premier TUV; 10 mm analytical flow cell; wavelength = 214 nm |
|
Vials: |
QuanRecovery™ with MaxPeak™ HPS vials (p/n: 186009186) |
|
Column(s): |
ACQUITY™ Premier CSH™ C18 1.7 µm, 2.1 × 100 mm |
|
Column temp.: |
60 °C |
|
Sample temp.: |
8 °C |
|
Injection volume: |
10 µL |
|
Flow rate: |
0.200 mL/min |
|
Mobile phase A: |
0.1% formic acid in water (LCMS grade) |
|
Mobile phase B: |
0.1% formic acid in acetonitrile (LCMS grade) |
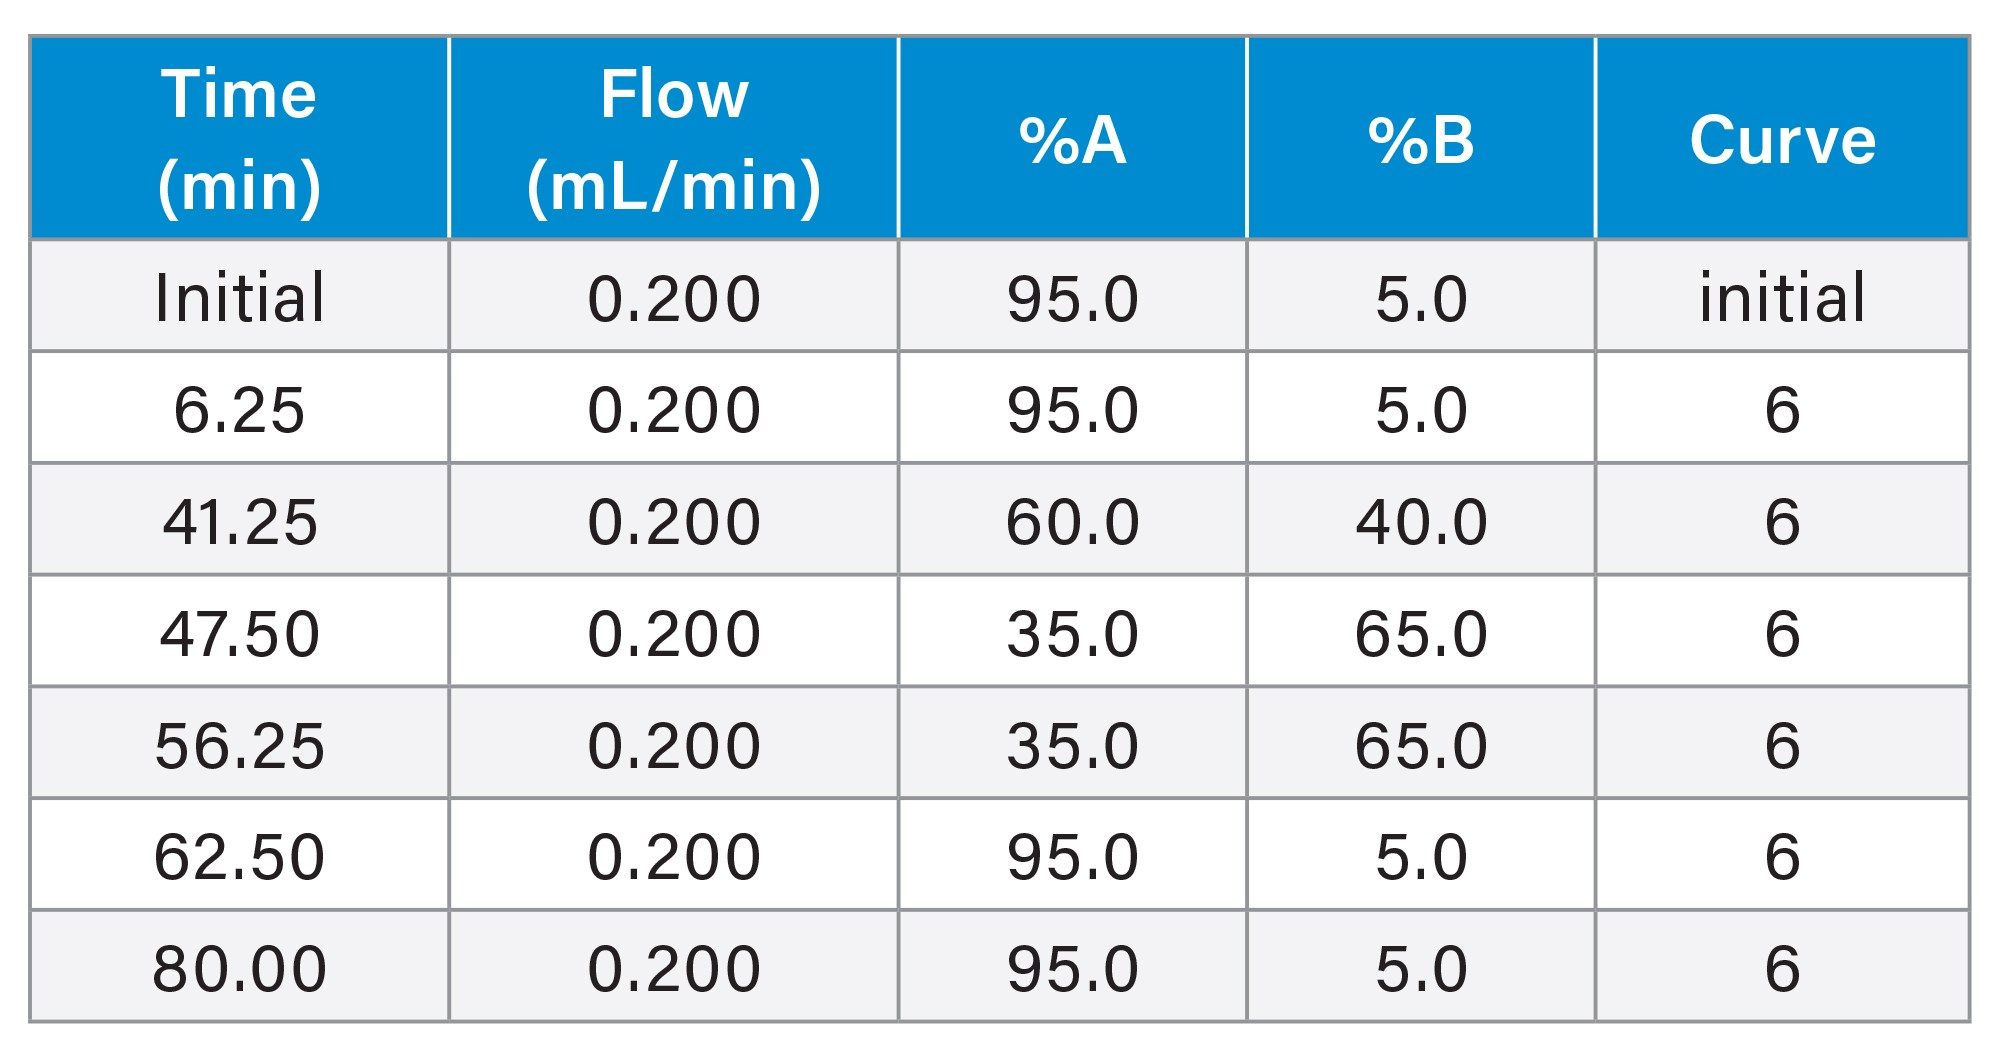
Gradient Table for Stress Study
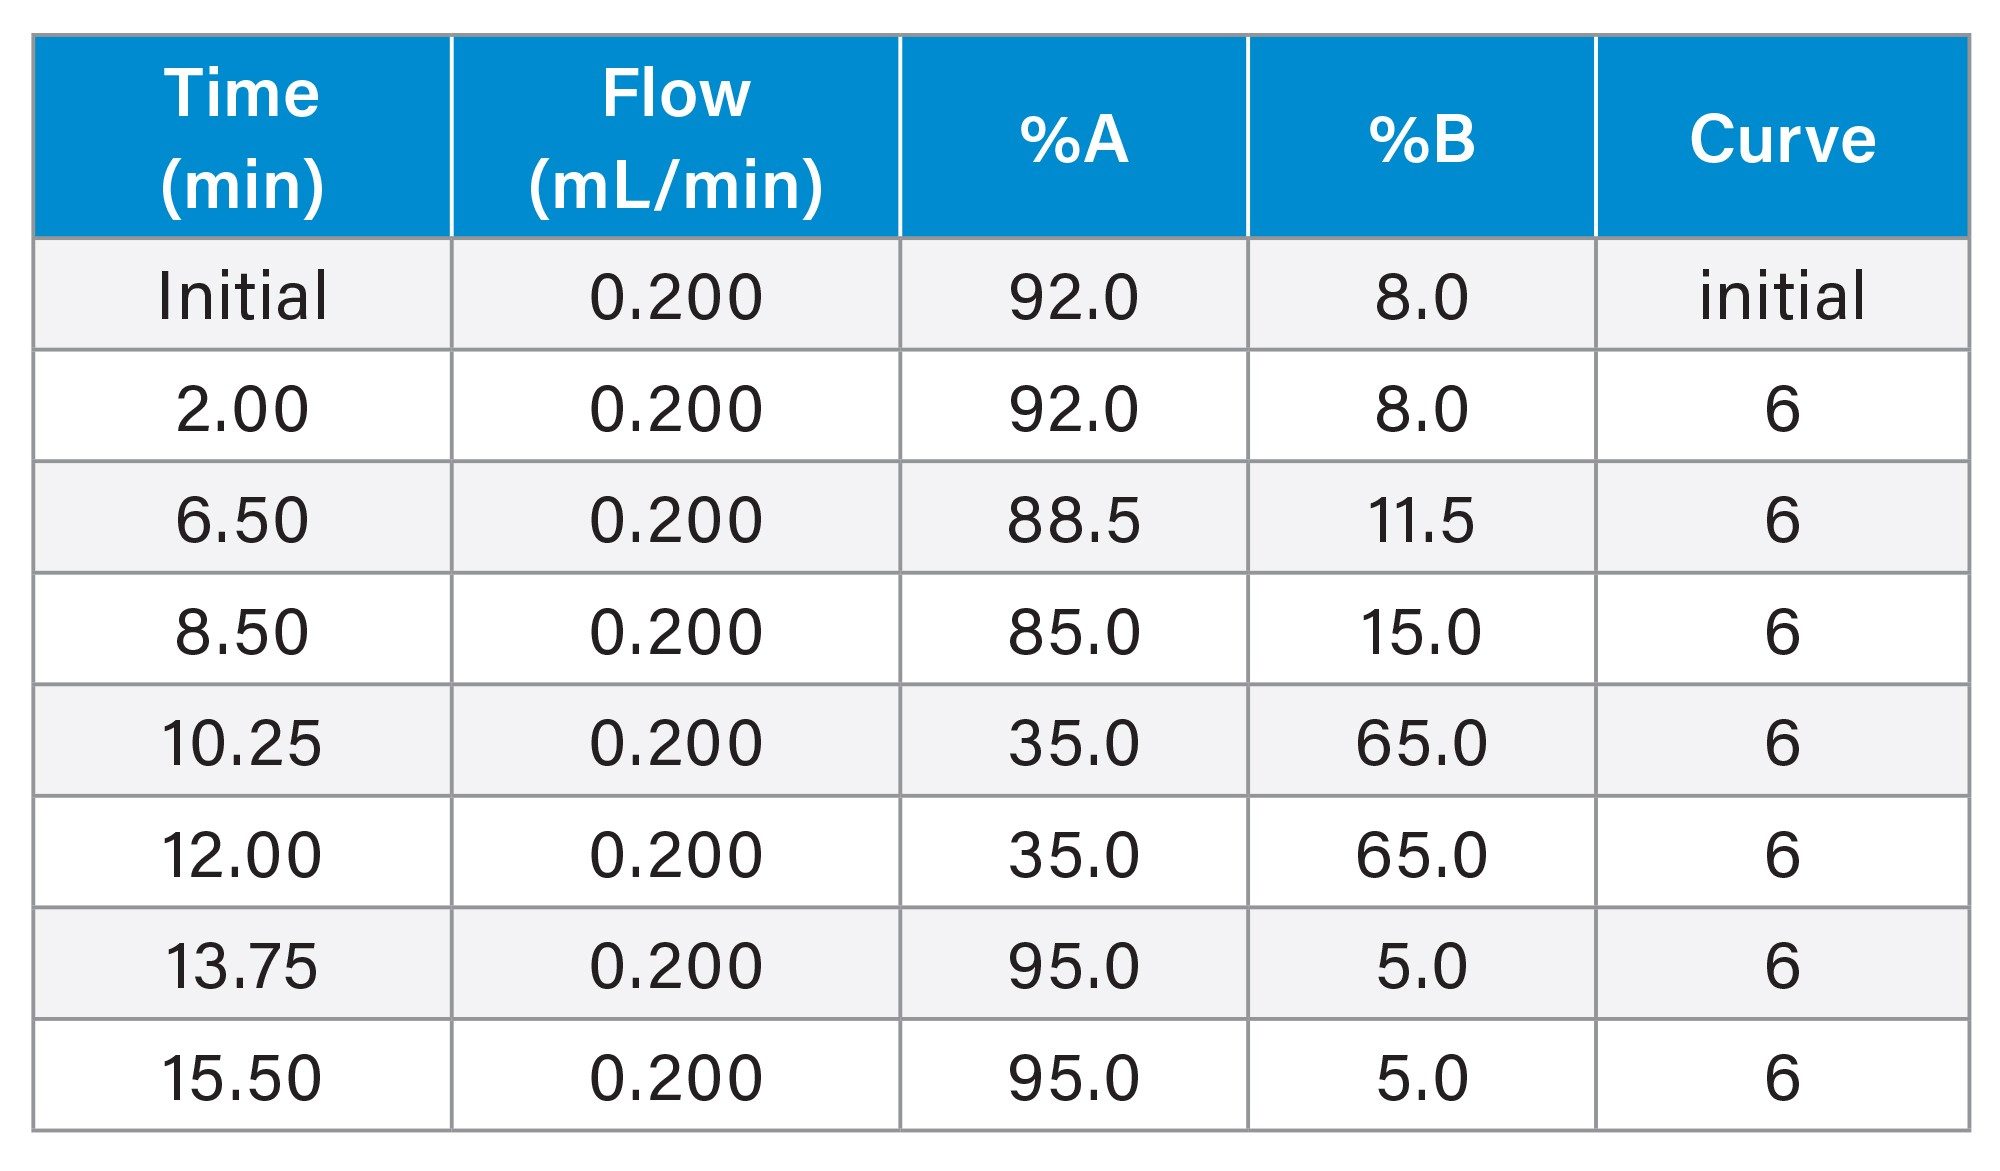
Gradient Table for Targeted LC Method
SIR Values
|
Peptide |
m/z |
|
HC:T22 |
418.2 |
|
HC:T22 [oxidized] |
426.2 |
|
HC:T42 |
561.4 |
|
HC:T42 [oxidized] |
564.6 |
|
HC:T38 |
849.2 |
|
HC:T38 [deamidated] |
849.6 |
|
HC:T07 |
469.6 |
|
HC:T07 [deamidated] |
469.9 |
MS Conditions
|
MS system: |
ACQUITY QDa |
|
Ionization mode: |
Positive scan |
|
Acquisition range: |
350–1250 m/z |
|
Capillary voltage: |
1.5 kV |
|
Cone voltage: |
15 V |
Data Management
|
Software: |
Empower 3 FR4 |
Results and Discussion
Forced degradation is commonly used in the pharmaceutical industry to support the development of assays used for process control, impurity profiling, stability, and quality release assays.1 Typically the stressors (thermal, chemical, or mechanical) are more extreme than what the product is anticipated to encounter to accelerate degradation processes and elevate impurity levels for easier detection and characterization. For biopharmaceuticals, these studies are carried out in both a top-down (intact/subunit) and bottom-up (peptide) manner to provide complementary insights into product quality attributes (PQAs) that may impact efficacy and safety. As drug products migrate through the pipeline from development to manufacturing, critical quality attributes (CQAs), which are PQAs that are critical to the products safety and efficacy, are identified and actively monitored in downstream quality control (QC) workflows. Given the critical role these assays have in the development and manufacturing of biopharmaceuticals, a stress testing experiment was carried out to demonstrate how Empower Software tools can support and automate data analysis for these types of workflows.
Instruments that can accommodate high-throughput analyses are needed to maximize productivity in biopharmaceutical laboratories. Assay sensitivity is also important to ensure all attributes of interest are observable and monitored accurately as methods are migrated downstream. Lastly, assay reproducibility is critical as consistent results are needed to support assay validation and avoid out of specification incidents. Previous studies have shown how the ACQUITY Premier System (BSM-configuration) can deliver highly reproducible results for peptide mapping applications under conditions that are amenable to both process development (higher-resolving longer gradients) and manufacturing environments (higher-throughput shorter gradients).2 This same study also demonstrated that the ACQUITY QDa Mass Detector was well suited for the detection of lower-abundance species with a dynamic range that spanned several orders of magnitude. For these reasons, Premier UPLC BSM platform was used with both ultra-violet (UV) and mass spectrometer (MS) detectors to generate the data demonstrating how Empower-based methods can be adapted for either UV or MS-based workflows.
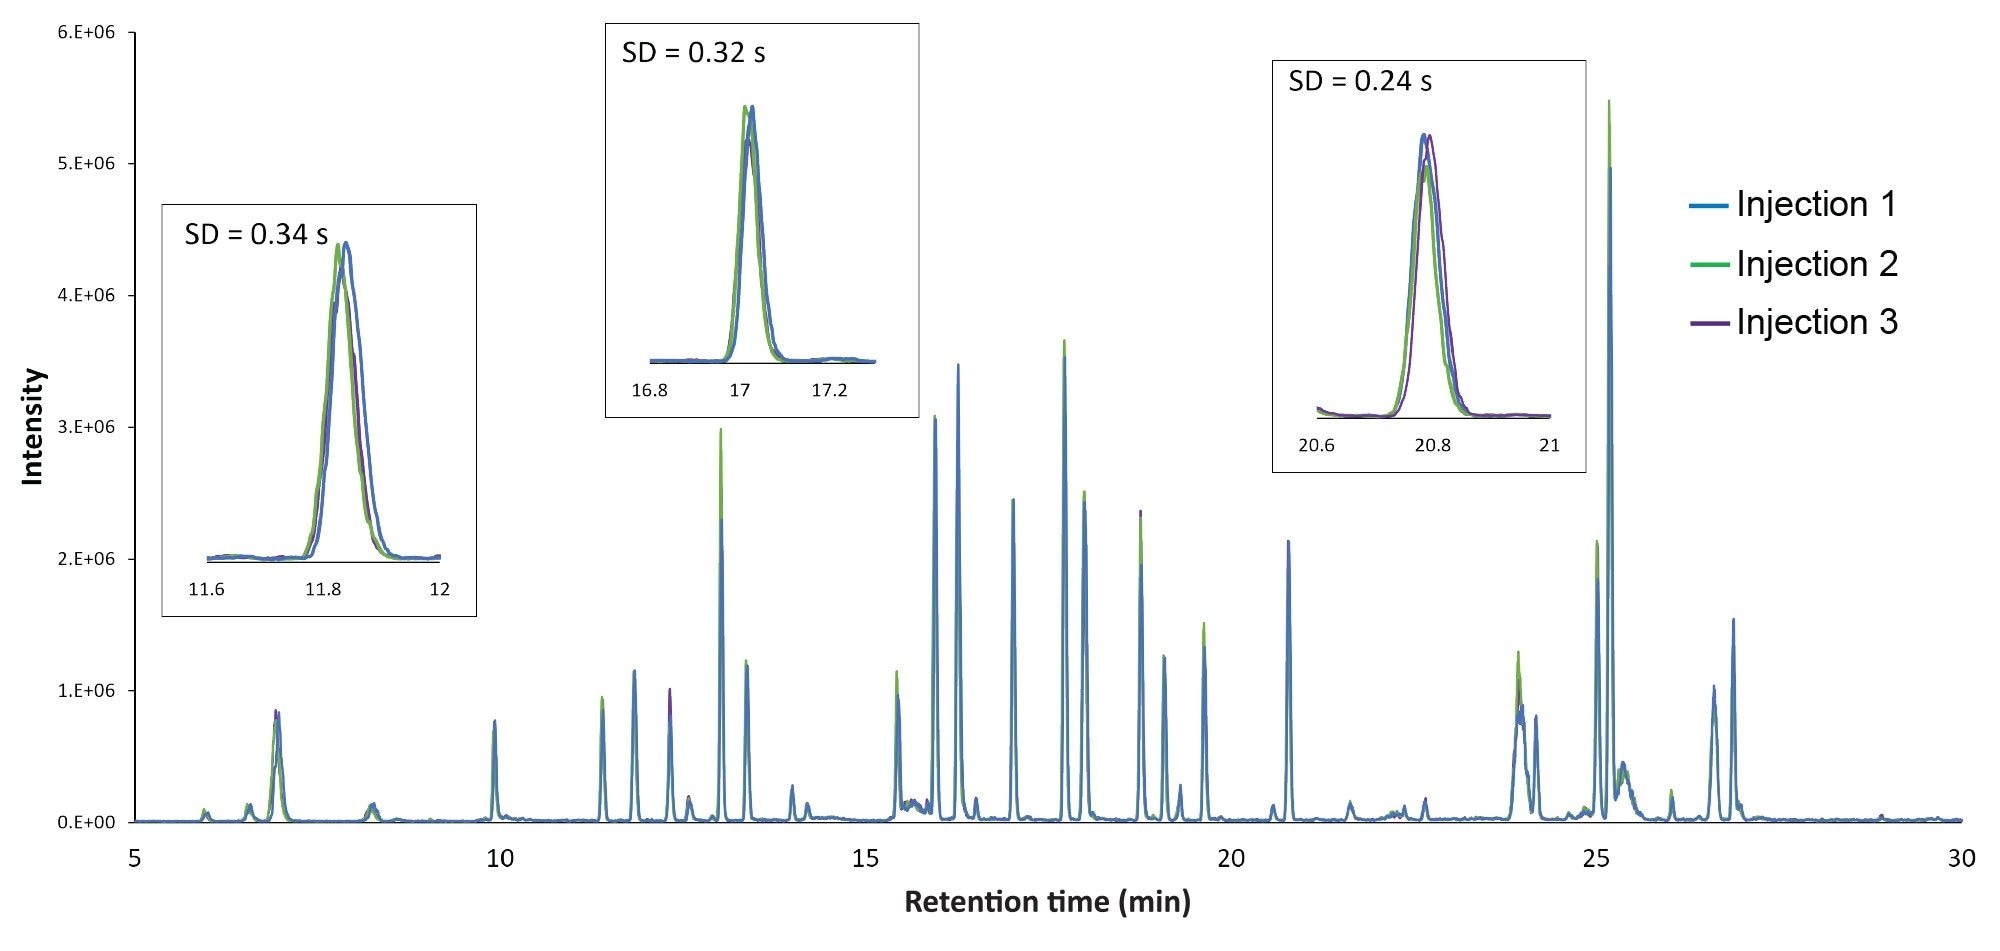
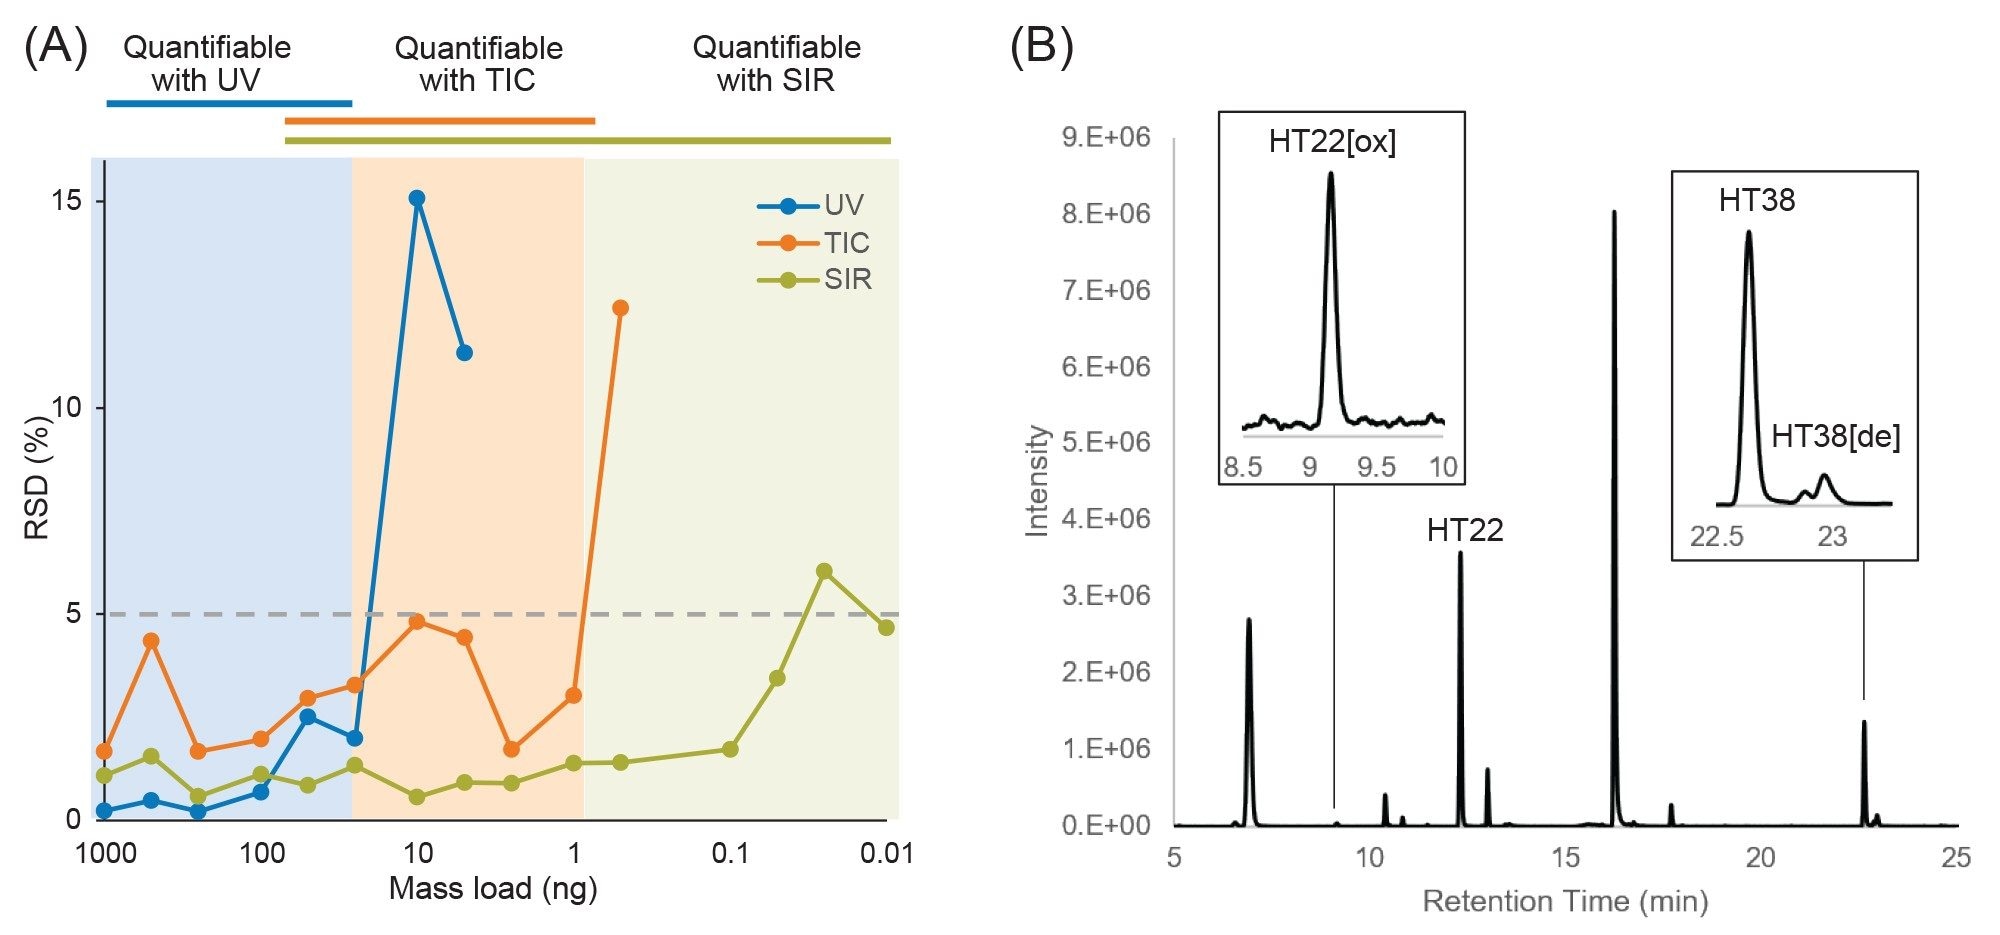
Performance achieved using this LC-UV/MS platform is shown in Figure 1, which displays an overlay of chromatograms from three replicate injections of an Infliximab digest. The chromatograms show peak alignment without the use of preprocessing steps such as retention time alignment. Similar to previously reported results, the retention time standard deviation was less than one second for most peptides, with the average standard deviation being 0.45 s, or 0.06% relative standard deviation. Furthermore, the increased sensitivity and dynamic range afforded by the ACQUITY QDa Mass Detector in this hyphenated configuration enabled reproducible quantitation of peptides at 10 pg or lower mass loads (Figure 2A), which is particularly useful for monitoring low-abundance modifications or impurities that can often be present at intensities that are orders of magnitude lower than the native peptide. Modified versions of peptides are often present at only 1% to 5% the abundance of their native forms, making them challenging to detect with a UV detector. In this aspect, once attributes of interest are identified, they can be tracked by their mass (m/z value) with full MS scans or selected ion recording (SIR) scans for increased sensitivity with high selectivity (minimal noise interference), as shown in Figure 2B.3 The observed reproducible performance using the proposed system configuration makes the ACQUITY Premier System ideal as a flexible UPLC Platform that can be deployed in upstream (MS-based) and downstream (UV-based) labs for comparative studies and interlaboratory method migration.
While peptide mapping studies provide key insights into the attributes contributing to biotherapeutic safety and efficacy, processing large volumes of data for the hundred or more detected components in a mAb tryptic digest map can be time consuming and require manual interventions, reducing productivity. Empower Software allows users to generate custom fields that can simplify and automate data analysis. In forced degradation studies, changes in peptide abundances need to be compared between control and stressed samples. Traditionally such analyses may involve exporting the data for every injection to external software, such as a spreadsheet, which breaks compliance and requires user intervention to manipulate the data.
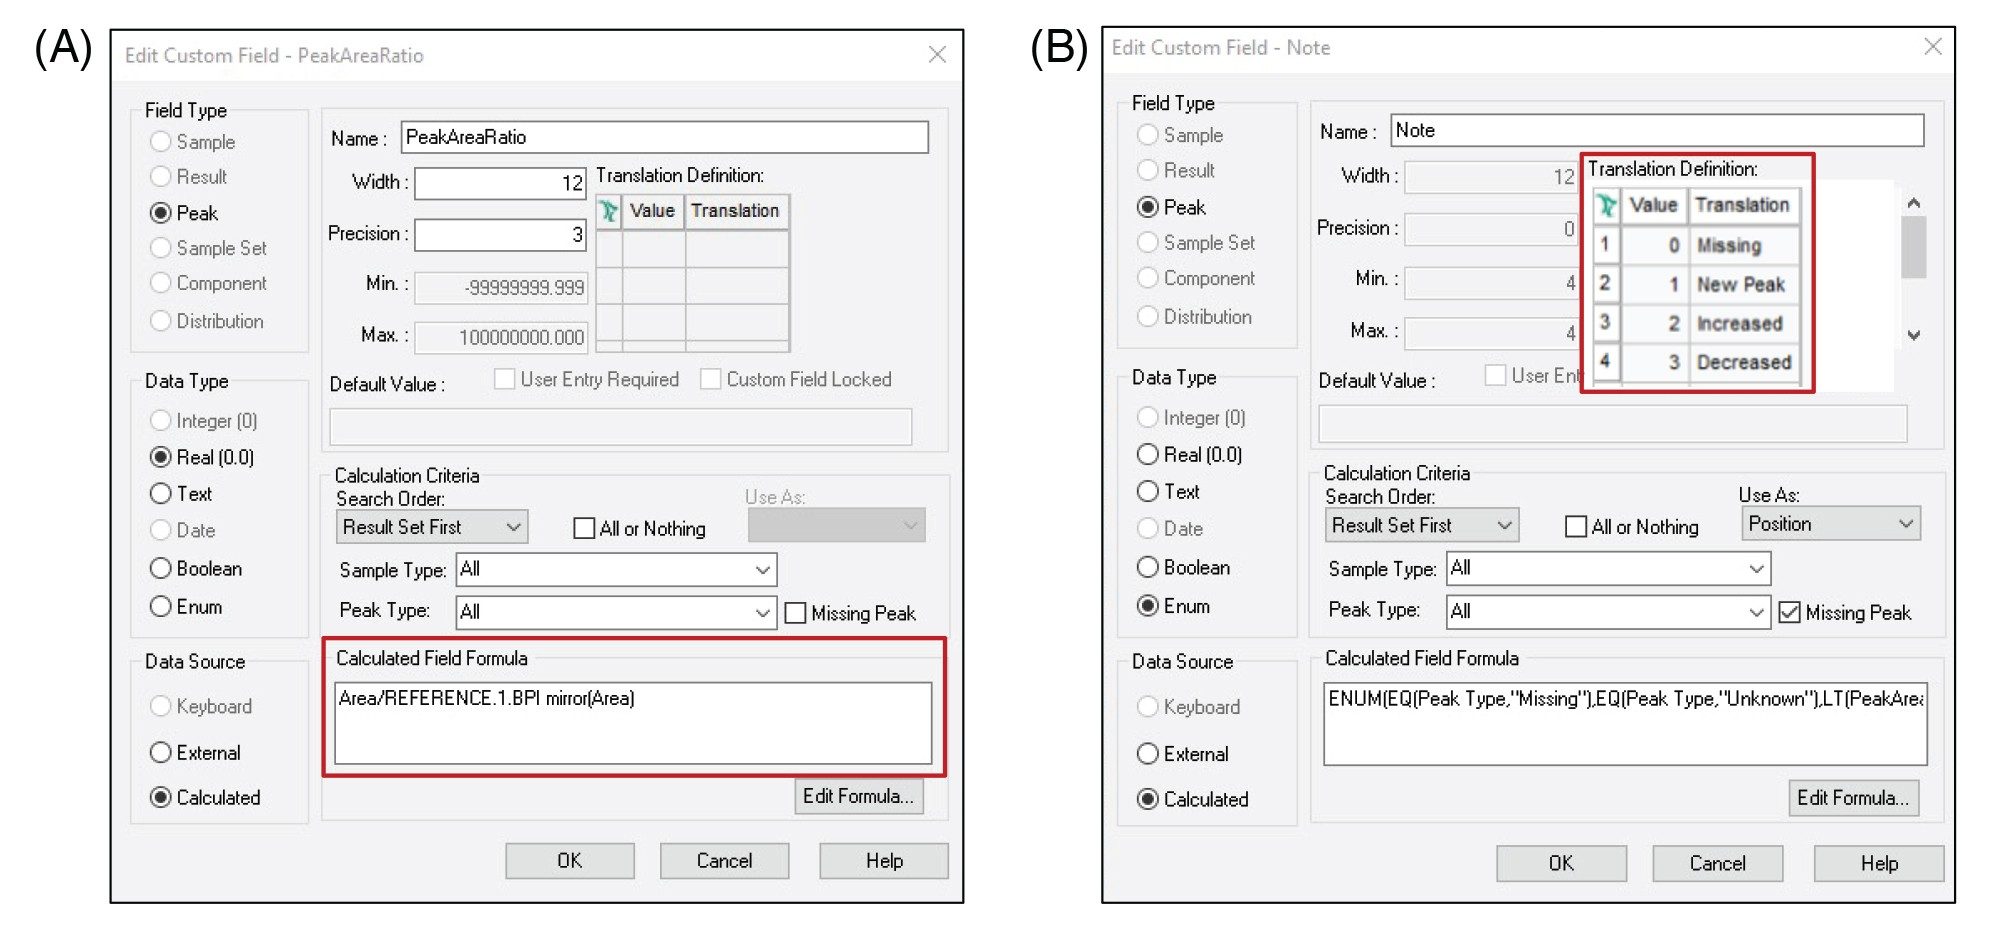
However, in Empower Software, a custom field can be set up to automatically calculate the peak area ratio between the stressed and control sample and report this value. Figure 3A shows how this simple custom field is set up. This information can then be distilled into a simple “note” using a second enumerated custom field that indicates if a peptide is increased, decreased, new, or missing compared to a reference chromatogram (Figure 3B). To further streamline the comparison, the proposed method applies filters to display information only on the peptides that are unique and/or exceed user defined intensity ratio thresholds. This eliminates the need to manually sift through tables of predominantly similar data and reduces the risk of overlooking results across large or complicated data sets. An example of results using this comparative workflow is shown in Figure 4.
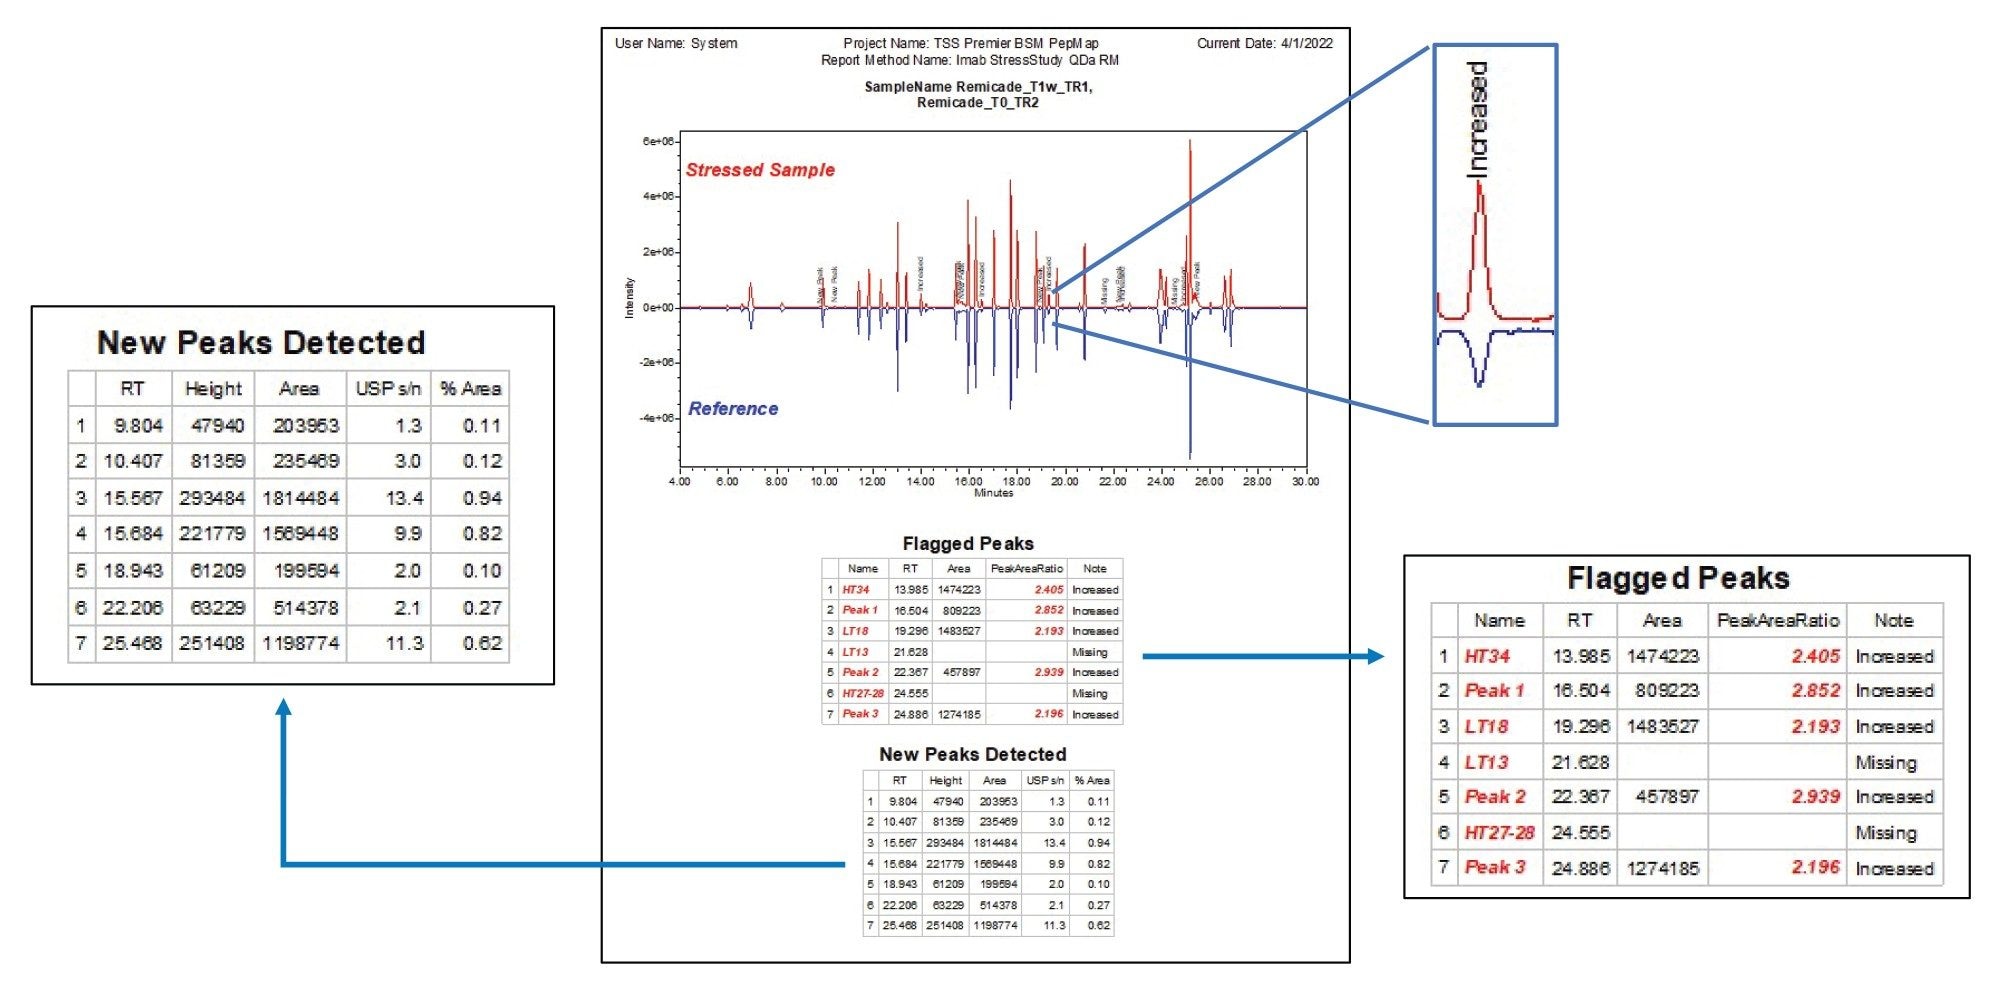
As shown in Figure 4, the differences between the stressed sample and reference is visualized in chromatograms by generating a binary comparison plot. The reference sample is reflected along the horizontal axis, creating a side-by-side comparison of each peak where peaks of interest are labeled with the “note” custom field for easy visualization of sample differences. Tabular data beneath the chromatograms lists the flagged peaks based on the user-defined criteria along with their relevant information. An additional table was generated to document the new peaks detected in the stressed sample that are not present in the reference, allowing users to identify potential impurities or new degradation products. In this instance, as shown in the figure, 7 out of the 41 peaks being monitored were identified as either missing or exceeding the threshold for change (less than 0.5-fold or above 2-fold difference from reference), and seven new peaks were detected that were absent in the reference. With the side-by-side display of visual and tabular data, users can quickly review results and determine data points of interest. Overall, this strategy expedites sample processing in a way that is customizable to analysis needs and can be readily adapted to downstream activity requiring more targeted analysis.
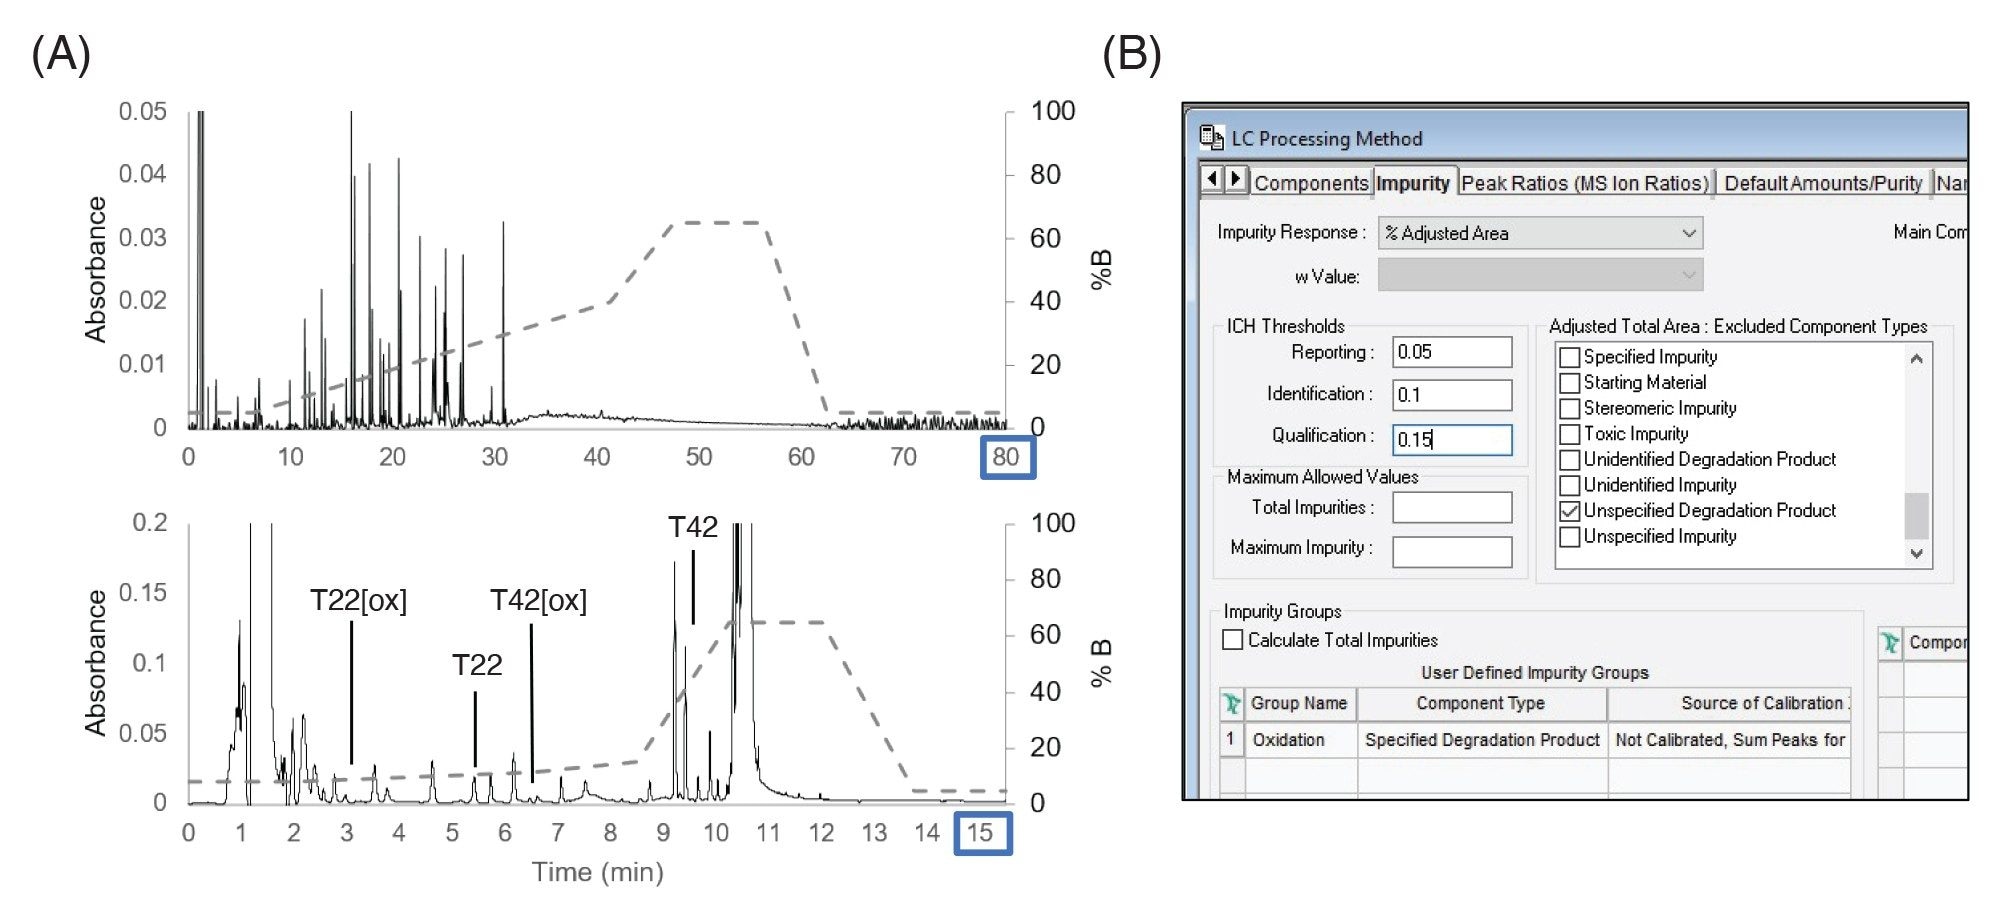
The forced degradation method was migrated to a stability or process development type of workflow where larger numbers of samples need to be rapidly analyzed and quickly assessed for critical attributes and impurities. In this example, as shown in Figure 5A, the 80 minutes forced degradation method was condensed to a 15.5 minutes focused gradient to monitor two peptides and their associated oxidized forms representative of CQAs that require monitoring. The LC method was able to baseline-resolve these peptides enabling use of more QC-friendly UV detectors. The standard deviation in retention time was 0.16 seconds and the relative standard deviation of peak area was 1%, indicating sufficient reproducibility of the targeted method for these purposes. Custom fields were set up to compare the peptides to a reference and identify new peaks in a similar fashion as was done in the forced degradation study. Empower’s ability to summarize impurity results using the impurity tab was enabled, as shown in Figure 5B. This supported the setting of thresholds for impurities based on regulatory guidance, enabling simplified data analysis and reporting without requiring programming of additional custom fields.4,5
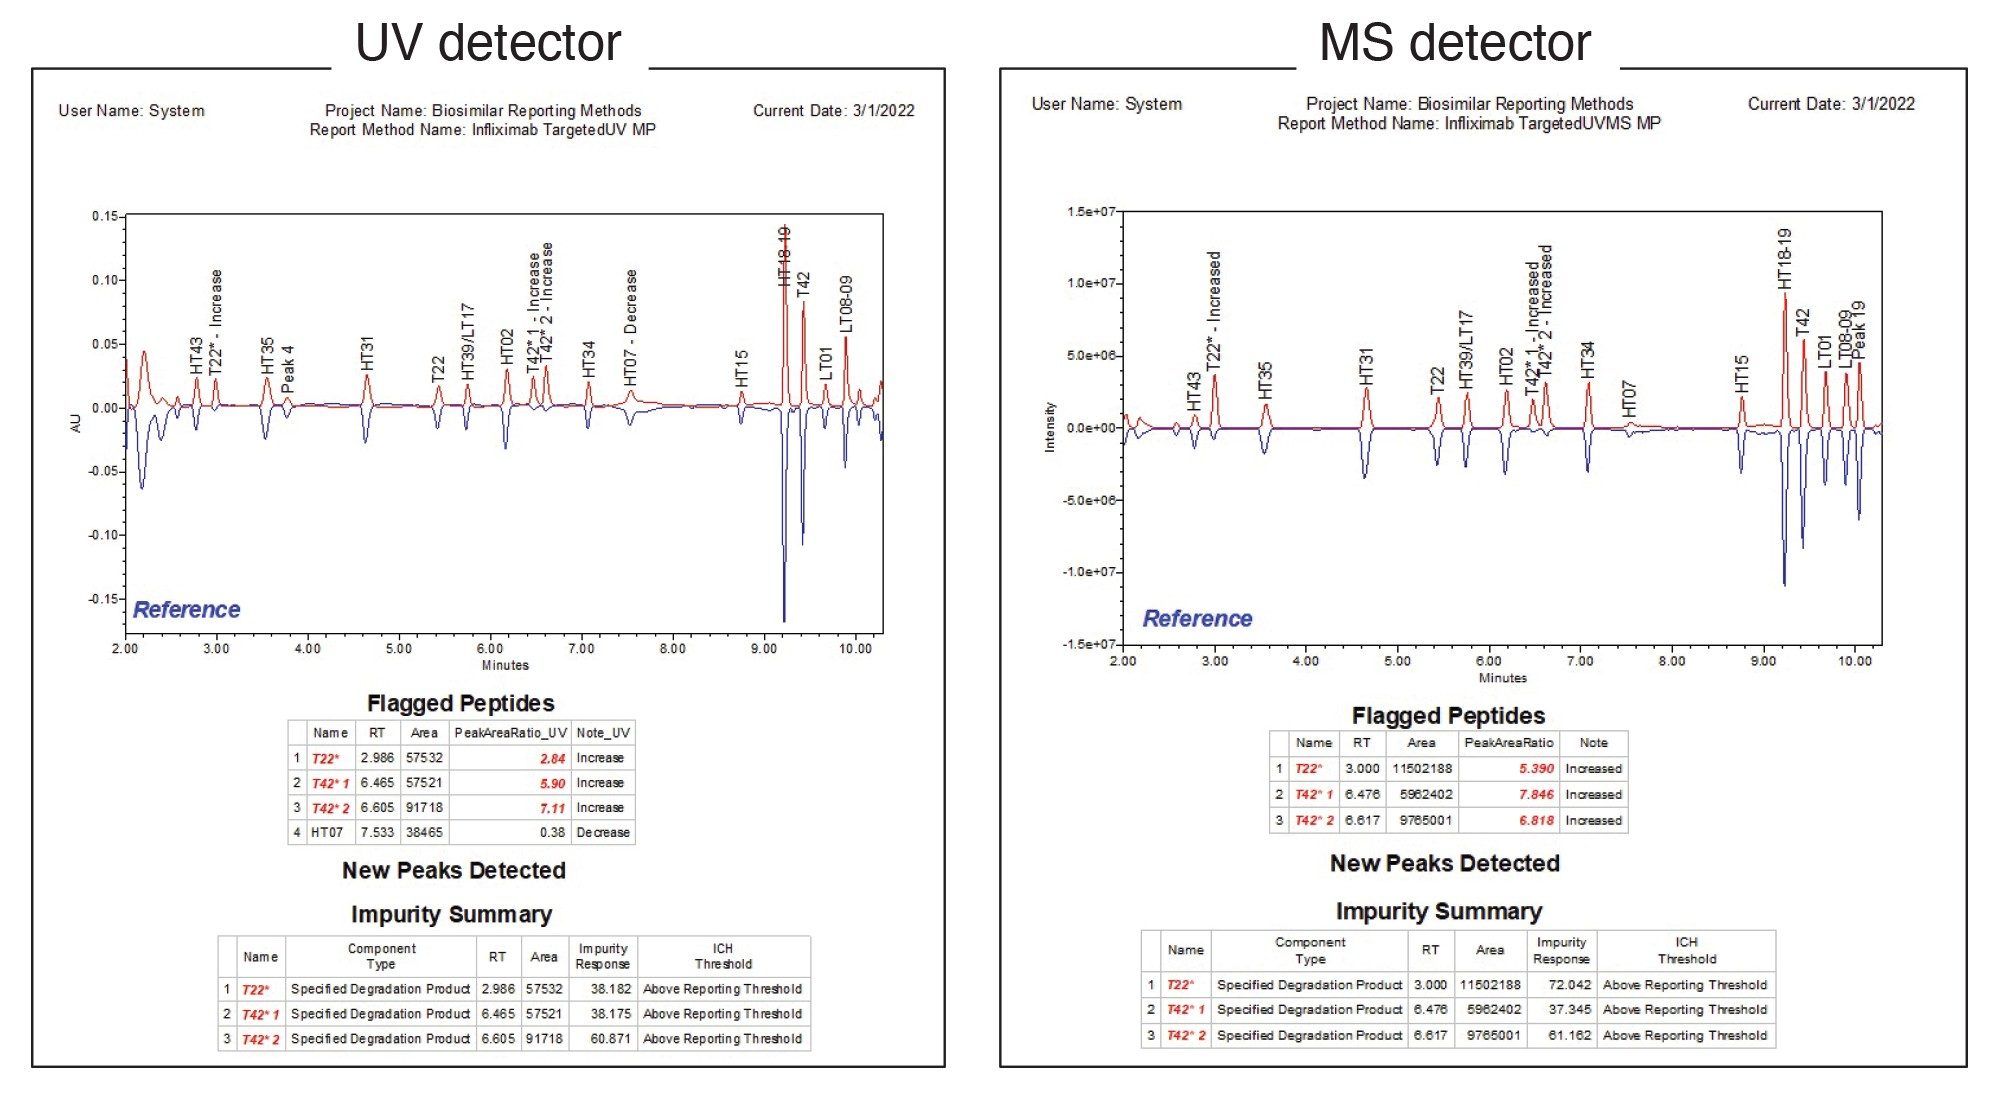
The report for this type of workflow is shown in Figure 6, where the “unknown” and reference samples were both infliximab samples with different concentrations of the spiked modified peptides. As shown in the figure, the method is suitable for both MS and UV detectors. The “flagged peptides” and “new peaks detected” tables are based on the same fields as the forced degradation study to highlight deviations from the reference sample. The impurity summary section details impurity response (here defined as the percent adjusted area of each impurity) for each modified peptide, including oxidized T22 and two isomers of oxidized T42, as well as flagging whether the peptides have exceeded the ICH reporting threshold. With this type of automated report, users can quickly evaluate samples and determine if they meet specification or require investigation. A summary report can also be generated that lists the impurity responses for all injections, making it easy to rapidly evaluate a larger batch of injections (data not shown). By tailoring data processing and reporting methods in Empower Software to automatically display the exact result critical to each assay, lab efficiency and productivity can be maximized, and compliance risks minimized, thus saving both time and resources in the effort to release safe and effective drugs to the patient faster.
Conclusion
In biopharmaceutical drug development, streamlined and automated software solutions are critical to ensuring efficient workflows and removing bottlenecks and errors caused by manual data analysis. This study showcases the ability of Empower Software to support biopharmaceutical drug development and commercialization by customizing data reports to each analysis’s specific needs for critical assay measurements. Custom fields using binary approaches enable rapid comparison of samples to a reference. This comparative approach is easy to deploy in development and can be quickly adapted to support downstream activity. In conjunction with the high-quality results achievable with the ACQUITY Premier LC System equipped with optical and/or routine mass detection, Empower Software offers streamlined solutions to maximize efficiency across attribute characterization and targeted attribute monitoring biopharmaceutical workflows.
References
- Haw A, Wiggenhorn M, van de Weert M, Garbe JHO, Mahler H, Jiskoot W. Forced Degradation of Therapeutic Proteins. J Pharm Sci. 2012 March, 101(3), 895–913.
- DeLaney K, Birdsall RE, Yu YQ. Improving Peptide Mapping Studies and Reducing Assay Failures Through Reproducible Performance Using the ACQUITY Premier UPLC System (BSM). Waters Application Note. 2022 Apr; 720007593.
- Birdsall RE, McCarthy SM. Increasing Specificity and Sensitivity in Routine Peptide Analyses Using Mass Detection with the ACQUITY QDa Detector. Waters Application Note. 2015 Apr; 720005377.
- Koshel BM, Birdsall RE, Yu YQ. LC-UV-Based Synthetic Peptide Impurity Tracking and Reporting with Compliant-Ready Empower 3 Software. Waters Application Note. 2017 Apr; 720005968.
- Koshel BM, Birdsall RE, Yu YQ. Using Empower 3 Software for Monitoring Synthetic Peptide Impurities with an ACQUITY QDa Detector for Improved Confidence in Analysis. Waters Application Note. 2017 Apr; 720005967.
720007610, April 2022