Simultaneous Quantification of 16 Furanocoumarins in Essential Oils Using a Robust and Sensitive Triple Quad LC-MS/MS Method
Abstract
Furanocoumarins are a diverse class of natural products that are commonly found in various plant species and citrus fruits. Furanocoumarins are linked to phototoxicity which raises safety concerns as citrus fruits oil extracts are commonly used in consumer products such as cosmetics and perfume as well. This application note demonstrates a 15 minute per sample robust and sensitive UPLC-MS/MS quantification method for furanocoumarins in essential oils using the Xevo™ TQ-XS. The analytical method exhibited good linearity from 0.5–1000 ng/mL for all furanocoumarins except for 6,7-Dihydroxybergamottin (5–1000 ng/mL), with R2 >0.998 and residual percent <22.5%. Limit of quantitation (LOQ) of 0.5 ng/mL was achieved for all compounds, and LOQ of 6,7-Dihydrobergamottin is at 5 ng/mL. Four isomeric pairs were well-resolved on the ACQUITY™ UPLC™ CSH™ Fluoro-Phenyl Column. Matrix effect study showed that there is insignificant matrix effect of furanocoumarins in orange essential oil matrix (<30%), and solvent calibration curve could be used for quantitation of furanocoumarins in various essential oil samples. By using dilution method, the current method established is sufficient to meet the regulation limit of 1 mg/kg as proposed by the regulation from European union.
Benefits
- A rapid, robust, and sensitive analytical method was developed to accurately quantify 16 furanocoumarins in essential oil samples using the ACQUITY UPLC I-Class coupled with the Xevo TQ-XS Triple – or Tandem- Quadrupole Mass Spectrometer
- Separation of four pairs of structural isomers in the furanocoumarin mixture were easily achievable on the ACQUITY UPLC CSH Fluoro-Phenyl Column. This allows selective and specific identification with accurate quantitation of each isomer which has similar MRM transition
- No significant matrix effect was observed for low, mid, and high levels of furanocoumarins (10, 100, and 1000 ng/mL) in orange essential oil matrix. Hence, solvent calibration curves can be used to quantify furanocoumarins in essential oil samples, simplifying the steps needed for accurate quantitation
- The developed method was able to achieve an LOQ of 0.5 ng/mL for 15 furanocoumarins except for 6,7-Dihydroxybergamottin with an LOQ at 5 ng/mL. This is lower than the regulation limit of 1 mg/kg from European Union, Regulation (EC) No 1223/2009
Introduction
Furanocoumarins or furocoumarins are a diverse class of natural products found in various plant species and in citrus fruits such as grapefruits and lemons.1 Presence of furanocoumarins can be an issue as oil extract from citrus-fruits are often used in consumer products such as cosmetics, perfume, sun protection, bronzing formulations, and shampoo.2 Based on previous research, there are safety concerns due to the phototoxicity nature, which will affect drug metabolism or even causes acute rashes.3 Hence, there is a need for monitoring of these compounds in various potential sources.
Furanocoumarins are controlled in the European Union via the Regulation (EC) No 1223/2009 on cosmetic products. Entry 358 to Annex II bans directly added furanocoumarins, except for contributions coming from natural essential oils or extracts. The sum of furanocoumarins in sun protection and bronzing formulations are limited to 1 mg/kg.4 Some common analytical methods for the analysis of furanocoumarins include high pressure liquid chromatography (HPLC) coupled with spectrophotometric (such as UV)5 or mass spectrometric (MS) detection.2 While furanocoumarins concentration in citrus essential oils allow for direct analysis using both HPLC-UV and LC-MS, the low levels in cosmetic products in combination with the complexity of the cosmetic requires more selective and sensitive analytical technology such as tandem quadrupole LC-MS/MS.
In 2007, the International Fragrance Association (IFRA) proposed six analytes (bergapten, bergamottin, byakangelicol, epoxybergamottin, isopimpinellin, and oxypeucedanin) as marker compounds for the furanocoumarin family. Markers were selected based on their overall occurrence and concentrations in citrus essential oils where they are often present at levels >1000 ppm.6 In this application note, a rapid and sensitive method was developed for the quantitation of 16 furanocoumarin in essential oils using the UPLC coupled with Xevo TQ-XS.
Experimental
Materials and Methods
Calibration Curve Standard Preparation
16 furanocoumarins standard mix (Supelco, 93102) in acetonitrile at 250 mg/kg each were used to prepare solvent and matrix-matched calibration curves. Eight-point calibration curves were prepared by serial dilution to 0.5, 1, 5, 10, 50, 100, 500, 1000 ng/mL, using acetonitrile for solvent calibration curve and blank orange essential oil for matrix matched calibration.
Essential Oil Sample Preparation
Essential oil samples (Grapefruit) were diluted by 100-fold using acetonitrile before LCMS injection.
Matrix Effect Study Sample Preparation
16 furanocoumarins standard mix (Supelco, 93102) was diluted to 10, 100, and 1000 ng/mL using acetonitrile and orange oil blank matrix (Supelco, PE05354) to create spiked samples in solvent and matrix respectively.
Chromatographic Conditions
|
LC system: |
ACQUITY UPLC I-Class |
|
Column(s): |
ACQUITY UPLC CSH Fluoro-Phenyl, 2.1 X 100 mm, 1.7 μm (p/n: 186005352) |
|
Column temp.: |
40 °C |
|
Sample temp.: |
10 °C |
|
Injection volume: |
1 µL |
|
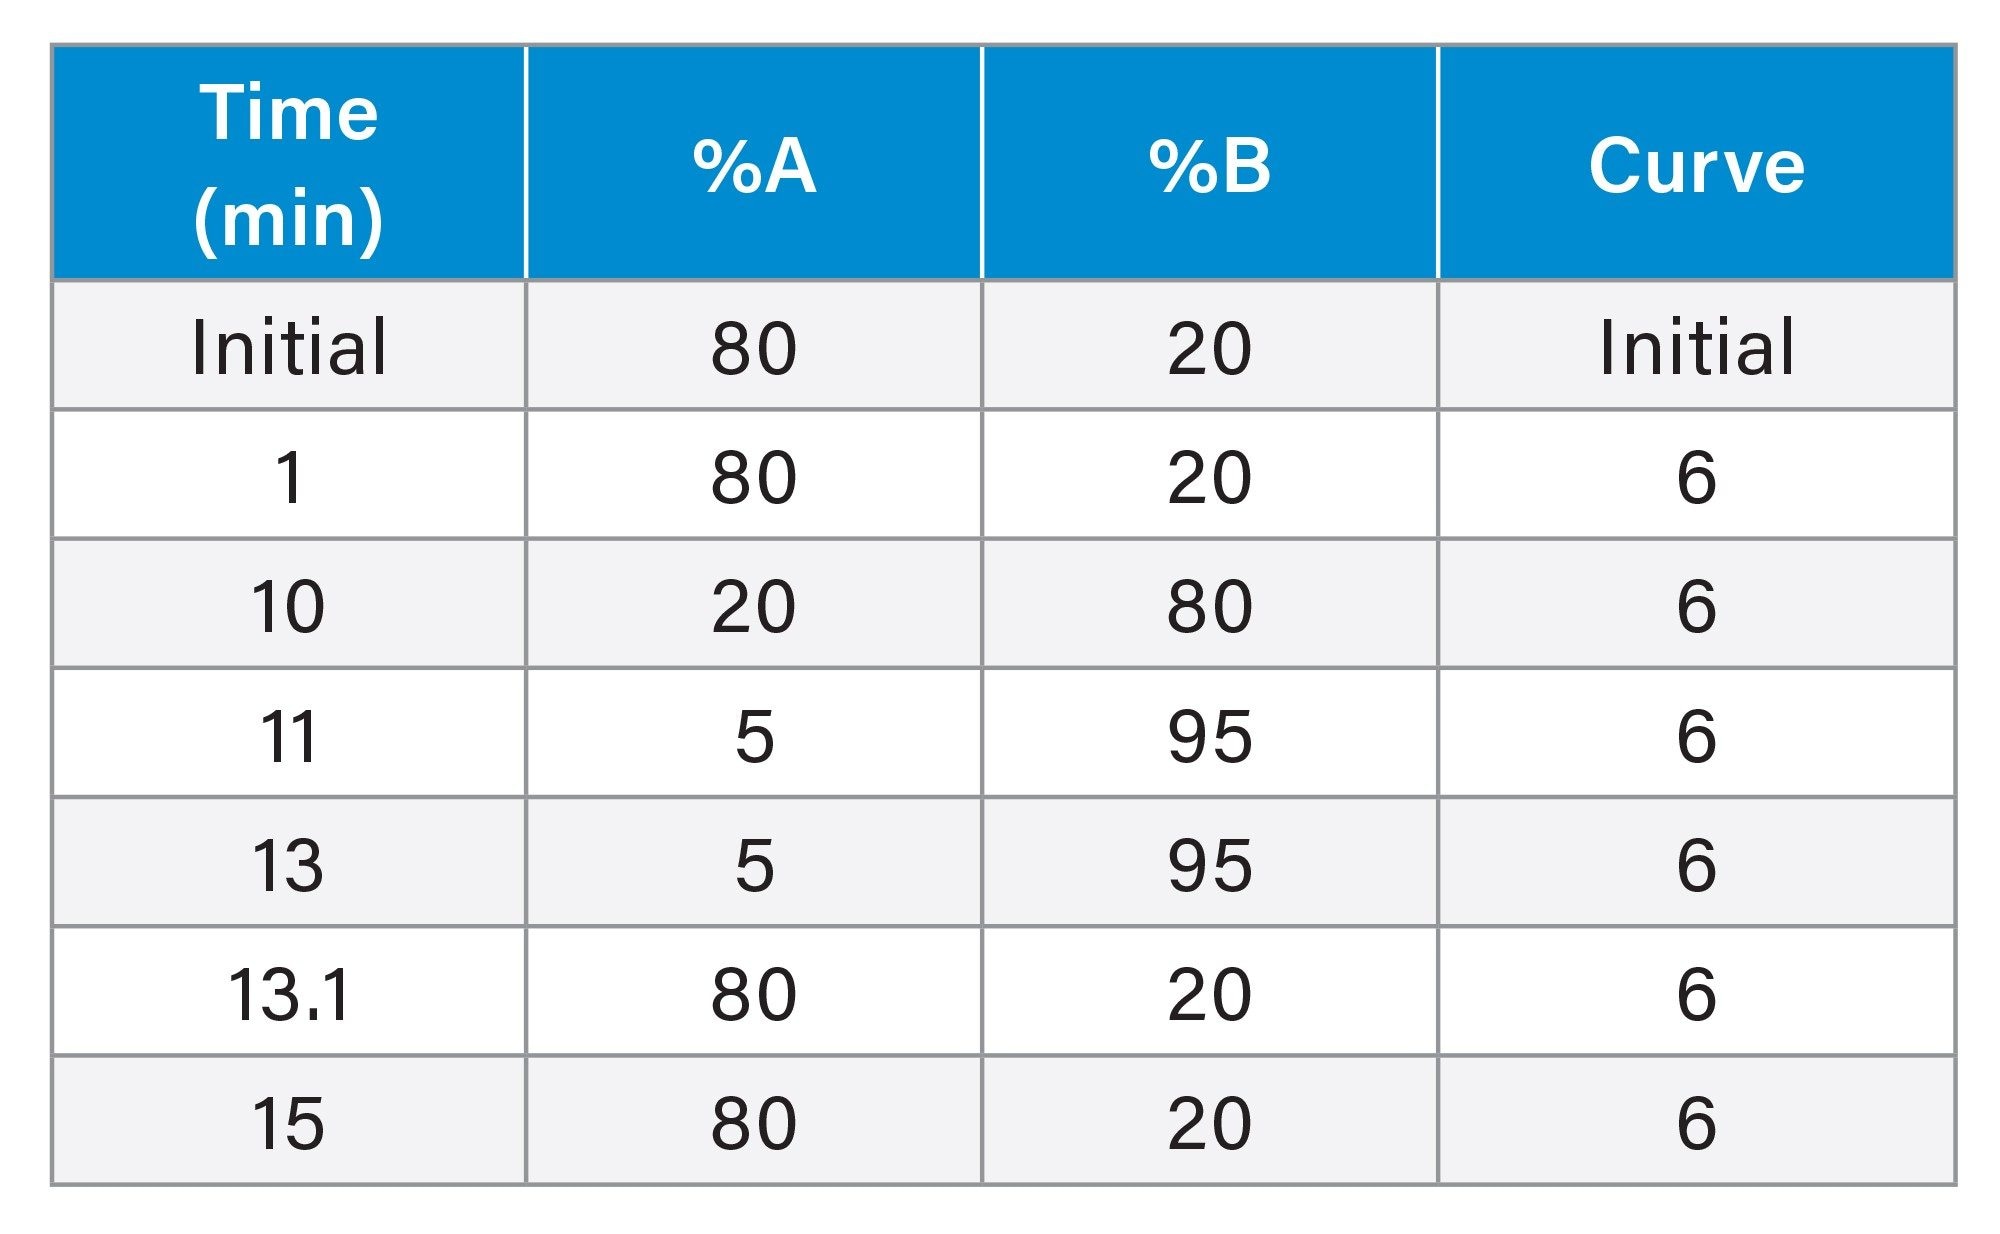
Flow rate: |
0.4 mL/min |
|
Mobile phase A: |
0.1% Formic acid in water |
|
Mobile phase B: |
0.1% Formic acid in acetonitrile |
Gradient Table
Mass Spectrometer Conditions
|
MS system: |
Xevo TQ-XS |
|
Ionization mode: |
ESI+ |
|
Desolvation temp.: |
400 °C |
|
Desolvation gas flow (L/Hr): |
1000 |
|
Cone gas flow (L/Hr): |
150 |
|
Source temp.: |
130 °C |
|
Capillary voltage: |
1 kV |
Data Management
|
Chromatographic software:
|
MassLynx™ v4.2 |
|
MS software: |
Masslynx v4.2 |
|
Quantitation software: |
TargetLynx™ |
Setting up of MRM Transitions
Data was collected using the time segmented MRM transition mode, which contains two transitions for each furanocoumarin. The compounds MRM transitions and their respective parameters such as cone voltages and collision energies were optimized using injection based QuanOptimize. Transitions marked with * are the quantifiers in Table 1. During optimization, we observed that Byakangelicin fragment ion (m/z 317) has better sensitivity compared to the parent ion (m/z 335), thus m/z 317 was used as the precursor ion in Q1.
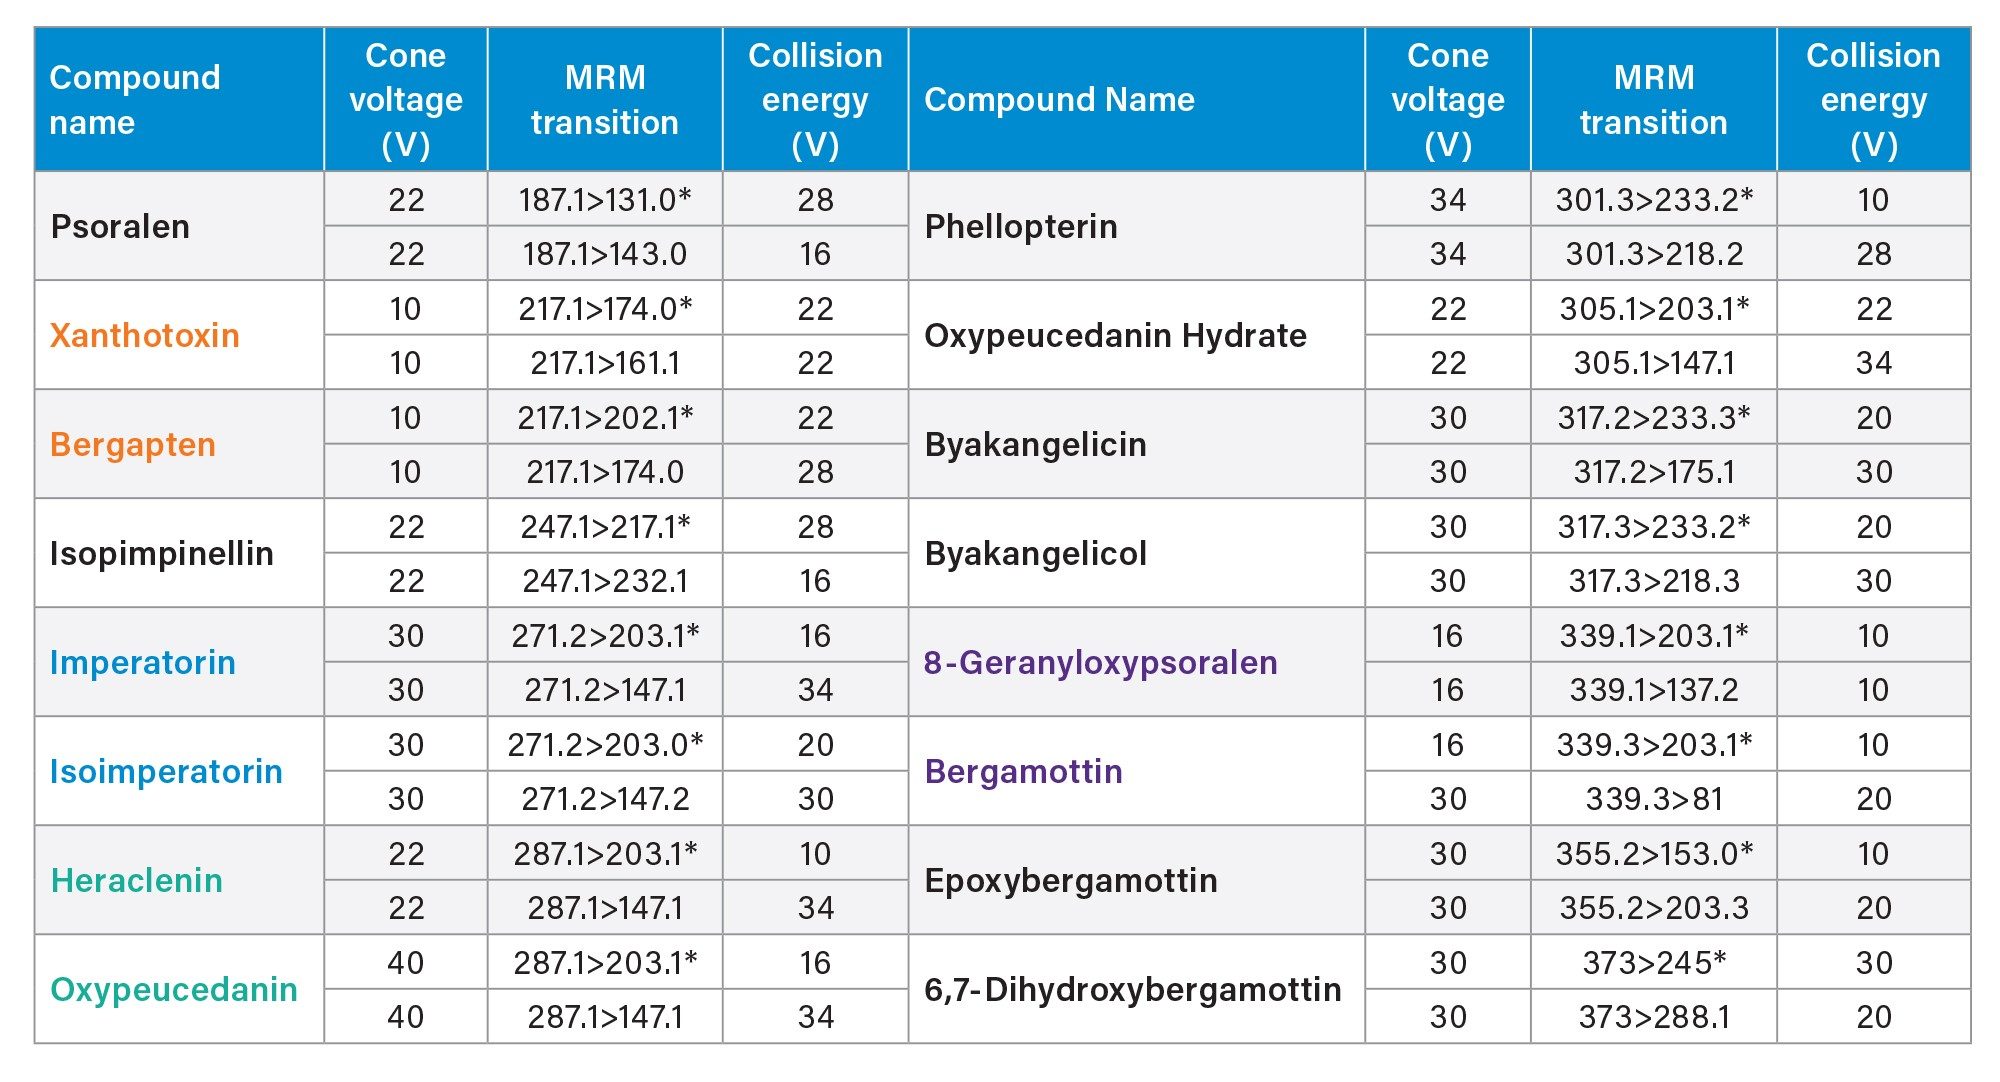 Table 1. MRM transitions of 16 furanocoumarins. Isomeric pairs are colored in orange, blue, green, and purple respectively.
Results and Discussion
Separation Capability on the ACQUITY UPLC CSH Fluoro-Phenyl Column
Sixteen furanocoumarins, including four isomeric pairs of furanocoumarins, were well separated on the ACQUITY UPLC CSH Fluoro-Phenyl Column over 15 minutes run time. Some pairs of isomers have the same MRM transition such as imperatorin and isoimperatorin and heraclenin and oxypeucedanin. Hence, it is critical for the peaks to be well separated for accurate quantitation. The retention time of the isomeric pairs were confirmed using 100 ng/mL individual furocoumarin standards. Table 2 shows the chemical structures of the four isomeric pairs and their respective chromatograms. The overall chromatogram of 1 mg/mL of furanocoumarins standard mix is shown in Figure 1.
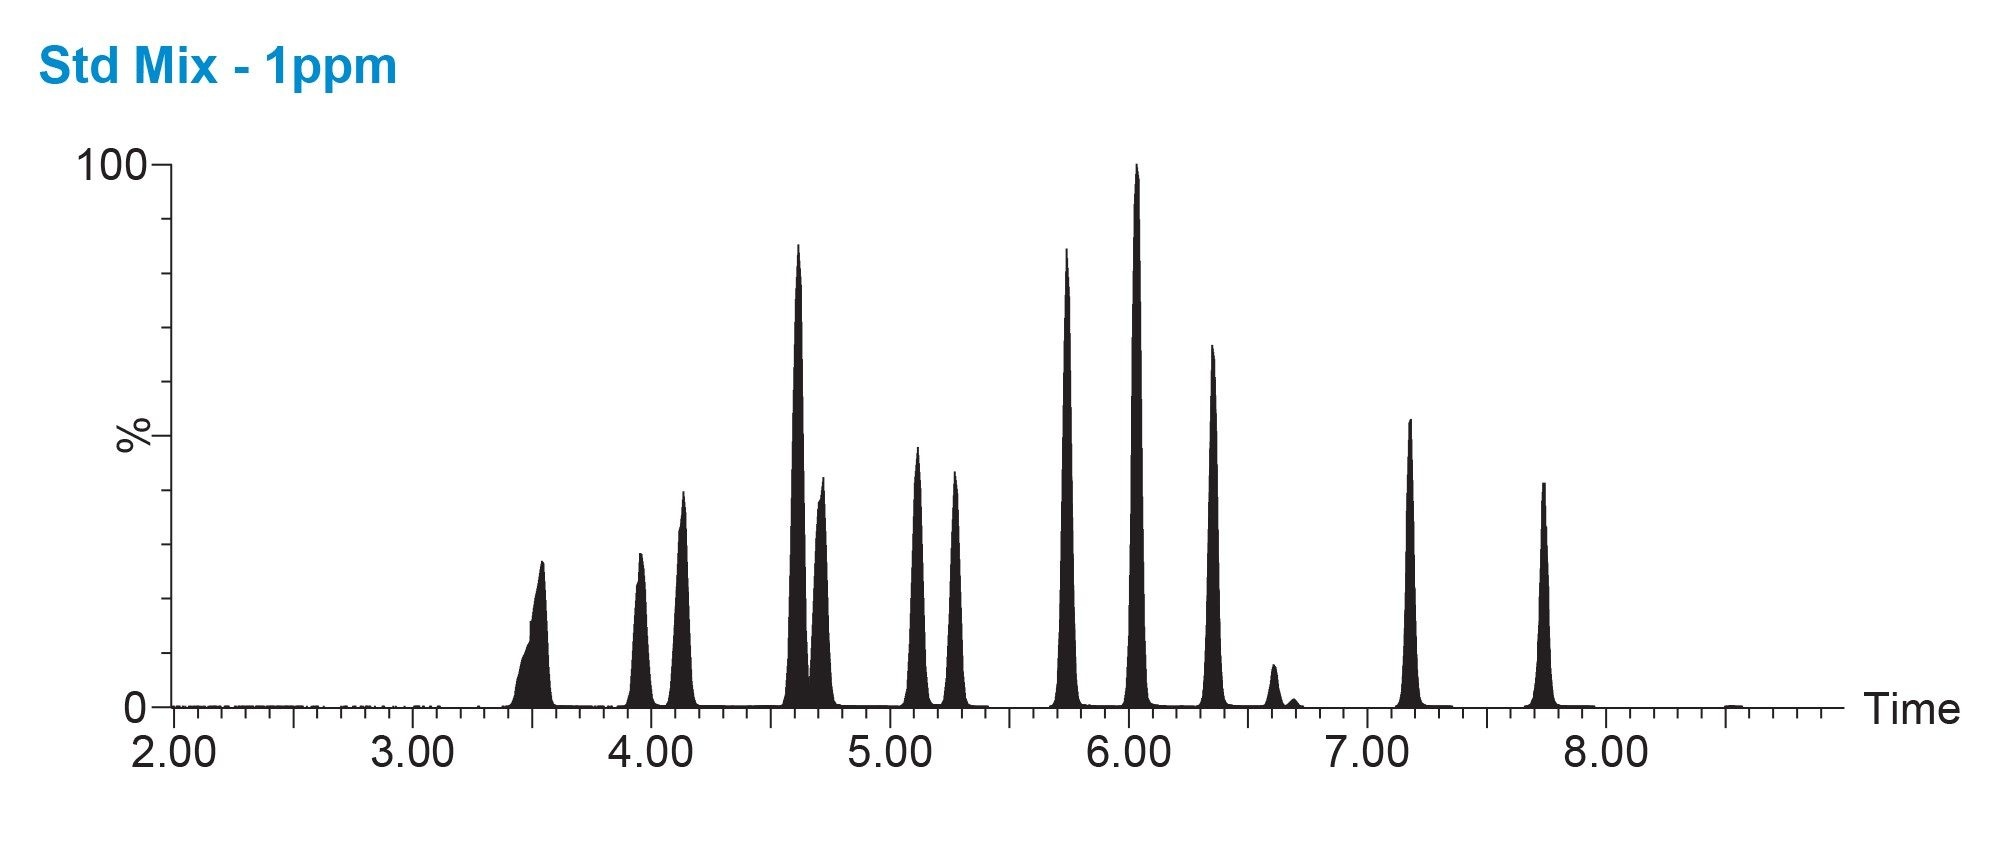 Figure 1. UPLC-MS/MS chromatogram of 16 furanocoumarins standard mix in acetonitrile (1 mg/mL)
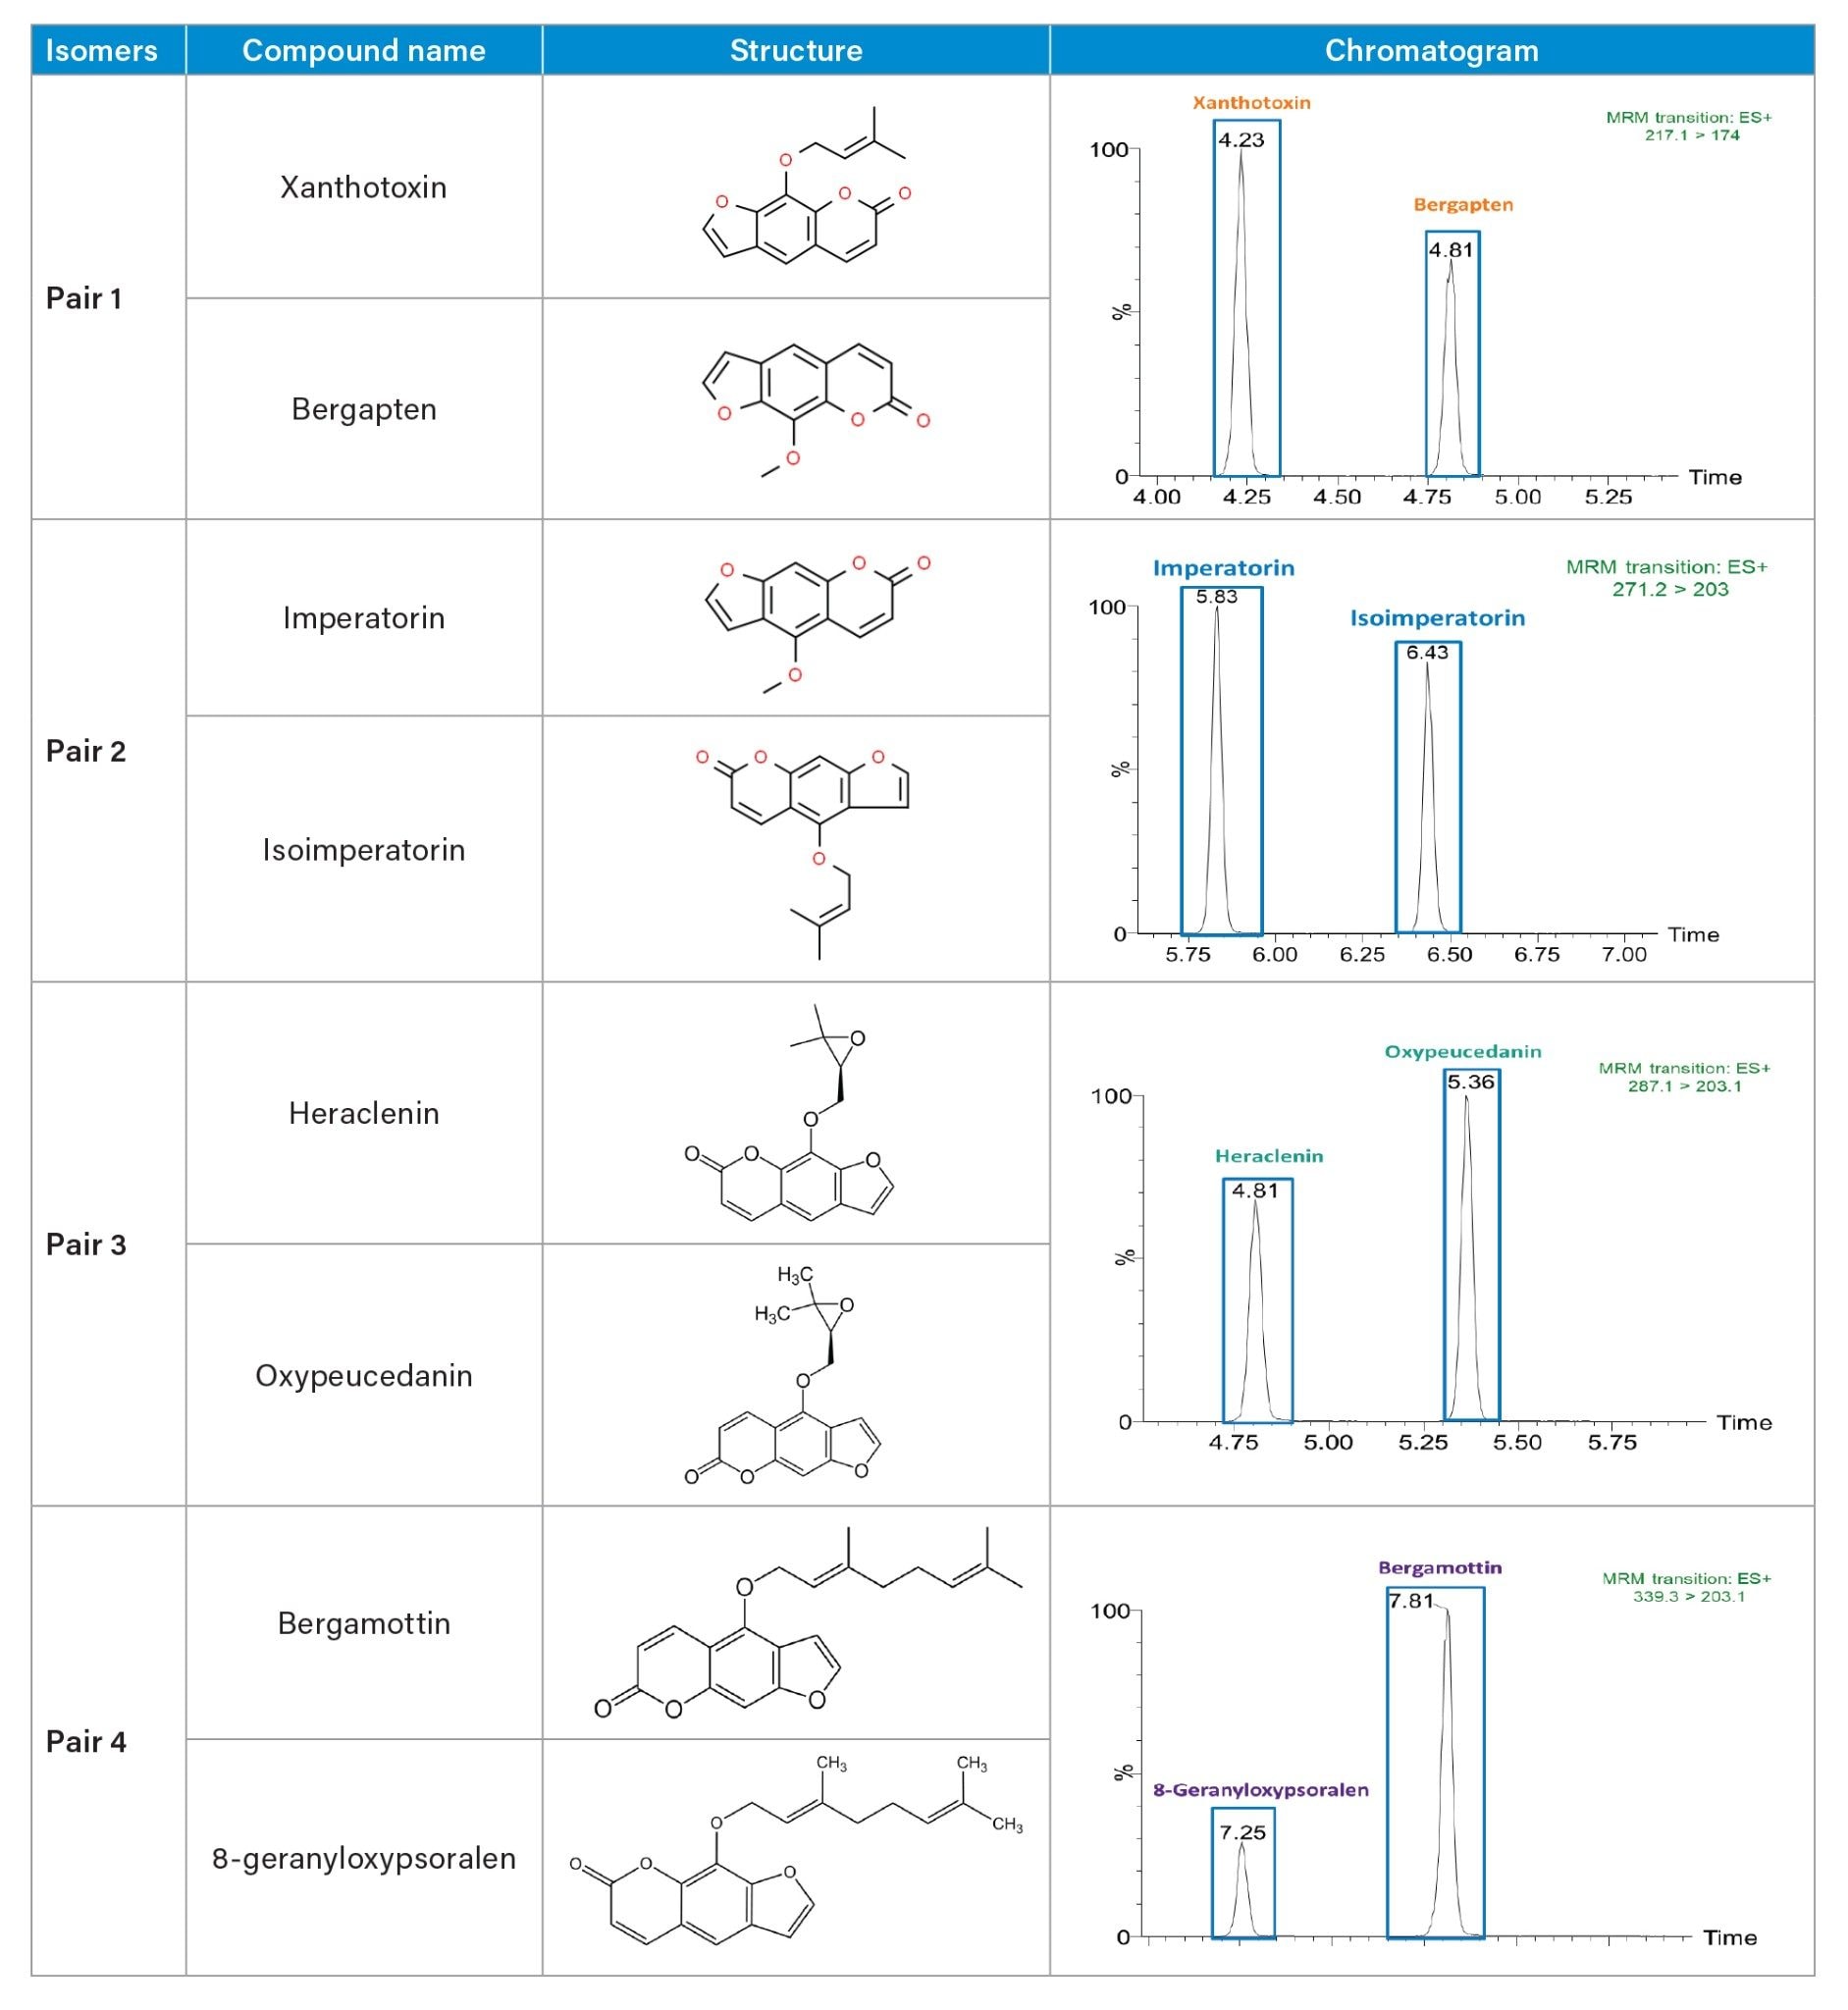 Table 2. Chemical structure and Quantification MRM chromatograms of isomeric furanocoumarins at 100 ng/mL
Instrument Linearity, Accuracy, Precision and Sensitivity
The external calibration curves described in Table 3 were obtained by averaging the calibration points of three individual curves. The linear dynamic range for all furanocoumarins ranges from 0.5–1000 ng/mL (three orders), except for 6,7-Dihydroxybergamottin with a linear range of 5–1000 ng/mL. The linear regression, R2 achieved for all analytes was greater than 0.998, with residual percent <22.6%. Some examples of furanocoumarin calibration curves and percent residuals are displayed in Figure 2. This shows excellent instrument linearity and accuracy for the quantitation of furanocoumarins on Xevo TQ-XS coupled to ACQUITY I-Class.
LOQ, being the lowest concentration of the compound that can achieve a signal-to-noise ratio greater than ten was also established in this study. The LOQ of all furanocoumarins except 6,7-dihydroxybergamottin was determined to be 0.5 ng/mL. LOQ of 6,7-dihydroxybergamottin was 10-fold higher, at 5 ng/mL. The chromatograms at the LOQ level are shown in Figure 3.
Instrument precision was performed with three repeated injections at each calibration level. The peak area %RSD at the lowest calibration level is <15%, which shows good instrument precision at the LOQ. The %RSD results are summarized in Table 3.
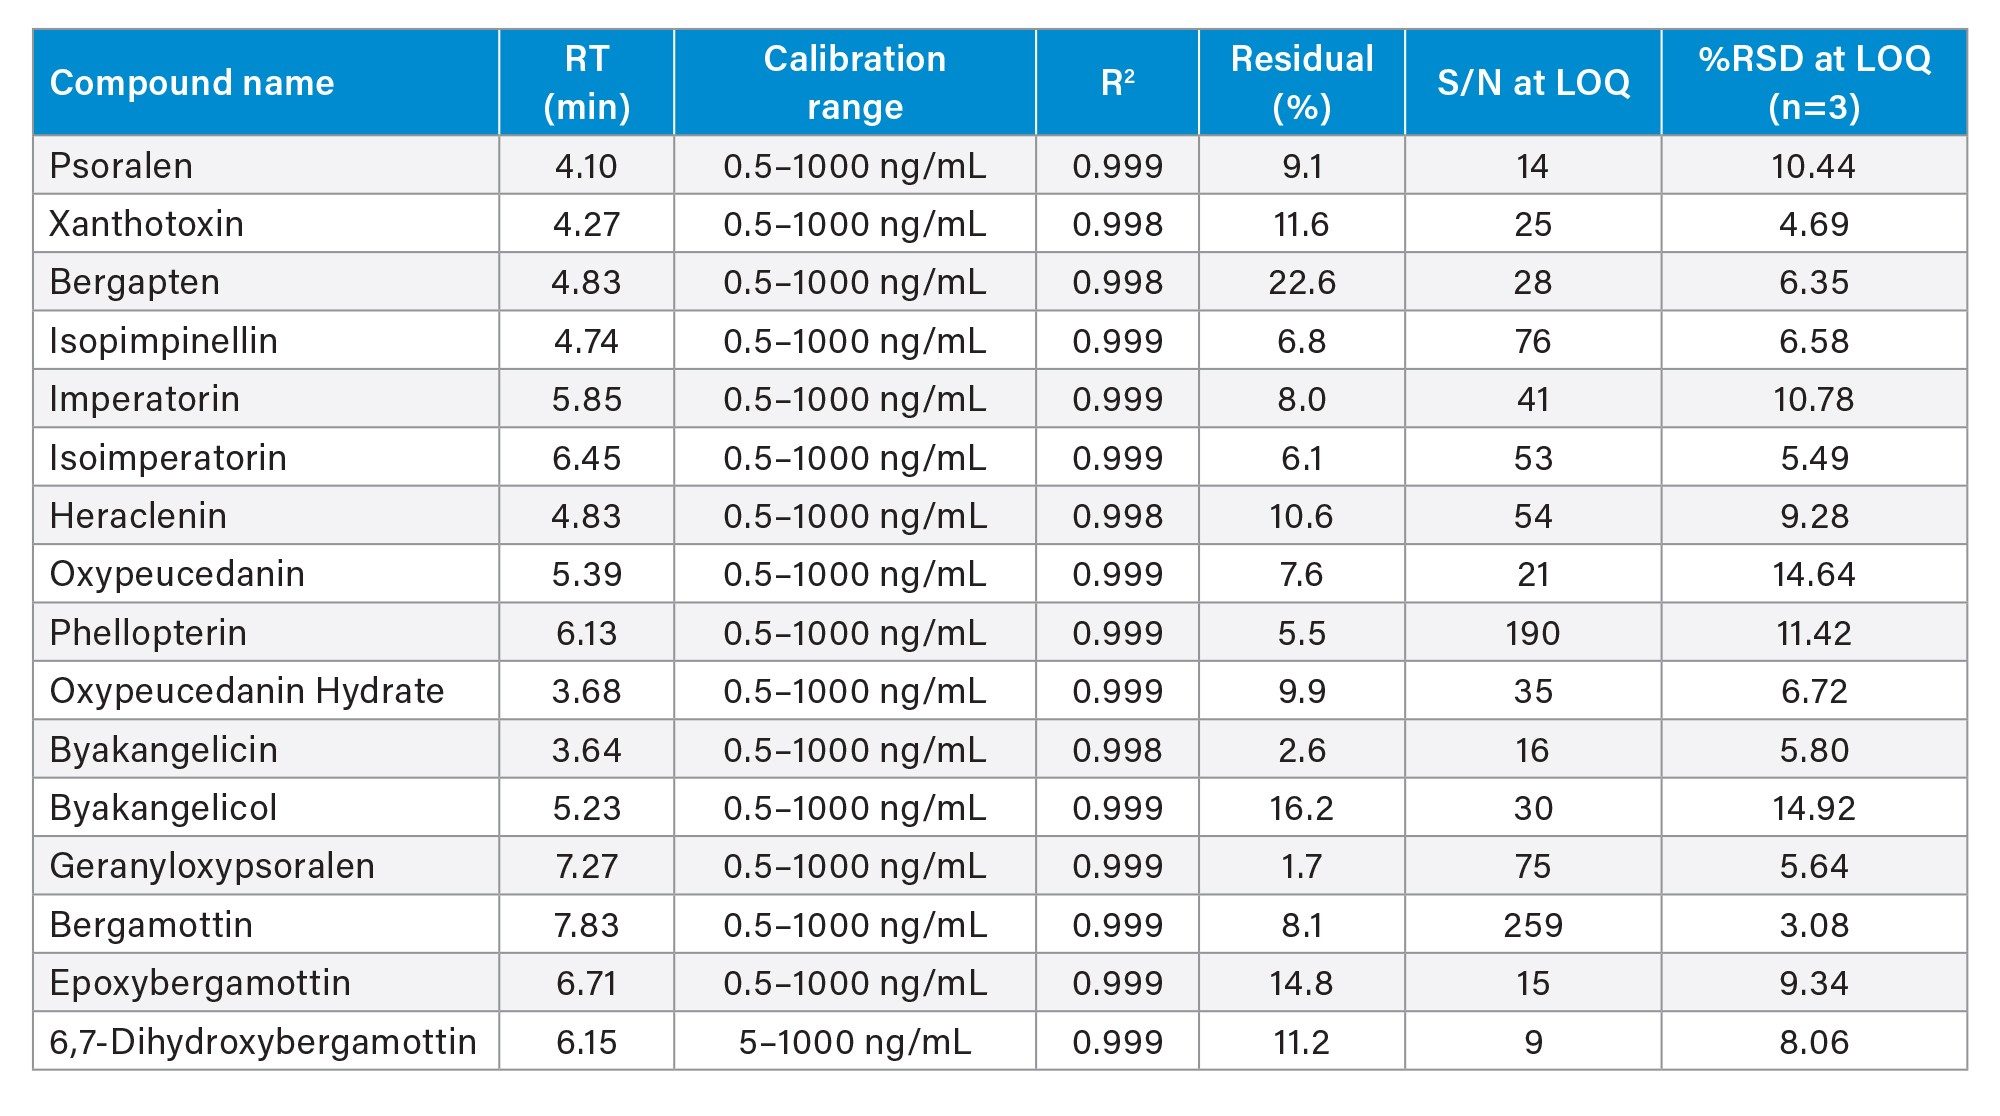 Table 3. Details on instrument linearity, precision, and sensitivity for furanocoumarins.
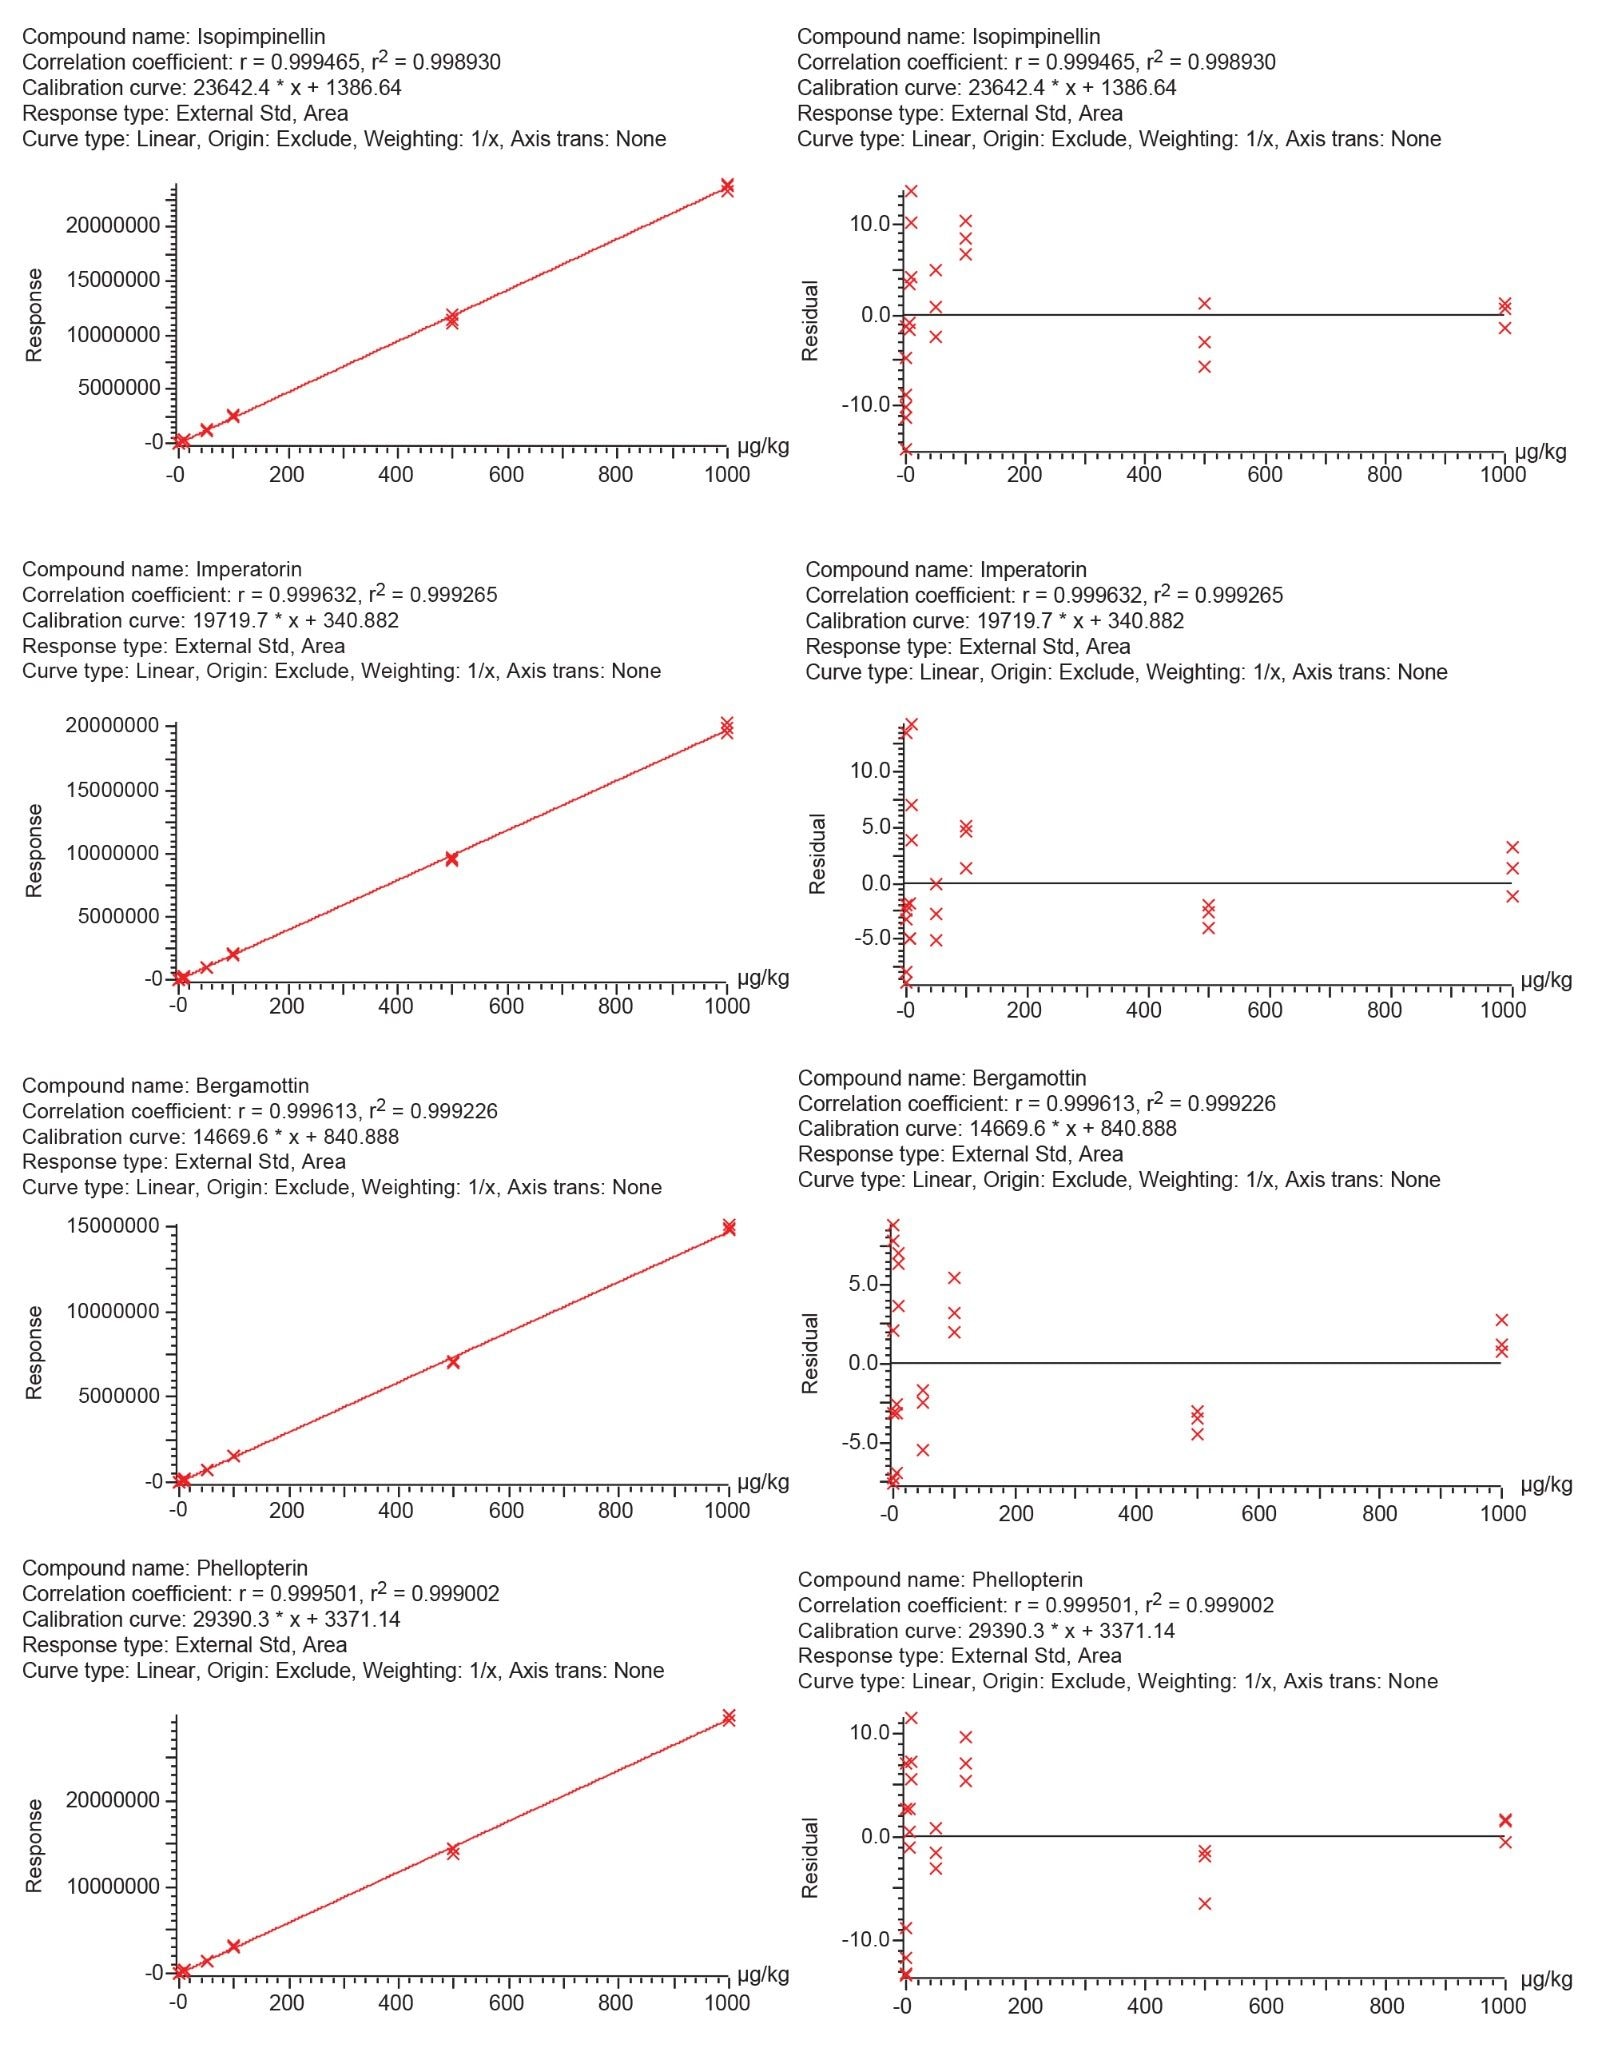 Figure 2. Example calibration curves of furocoumarins in acetonitrile acquired on Xevo TQ-XS coupled with ACQUITY I-Class.
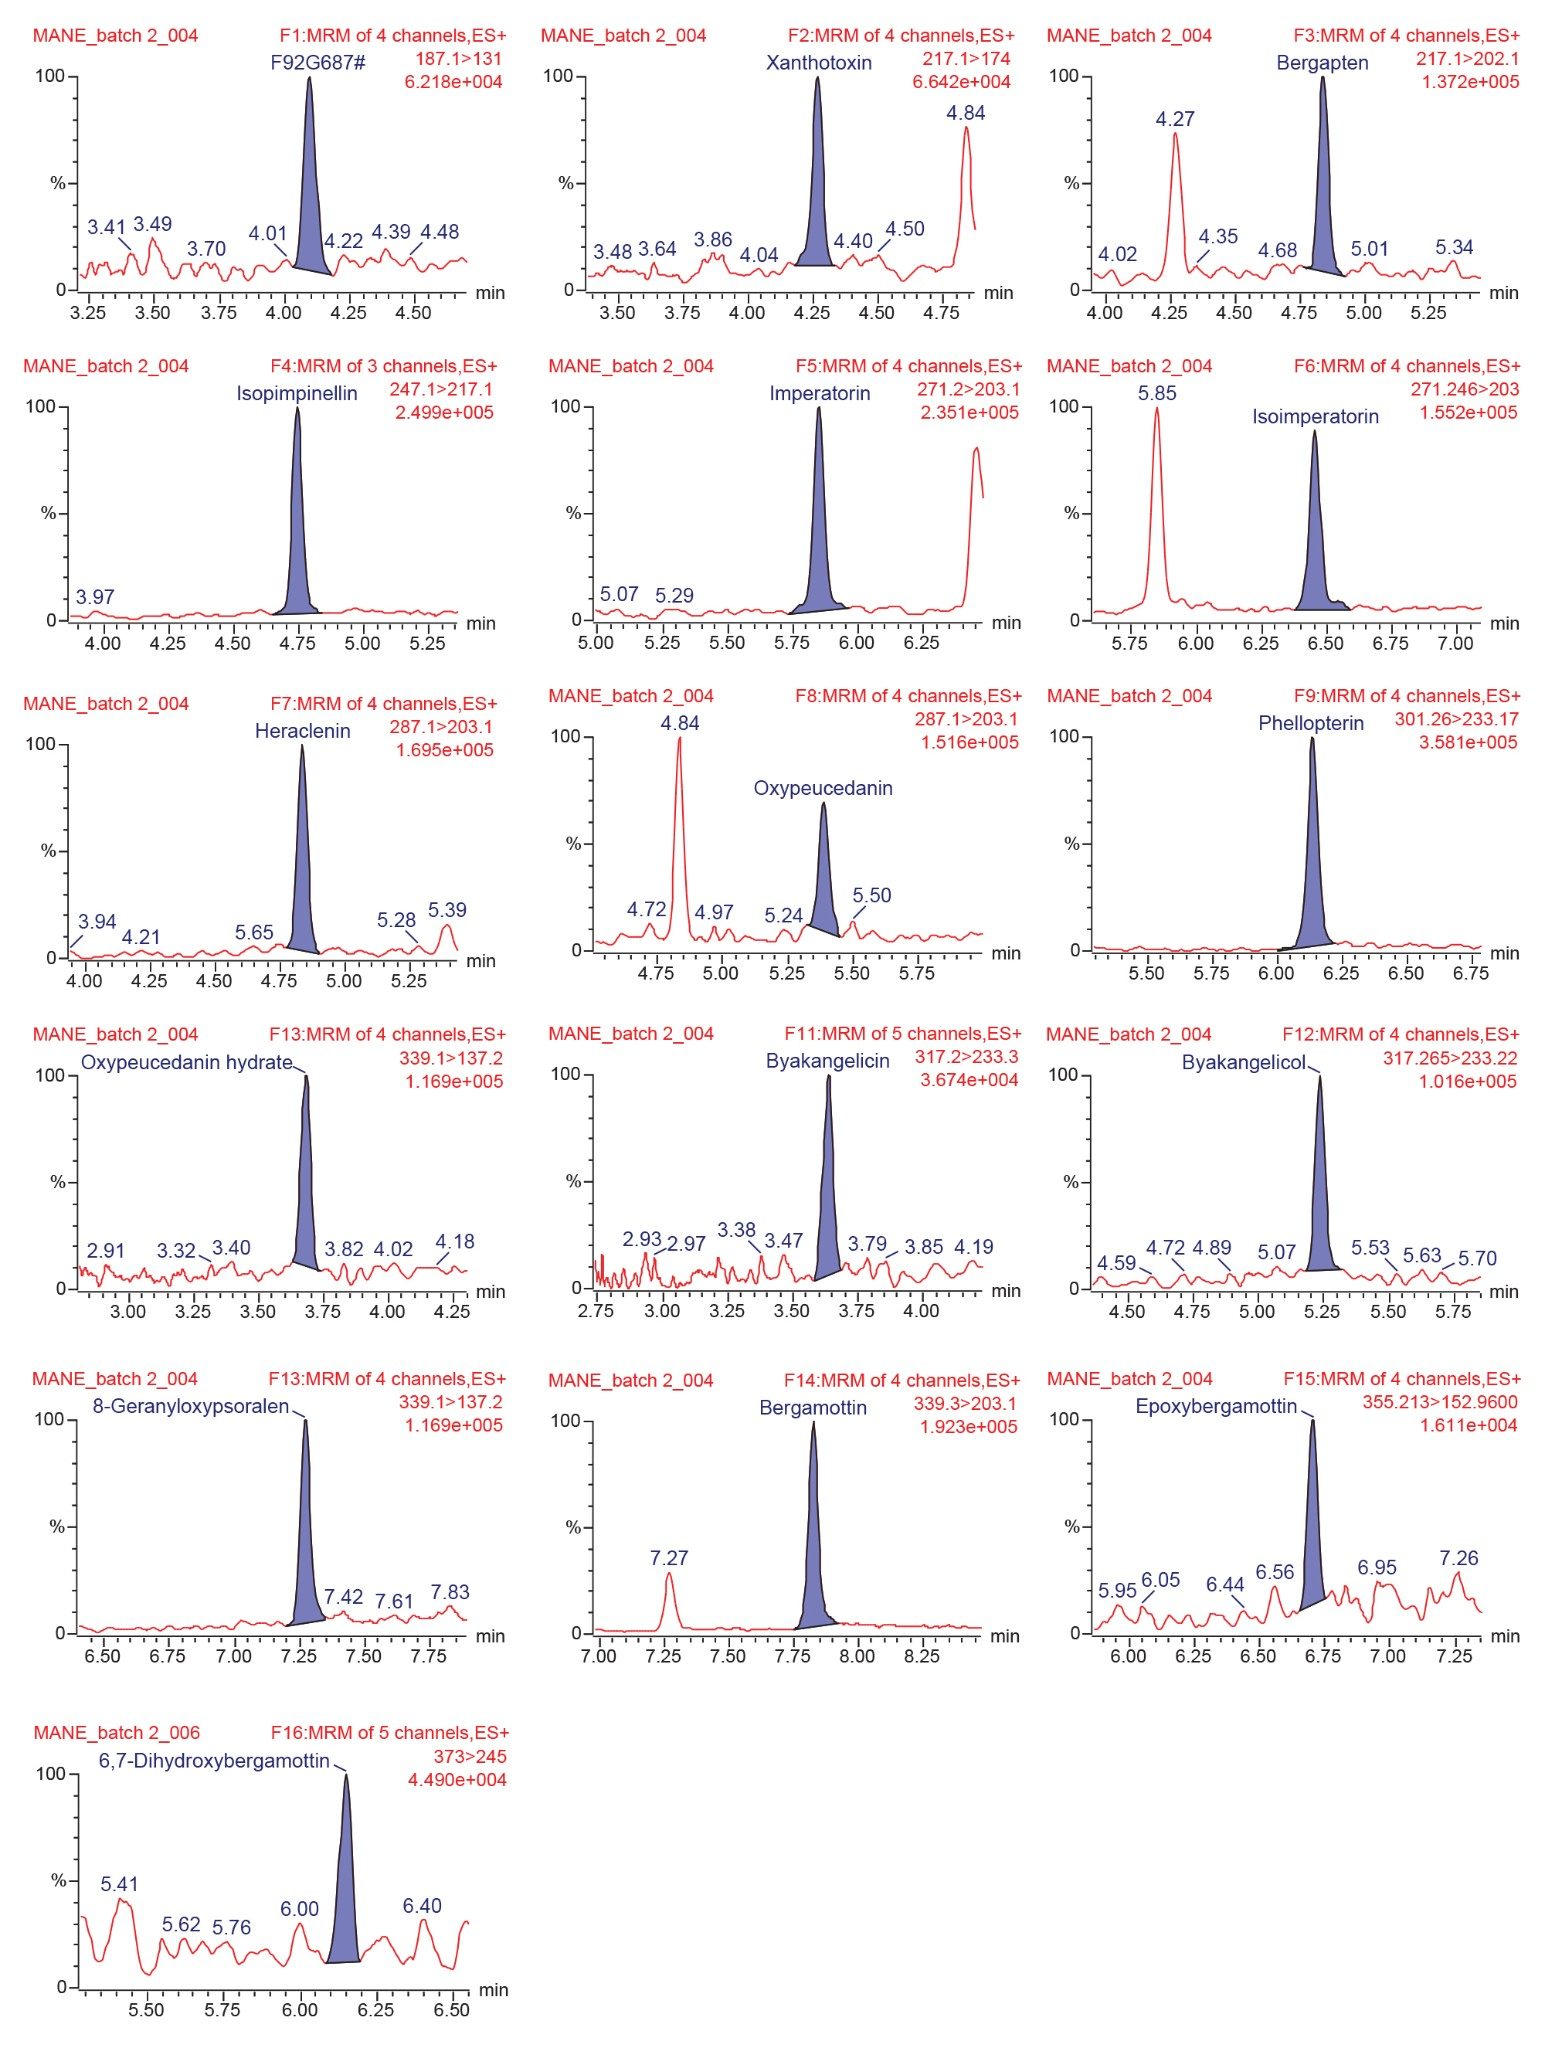 Figure 3. Chromatograms and S/N of furanocoumarins in acetonitrile at LOQ concentration.
Evaluation of Orange Essential Oil Matrix Effect on Furocoumarins
The matrix effect of orange essential oil on furanocoumarins was evaluated to establish whether solvent or matrix-matched calibration curves should be used to quantify furanocoumarins in real samples. Matrix effects were calculated based on the peak area of furanocoumarins spiked in blank orange essential oil matrix against solvent. Furanocoumarins were spiked at 10 ng/mL, 100 ng/mL, and 1000 ng/mL to represent low, mid and high levels of furocoumarins in real essential oil samples. Figure 4 shows an example of psoralen and 6,7-dihydroxybergamottin at 10 ng/mL in solvent and orange essential oil matrix. Table 4 summarized the matrix effect of furanocoumarins in orange essential oil sample matrix.
In general, slight matrix enhancement was observed across most furanocoumarins, with the matrix effect more obvious at low furanocoumarin level. As matrix enhancement was <130% for most analytes, there is insignificant matrix effect across the three different levels of furanocoumarins, and the use of solvent calibration curve should accurately quantify furanocoumarins in real essential oil samples.
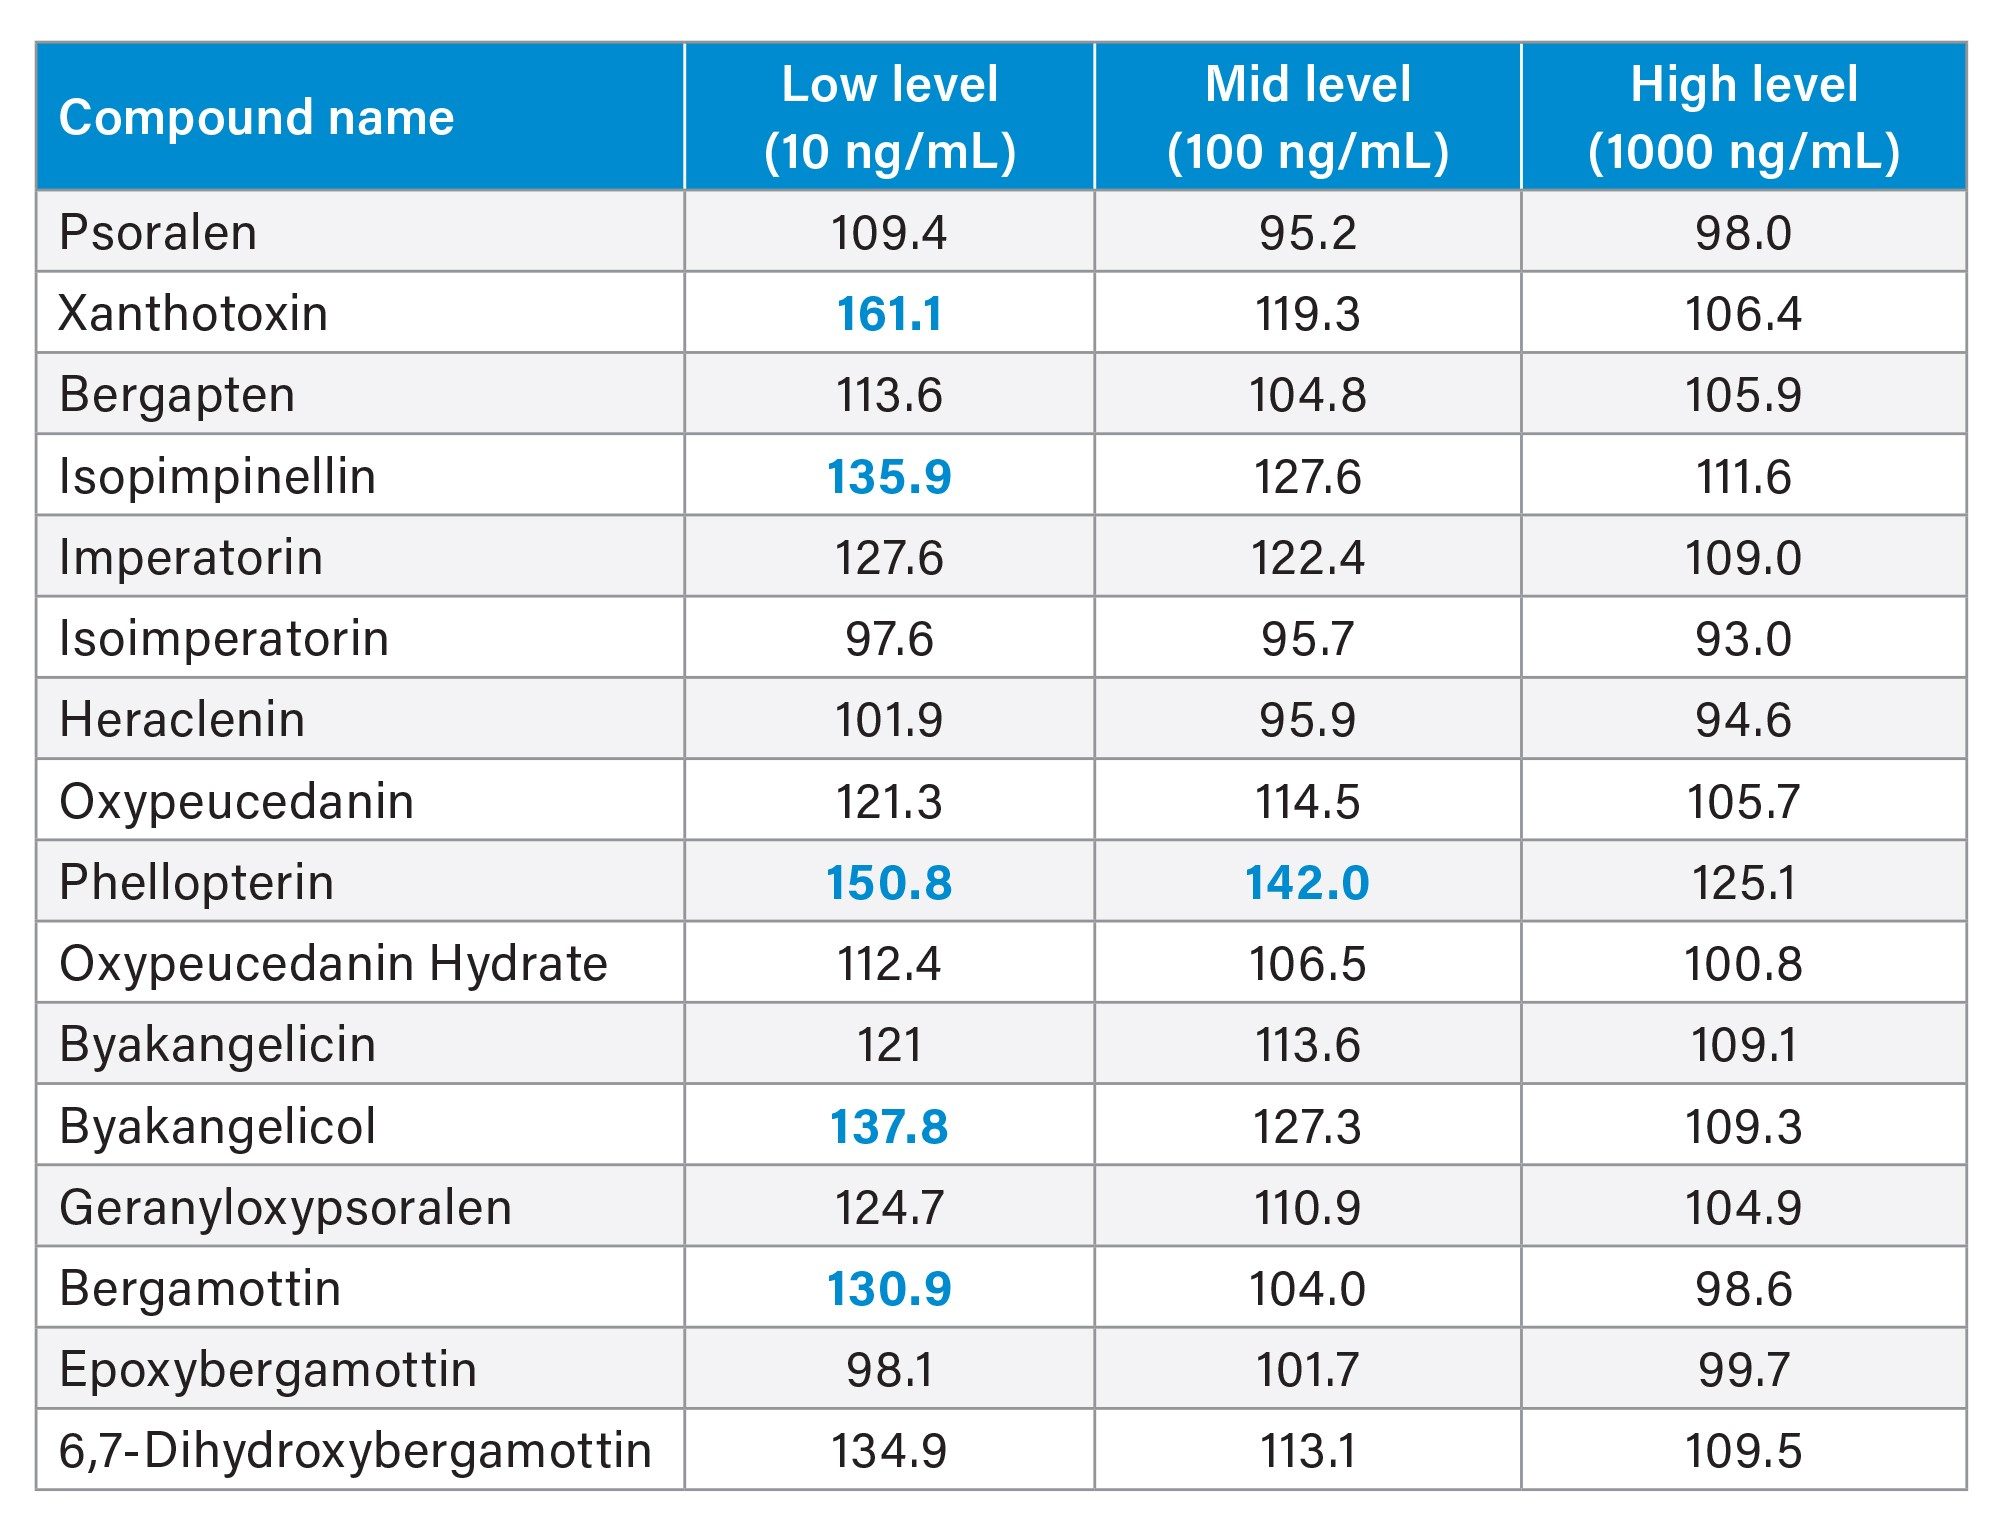 Table 4. Matrix effect studies at low, mid, and high furanocoumarins levels spiked in orange essential oil matrix (n = 3). Matrix effect >130% are highlighted in blue.
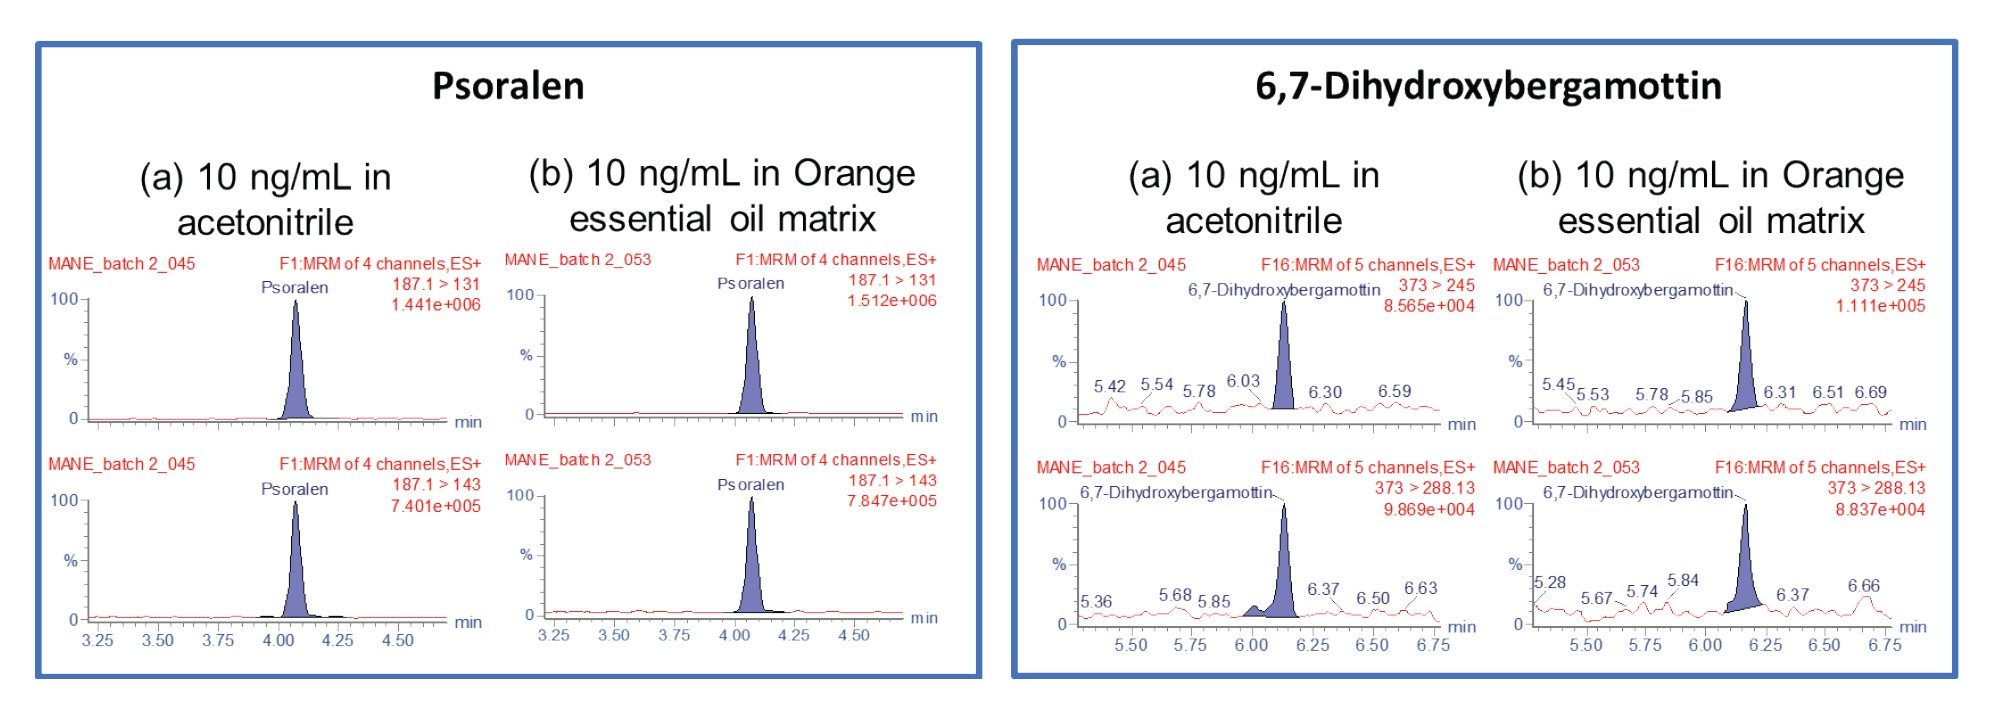 Figure 4. MRM Chromatograms of Psoralen and 6,7-Dihydoxybergamottin at 10 ng/mL in (a) acetonitrile and (b) orange essential oil matrix.
Quantitation of Furanocoumarins in Essential Oil Sample
Furanocoumarins in grapefruit essential oil were present in vastly different concentrations, ranging from 0.09 to 196 mg/mL (Figure 5 and Table 5). Wide linear dynamic range (up to three orders of magnitude) on the Xevo TQ-XS allows for analyst to accurately quantify different magnitude of analytes present in the samples, thus simplifying sample preparation and reducing time and cost of analysis.
Matrix matched calibration and solvent calibration were both established for this study. The grapefruit essential oil sample was diluted by 100-fold with acetonitrile, and the actual concentration of furanocoumarins were quantified against both solvent and matrix-matched calibration curves respectively (Table 5). The percent difference in actual concentration as quantified by solvent and matrix-matched calibration curves was <30%. The results coincided with the matrix effect study, suggesting minimal matrix effect and that solvent standards calibration could be used to quantify furanocoumarins in essential oil sample
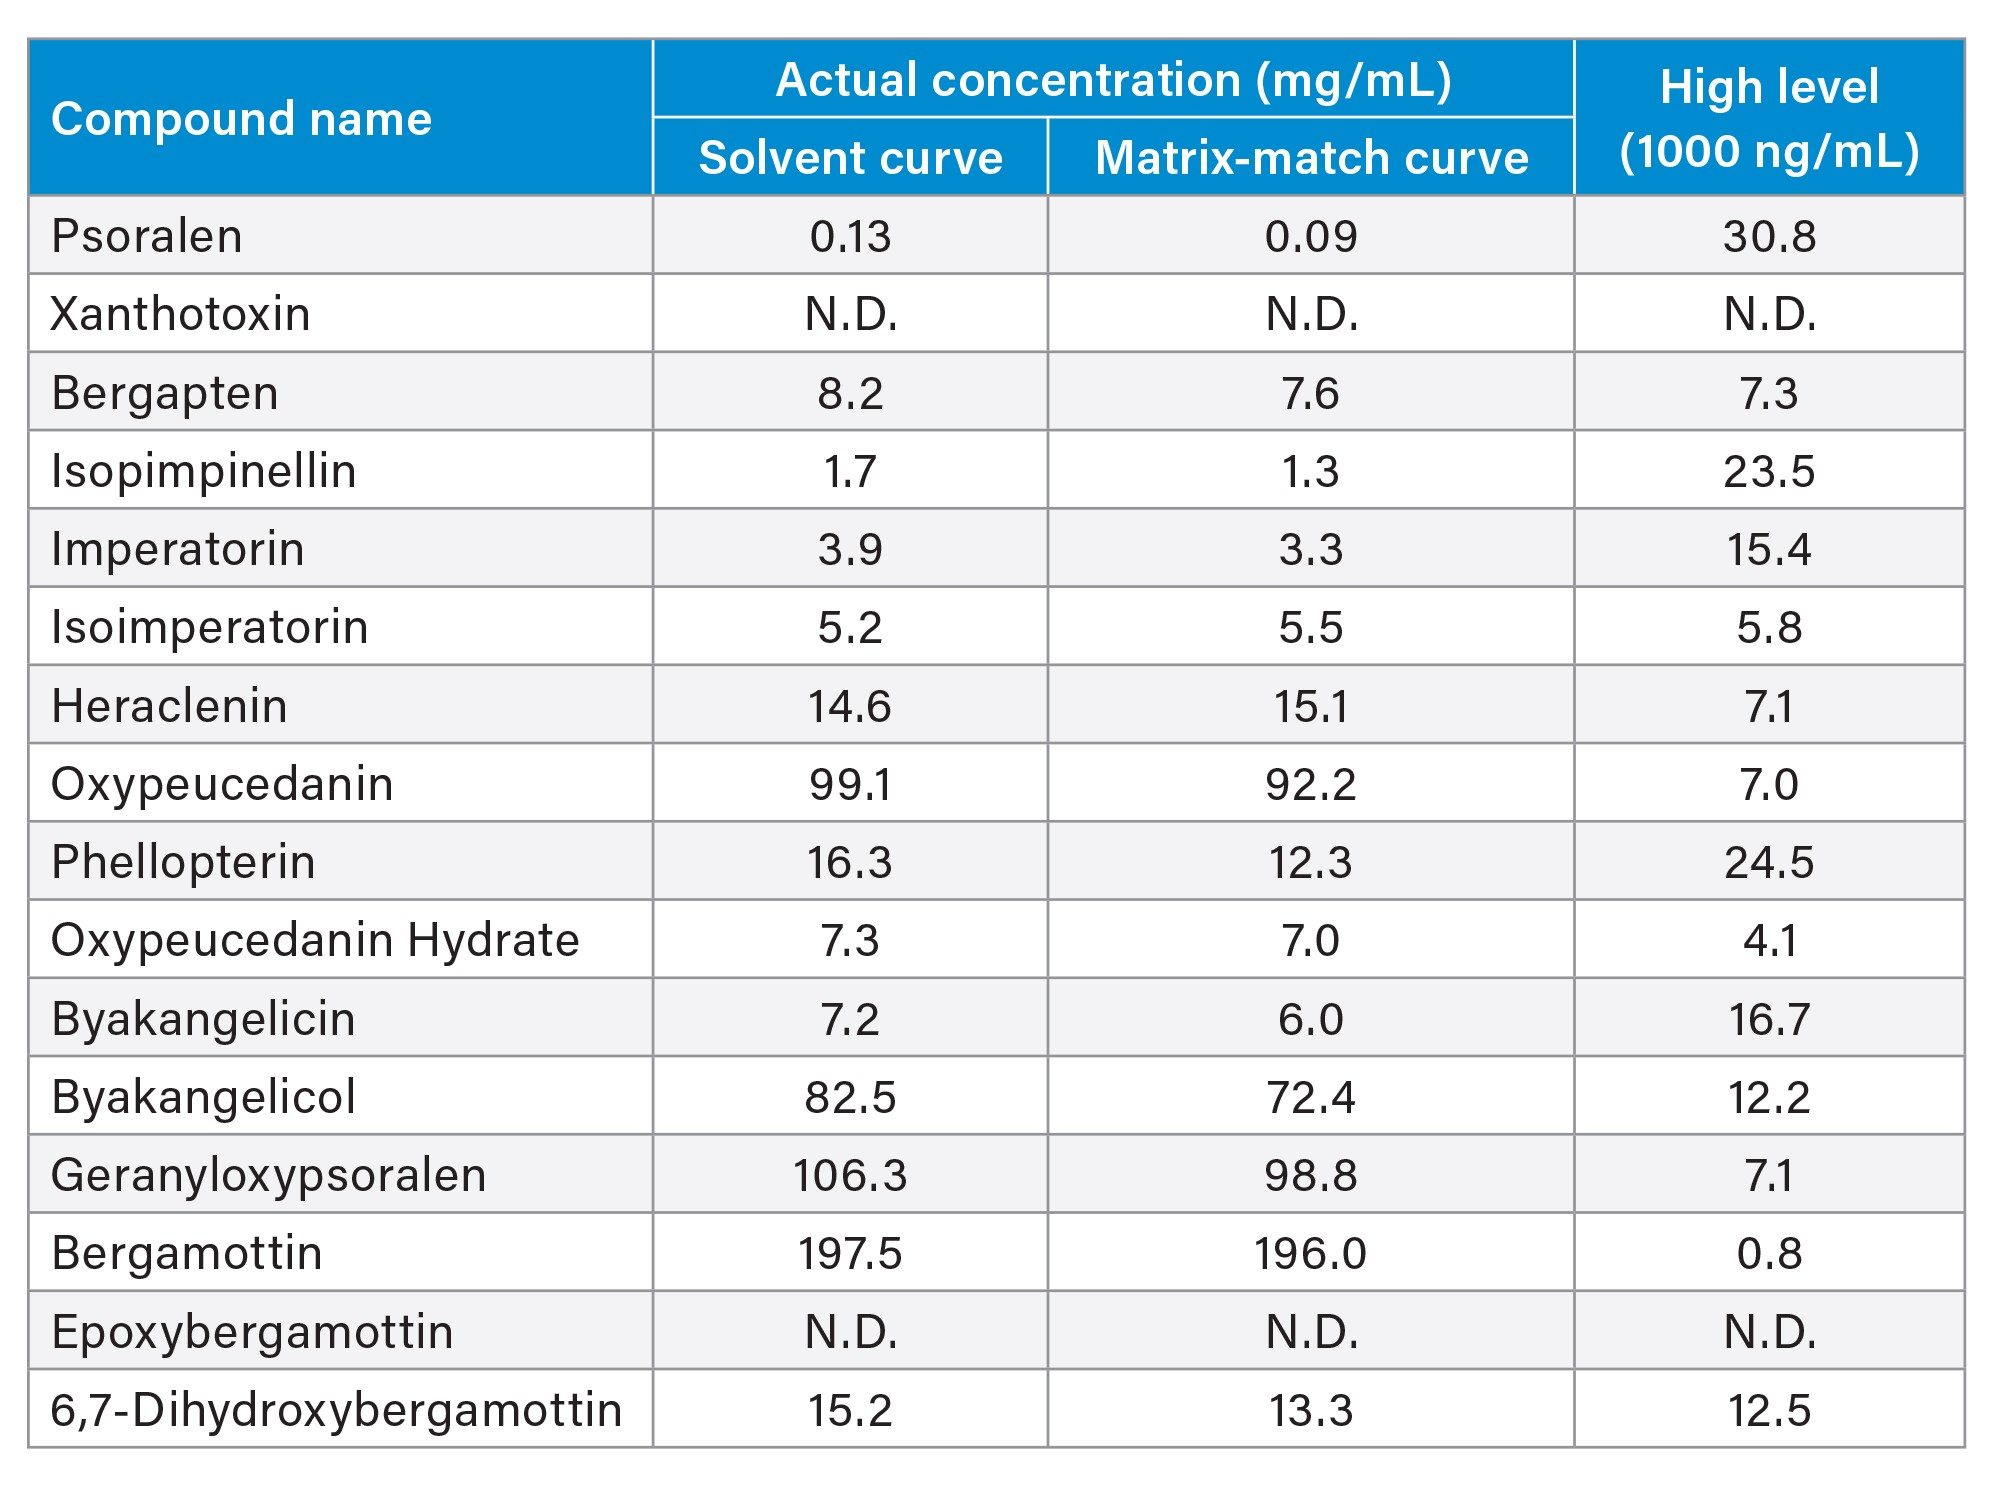 Table 5. Concentration of furanocoumarins in grapefruit essential oil sample.
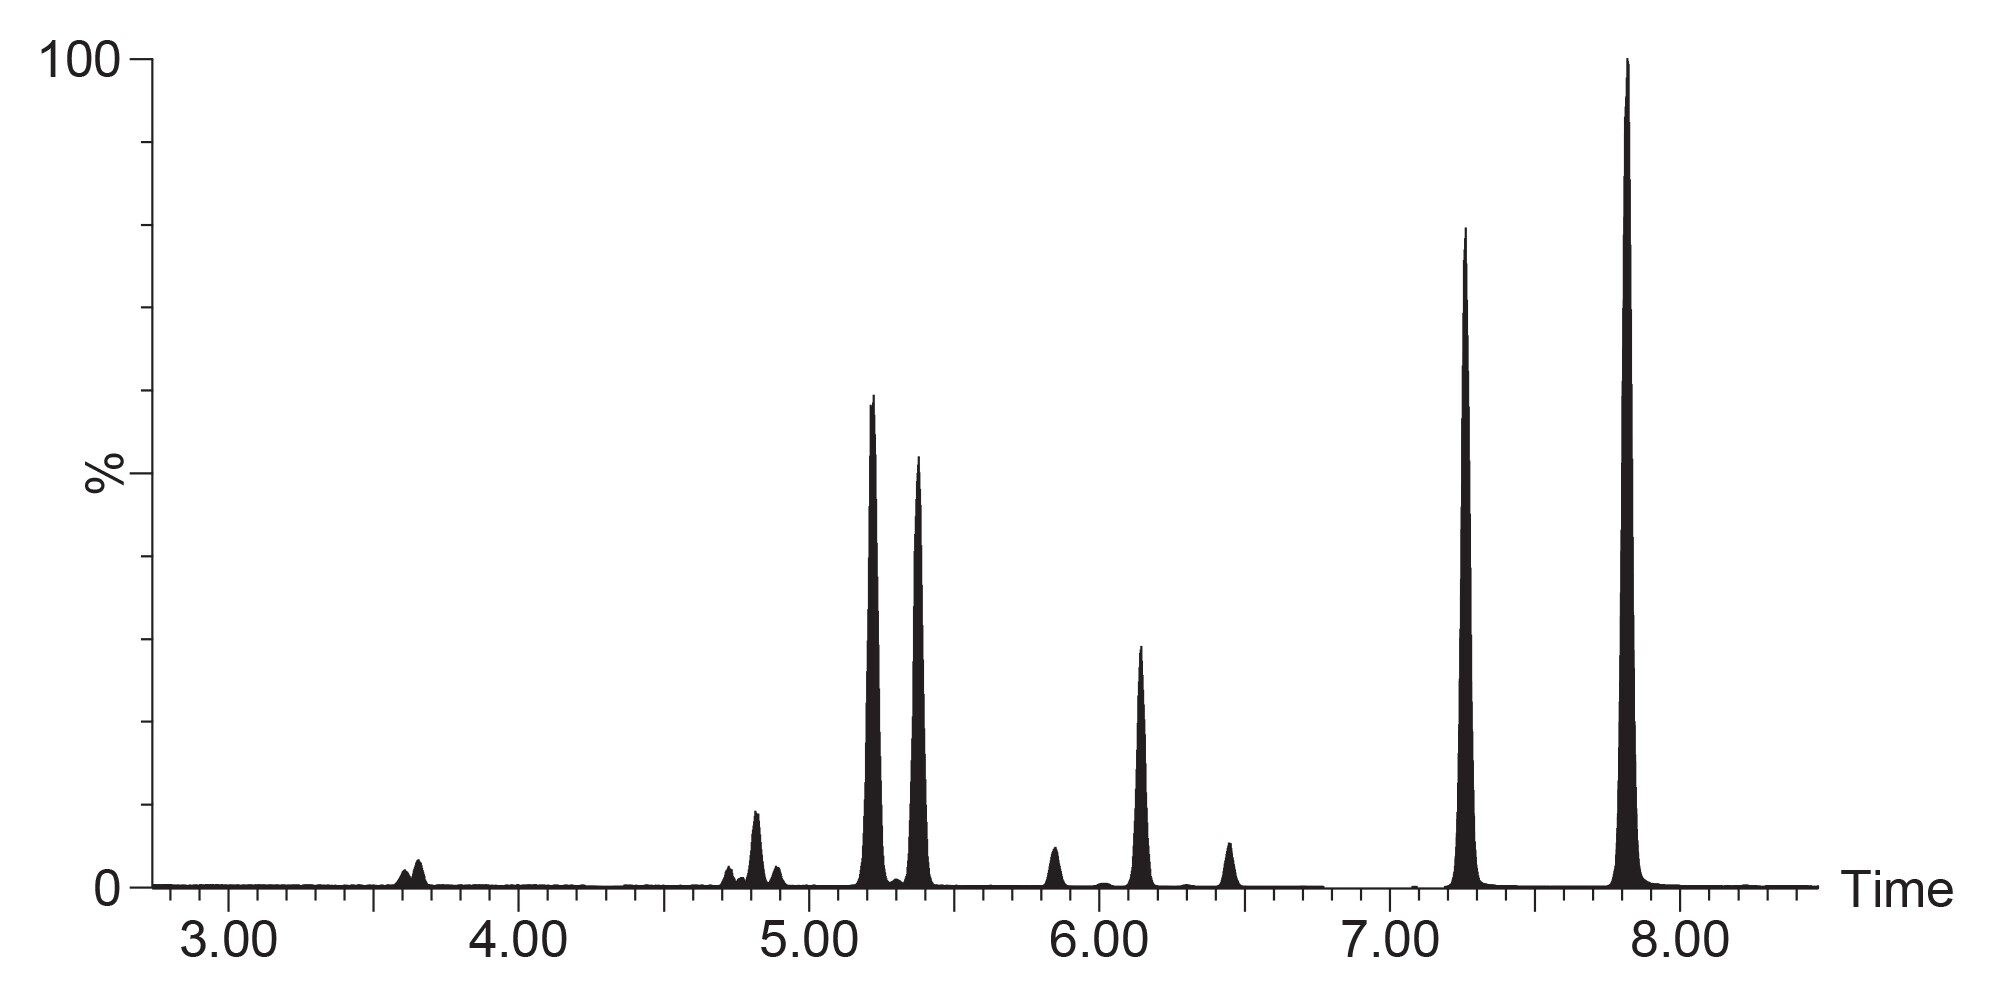 Figure 5. Chromatogram of furanocoumarins detected in 100-fold diluted grapefruit essential oil sample.
Conclusion
It is critical to have accurate determination of furanocoumarins in consumer goods due to the phototoxicity nature. Time-segmented MRM method to rapidly screen and quantify 16 furanocoumarins was successfully developed on ACQUITY I-Class coupled with Xevo TQ-XS System. Four isomeric furanocoumarins pairs were well resolved using the ACQUITY UPLC CSH Fluoro-Phenyl Column, allowing accurate quantitation for each isomer. Excellent instrument accuracy, precision, and linear dynamic range for furanocoumarins was established in this study. The instrument has also proven the capability to achieve LOQ of 0.5 ng/mL for all furanocoumarins except for 6,7-Dihydroxybergamottin at 5 ng/mL.
The matrix effect of orange essential oil on furanocoumarins were investigated as well using simple dilution. Slight matrix enhancement was observed across various spiked concentrations of furanocoumarins (<130%). This suggested that matrix effect is insignificant and was confirmed with the quantitation of essential oil sample using solvent and matrix-matched calibration curve. The amount of furocoumarins present in grapefruit essential oil ranges between 0.09–196 mg/mL, and the difference between actual concentration as determined with solvent and matrix-matched calibration curve was <30%.
With the method established, we can quantitate essential oil samples using a quick and simple sample preparation technique while meeting the regulation limit of 1 mg/kg as proposed by European Union, Regulation (EC) No 1223/2009.
References
- Dugrand-Judek, A., Olry, A., Hehn, A., Costantino, G., Ollitrault, P., Froelicher, Y., & Bourgaud, F. (2015). The Distribution of Coumarins and Furanocoumarins in Citrus Species Closely Matches Citrus Phylogeny and Reflects the Organization of Biosynthetic Pathways. PLOS ONE, 10(11). https://doi.org/10.1371/journal.pone.0142757.
- Kreidl, M. et. al., Determination of Phytotoxic Furanocoumarins in Natural Cosmetics Using SPE With LC-MS. Analytical Chimica Acta, 2020, 1101, 211–221.
- Christensen L.P., Watson, R.R., Preedy, V.R., Zibadi, S. (Eds).Polyphenols and Polyphenol-Derived Compounds and Contact Dermatitis, Polyphenols in Human Health and Disease. Academic Press, San Diego, 2014, pp 793–818.
- Official Journal of the European Union, Regulation (EC) No 1223/2009 on Cosemetic Products, 30 Nov 2009.
- Li, G.-J., Wu, H.-J., Wang, Y., Hung, W.-L., & Rouseff, R. L. (2019). Determination of Citrus Juice Coumarins, Furanocoumarins and Methoxylated Flavones Using Solid Phase Extraction and HPLC With Photodiode Array and Fluorescence Detection. Food Chemistry, 271, 29–38. https://doi.org/10.1016/j.foodchem.2018.07.130.
- International Fragrance Association, Brussels, Information Letter 799 Furocoumarins in Finished Cosmetic Products, 2008.
720007739, October 2022