• Application Note

Improving UPLC-FLR-MS N-glycan Analysis of Disulfide-rich Fusion Proteins Through Optimization of Sample Preparation 

Improving UPLC-FLR-MS N-glycan Analysis of Disulfide-rich Fusion Proteins Through Optimization of Sample Preparation 

  • Ximo Zhang
  • Mauro Sassi
  • Erika Birolo
  • Nunzio Sepe
  • Paolo Felici
  • Angelo Palmese
  • Robert E. Birdsall
  • Ying Qing Yu
  • Waters Corporation
  • Merck

Abstract

Fusion proteins represent an emerging modality of biotherapeutics that offers advantages such as extended plasma half-life and prolonged therapeutic activity. Glycosylation of fusion proteins can impact safety, efficacy, and PK of the drug product and need to be well characterized and monitored throughout the development process to ensure product quality. Compared to monoclonal antibodies (mAbs), fusion proteins typically have higher complexity in molecular structures and glycan profiles. Further, conventional methods that are commonly developed for glycan analysis of mAbs might not be suitable for fusion proteins. Here we report the development of an optimized sample preparation method for UPLC-FLR-MS based N-glycan analysis of fusion proteins containing a high level of disulfide bonds and complex glycans profile.

Benefits

  • Rapid sample preparation, enabling complete release of N-glycans for accurate glycan profiling of disulfide-rich fusion proteins
  • Straightforward method transfers from legacy glycan labeling platforms (such as 2-AB) to a modern RFMS based rapid labeling workflow that yields significantly improved optical and MS based assay performance

Introduction

Fusion proteins represent an emerging modality of biotherapeutics that offer multiple advantages over monoclonal antibodies (mAbs) such as extended plasma half-life and prolonged therapeutic activity.1 Structurally, a major class of fusion proteins are generally comprised of an IgG Fc region and a target binding region derived from a receptor or ligand.2 Compared to the closely related mAbs, Fc fusion proteins typically have more complex glycoprofiles due to additional glycosylation sites and more complex glycan structures located on the target binding region. Accurate characterization and monitoring of the glycoprofile is critical for product quality and consistency as N-glycosylation levels can impact the safety, efficacy, and pharmacokinetics of the fusion protein therapeutic.2 Released glycan analysis via derivatization and LC-fluorescence (FLR)-MS has been an effective method to obtain detailed information of N-glycosylation on protein biotherapeutics. However, the extensive disulfide bonds that are commonly seen on fusion proteins can hinder the accessibility of Peptide-N-Glycosidase F (PNGase F) to the embedded glycosylation sites and result in incomplete release of the glycans. These disulfide-rich structures, in addition to the complex glycan profiles, present challenges in the adaptation of mAb-based released glycan analysis workflows. Therefore, an efficient workflow for released glycan analysis is highly desired to improve the characterization and monitoring of N-glycosylation on disulfide-rich fusion proteins.

Here, we report a new sample preparation method to improve the UPLC-FLR-MS-based N-glycan analysis of fusion proteins exhibiting a high level of disulfide bonds and complex glycoprofiles using a modified protocol for the Waters GlycoWorks RapiFluor-MS N-glycan Kit. The Waters GlycoWorks RapiFluor-MS N-glycan Kit was chosen as a rapid release and labeling kit that could be readily adapted to disulfide-rich Fusion proteins with minimal protocol changes while maintaining significant signal enhancements for FLR and MS detection of N-released glycans.3 As part of the modified protocol, a reducing agent was added in the denaturing step to reduce the disulfide bonds and increase the accessibility of the PNGase F enzyme to N-linked glycans (Figure 1). In combination with the streamlined LC-FLR-MS released glycan workflow afforded by the BioAccord System,4 this improved sample preparation method can enhance the accuracy and efficiency of N-glycan analyses throughout the development and manufacturing process of disulfide-rich fusion proteins.

Figure 1. The optimized sample preparation workflow for the released N-glycan analysis of disulfide-rich fusion proteins. To enable the complete glycan releasing, a reducing agent was added to the rapid denaturation step for the disulfide bond reduction. 

Experimental

Sample Description

  • N-glycans were released from 15 μg of a fusion protein that contains 28 pairs of -S-S- bonds and then labeled using the GlycoWorks RapiFluor-MS N-Glycan Kit (p/n 176004082) with the updated denaturation and labeling step. Dithiothreitol (DTT) or tris(2-carboxyethyl) phosphine (TCEP) was purchased from Thermo Scientific (Waltham, MA) and used as the reducing agent during denaturation to reduce the disulfide bonds.5 The experimental information of the optimized protocol is listed in Table 1.*

* The no-weight format of DTT and TCEP were used for higher reproducibility and ease-of-use. TCEP was neutralized with NaOH prior to use.

* Additional details in sample preparation are summarized in the GlycoWorks Quick Start protocol for disulfide-rich proteins (720006992EN).

Table 1. The reagents used in the optimized sample preparation protocol for the released N-glycan analysis of disulfide-rich fusion proteins. The concentration of each reagent listed in the table is the final concentration in the reaction mixture. 

LC Conditions

LC system:

ACQUITY UPLC I-Class PLUS

Detection:

ACQUITY FLR Detector (λexcitation=265 nm, λemission=425 nm, 2Hz)

Vials:

QuanRecovery with MaxPeak HPS 300 µL Vials (p/n 186009186)

Column(s):

ACQUITY Glycan BEH Amide Column, 1.7 µm, 130 Å, 2.1 × 150 mm

Column temp.:

60 °C

Sample temp.:

6 °C

Injection amount:

10 µL (2.5 pmol)

Seal wash:

20% acetonitrile in water

Mobile phase A:

H2O with 100 mM NH4HCO2

Mobile phase B:

Acetonitrile

Gradient Table

MS Conditions

MS system:

ACQUITY RDa Mass Detector

Ionization mode:

ESI Positive

Acquisition range:

50–2,000 m/z

Capillary voltage:

1.5 kV

Cone voltage (CV):

45 V

Fragmentation CV:

70–90 V

Data Management

Informatics:

UNIFI v1.9.4 in waters_connect

Workflow:

“Glycan FLR with MS confirmation” workflow

Results and Discussion

As a byproduct of their design, fusion proteins often have more complex structures than mAbs including increased disulfide bonds and glycosylation sites which require optimized sample preparation for the analysis of released N-glycans. To optimize the release of N-glycans, a fusion protein with 28 pairs of disulfide bond and a total of 6 N-glycosylation sites was selected as a surrogate molecule representative of complex biotherapeutics. The applicability of currently available N-glycan release method was evaluated using the Waters GlycoWorks RFMS N-glycan Kit. Following a 3-min denaturation using the detergent RapiGest SF at 90 °C, deglycosylation was carried out at 55 °C for 5-min using Rapid PNGase F. To directly measure the yield of glycan release, a fraction of the deglycosylated protein was analyzed by reversed phase chromatography (RPLC)-MS on the BioAccord LC-MS System with in-line FLR detection. As shown in Figure 2A, two peaks were separated and identified as the light chain (~22.8 kDa) and the heavy chain (~65.8 kDa). In the ESI+ MS spectra of the heavy chain (Figure 2B), low-level MS-response spanning 1,500–2,500 m/z was observed and is indicative of incomplete denaturation, which can lead to partial deglycosylation due to the hindered accessibility of PNGase F to the glycosylation sites. To ensure complete protein denaturation, a conventional method was evaluated using 8 M Guanidine-HCl (GdnHCl) as the denaturant and 5 mM DTT as the reducing agent to reduce the disulfide bonds.6 After 30-min incubation at room temperature, the denatured fusion proteins were alkylated using iodoacetamide and exchanged to a digestion buffer to minimize the impact of GdnHCl on enzymatic activity, followed by 16 hours of PNGase F enzymatic digestion at 37 °C. In the RPLC-MS analysis of the deglycosylated proteins, the intact protein (with heterogeneous glycans attached) was not observed in the MS spectrum (Figure 2C), demonstrating the denaturation was complete. However, the mass of FA2 (G0F) glycoform (68,601 Da) was observed in the deconvoluted MS spectrum in addition to the aglycosylated form of the alkylated heavy chain at 67,157 Da (Figure 2C inset), suggesting incomplete deglycosylation due to the absence of detergent in the deglycosylation buffer. As a result, an enzyme-friendly reducing agent was evaluated for its compatibility with the GlycoWorks RapiFluor-MS N-glycan Kit sample preparation protocol. The use of 6 mM tris(2-carboxyethyl) phosphine (TCEP) in parallel with RapiGest SF during the denaturation step resulted in further reduction of the disulfide bonds. As an added benefit, the presence of the enzyme-friendly detergent and reducing agent in the digestion buffer eliminated the need of alkylation or buffer exchange and facilitated the release of N-glycans. With 5-min PNGase F incubation, the deglycosylated proteins in RPLC-MS analysis showed a single peak at the mass of 65,844 Da in the charge deconvoluted MS spectrum (Figure 2D), which matched the mass of the aglycosylated heavy chain. Therefore, complete deglycosylation from the disulfide-rich fusion protein was achieved, enabling confident assignment and quantification of the released N-glycans in the following LC-FLR-MS analysis.

Figure 2. RPLC-MS of the deglycosylated protein under different denaturation conditions. (A) The separation of light chain and heavy chain after denaturation and deglycosylation. (B) Charge deconvoluted MS spectra of the deglycosylated heavy chain using the original RFMS N-glycan protocol developed for mAbs showed incomplete deglycosylation of the fusion protein. (C) Using GdnHCl and DTT in denaturation showed high degree of denaturation but partial deglycosylation. Figure inset is the deconvoluted MS spectrum showing the aglycosylated form and the FA2 (G0F) glycosylated form of the fusion protein. (D) Using the optimized RFMS-based method (disulfide-rich protocol), complete denaturation and deglycosylation was achieved. 

With the optimized deglycosylation method, N-glycans were released from the fusion protein and then labeled with the FLR/MS signal-enhancing tag, RFMS, followed by HILIC-FLR-MS analysis. Using a 60-min gradient, a total of 84 glycans were separated and identified using a customized glycan structural library.4 To assess the impact of reducing agent on RFMS labeling, the most abundant glycan, FA2, was selected for the comparison of fluorescent response obtained from the original and the optimized RFMS deglycosylation method. As shown in Figure 3A, with the addition of TCEP, the FLR response of FA2 decreased by approximately 5%, suggesting the addition of the reducing agent inhibits labeling efficiency to a small degree. To minimize the impact of the reducing agent, the ratio of RFMS to protein was increased two-fold, resulting in the comparable recovery of FA2 as shown in Figure 3A. Furthermore, a two-fold increase in the FLR response of a less solvent accessible glycan (FA3G3S3) suggests the use of TCEP improved accessibility of the PNGaseF enzyme to glycan sites (Figure 3B). These data demonstrated that enzyme-friendly reducing agents are compatible with the GlycoWorks RapiFluor-MS labeling protocol with minimal adjustment of the RFMS to protein ratio to generate equivalent or higher detector responses when compared to the original labeling protocol.

Figure 3. The optimization of glycan labeling using various concentration of RFMS labeling reagent and different reducing agents for (A) FA2, and (B) a less solvent accessible glycan, FA3G3S3. (C) With the optimized method, the low abundant peaks observed in the FLR trace showed high S/N of MS signals. Figure inset is an example showing the MS spectrum for a low abundant peak, Man7, at a relative abundance of 0.08%. 

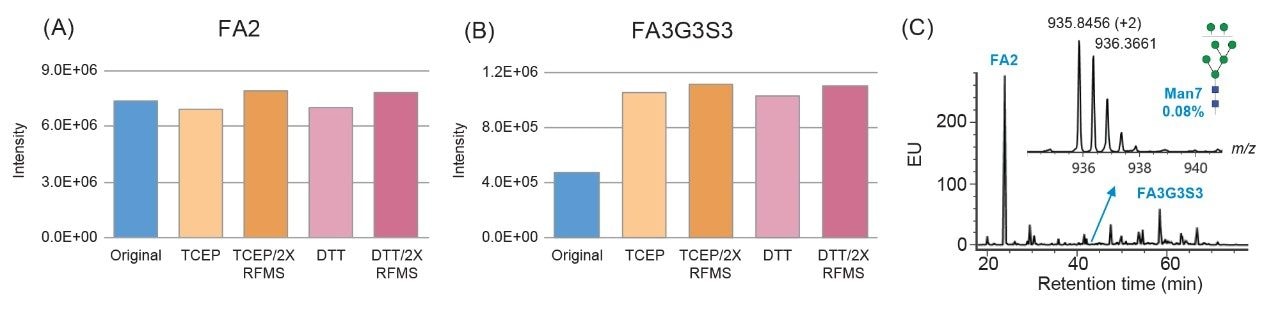
To expand the usability of the sample preparation method in upstream and downstream activities, the effect of a more commonly used reducing agent, DTT, was evaluated on the labeling efficiency and yield of glycans. Although the thiol group on DTT can react with the RFMS reagent and affect glycan labeling, a 6.5 mM final concentration of DTT was found to have a similar impact on labeling and glycan releasing compared to that of TCEP (Figure 3A and 3B). Since DTT does not need neutralization prior to use and is typically more cost-effective, it would be more QC-friendly to be used as the reducing agent for sample preparation in a routine analysis environment. As mentioned previously, the incorporation of a reducing agent in the denaturing step allowed for increased accessibility of the PNGaseF enzyme to solvent restricted glycan sites. This resulted in the increased yield of N-linked glycans and detection of low abundance glycans in both FLR and MS as noted by the high signal-to-noise ratio obtained for Man7, a glycan at 0.08% relative abundance (Figure 3C). Together, these results demonstrated the improved accuracy and efficiency of the sample preparation method for N-glycan profiling of disulfide-rich and heavily glycosylated fusion proteins.

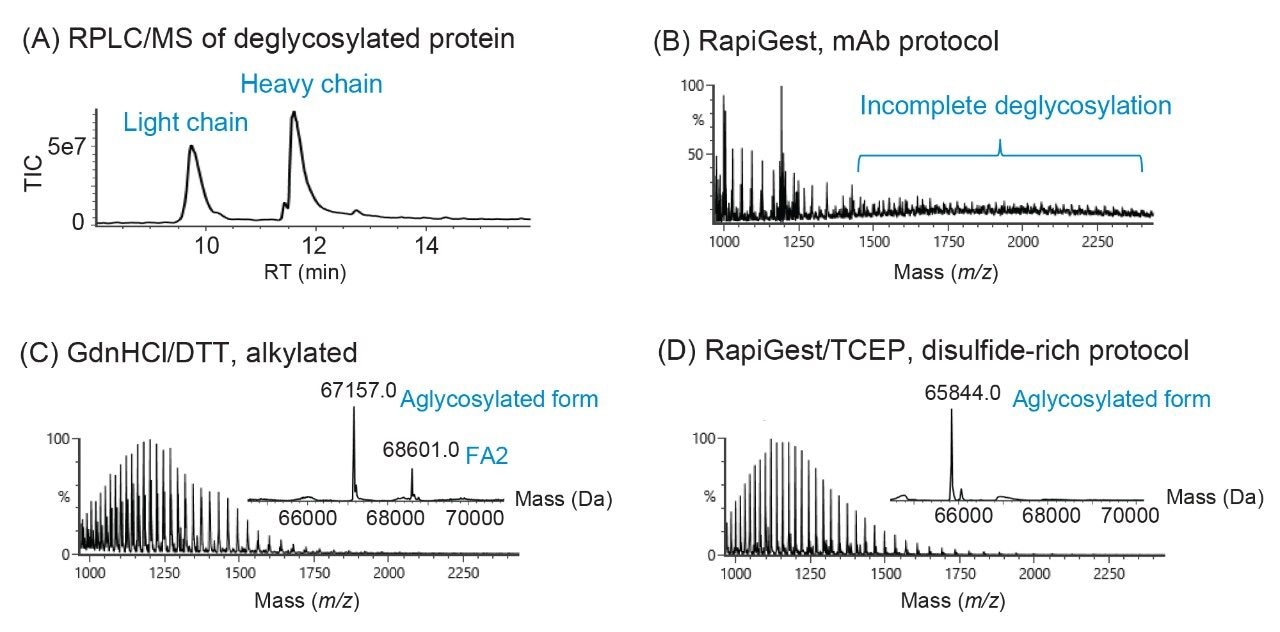
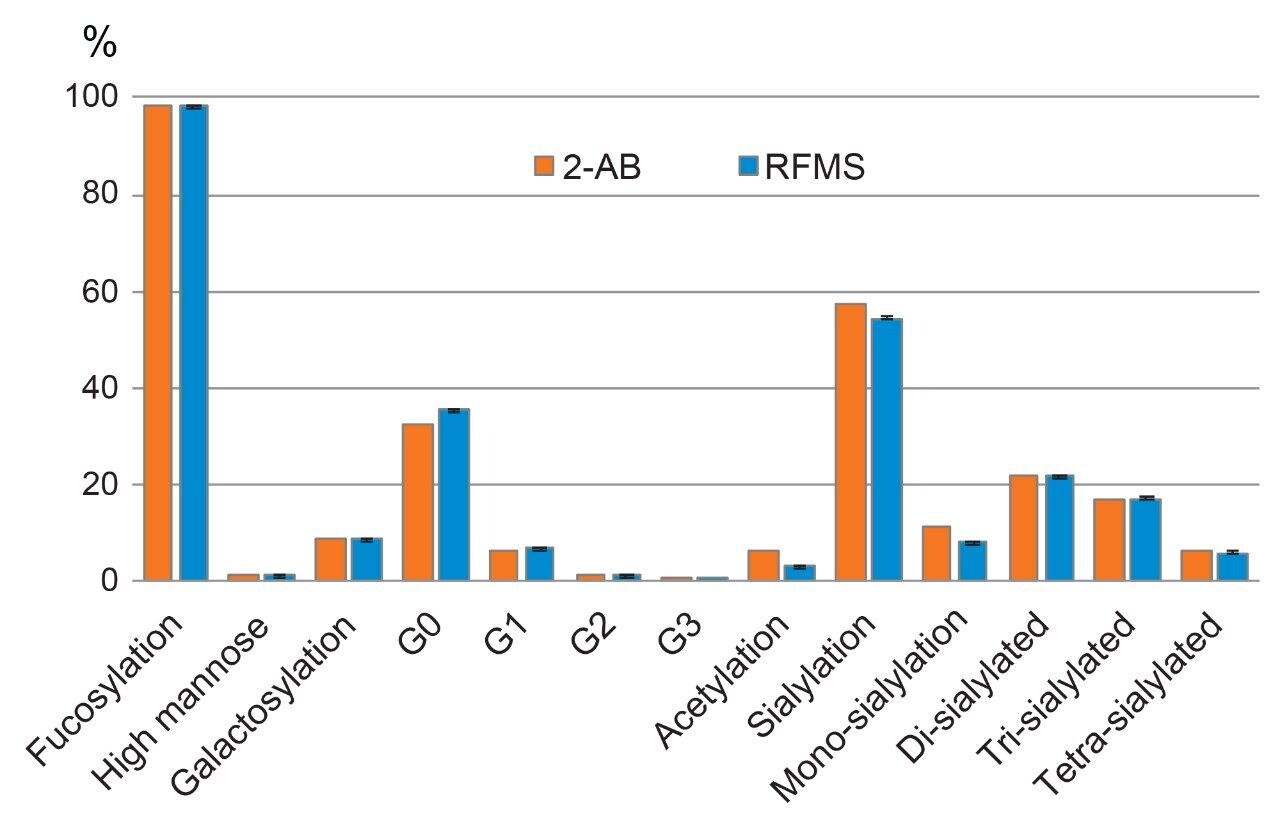
Evaluation and adoption of new technologies are recommended by the International Committee of Harmonization (ICH) to ensure product quality and safety, which emphasizes the importance of comparability studies in facilitating the transfer from legacy methods. In the biopharmaceutical industry, conventional labeling reagents such as 2-aminobenzoamide (2-AB) and 2-aminoanthranilic acid (2-AA) have been widely used in glycan derivatization for FLR detection.7 While effective in obtaining sensitive FLR response, these methods require long enzymatic deglycosylation and FLR labeling time and use complicated sample preparation protocols. Scientists in the biopharmaceutical industry have been looking for alternative methods that are efficient, easy to follow, and sensitive. To evaluate the comparability of N-glycan analysis results using different sample preparation methods, the glycans prepared using the optimized RFMS-based method were separated and quantified based on the relative peak area in FLR chromatogram, and then grouped based on the glycan structural attributes. As shown in Figure 4, a 98.3% fucosylation, 54.3% sialylation, and 1.2% high mannose type glycans were obtained using the optimized RFMS sample preparation method. These results were overall comparable with the data previously obtained from the conventional labeling method that employed GdnHCl/DTT denaturation and 2-AB labeling, demonstrating the feasibility of migration from legacy 2-AB labeling method to the optimized RFMS method. In addition, a higher level of FA2 (or G0F, in the group of G0) was observed in the RFMS derivatization method, which was consistent with the observation in Figure 2C where FA2 was not fully released in the GdnHCl denaturation method. Collectively, these results demonstrated that this sample preparation can be easily adapted to the optimized RFMS-based method for N-glycan analysis of disulfide-rich fusion proteins with improved deglycosylation efficiency and overall accuracy for glycan profiling.

Figure 4. Quantification results of glycan attributes using the updated RFMS sample preparation method are overall consistent with the legacy 2-AB data. The level of FA2 (or G0F, in the group of G0) was observed to be higher in the RFMS method, which can be attributed to the more complete deglycosylation of the less solvent accessible glycans. Error bars represent the standard deviation of quantification results from three consecutive injections. 

Conclusion

In this work, a rapid sample preparation method was developed based on the GlycoWorks RFMS N-glycan Kit for the N-glycan analysis of disulfide-rich fusion proteins. Using a reducing agent combined with an enzyme friendly detergent, RapiGest SF, to break the protein disulfide bonds, complete deglycosylation was achieved using Rapid PNGase provided in the kit, leading to efficient labeling and accurate quantification of RFMS labeled glycans via HILIC-FLR-MS analysis. The overall sample preparation time was less than 30 min. The impact of reducing agent on labeling efficiency was mitigated by using 2× higher ratio of RFMS labeling reagent. Overall, this application note demonstrates an optimized sample preparation method with increased accuracy and efficiency in N-glycan profiling for a class of challenging biotherapeutic proteins with a high level of disulfide linkages.

Acknowledgements

We thank our collaborators Mauro Sassi, Erika Birolo, Nunzio Sepe, Paolo Felici, and Angelo Palmese from Merck Serono for providing the sample and structural information.

References

  1. Strohl WR. Fusion Proteins for Half-Life Extension of Biologics as a Strategy to Make Biobetters. BioDrugs. 2015; 29(4): 215–239.
  2. Higel F, et al. N-glycans of Complex Glycosylated Biopharmaceuticals and their Impact on Protein Clearance. European Journal of Pharmaceutics and Biopharmaceutics. 2019; 139, 123–131.
  3. Yu, Y. Applying a Novel Glycan Tagging Reagent, Rapi Fluor-MS, and an Integrated UPLC-FLR/QTof MS System for Low Abundant N-Glycan Analysis. Waters Application Note, 2015. 720005383EN.
  4. Zhang X, Reed C, Shion H, Alley W, Birdsall R, and Yu Y. Increasing Productivity and Confidence for N-linked Glycan Analysis of Biosimilars Using the BioAccord System. Waters Application Note, 2019. 720006545EN.
  5. GlycoWorks RapiFluor-MS Quick Start Protocol. 720006992EN.
  6. Fang J, et al. Advanced Assessment of the Physicochemical Characteristics of Remicade and Inflectra by Sensitive LC-MS Techniques. MAbs. 2016 Aug-Sep; 8(6): 1021–1034.
  7. Ruhaak LR, et al. Glycan Labeling Strategies and their Use in Identification and Quantification. Anal Bioanal Chem. 2010 Aug; 397(8): 3457–3481.

720007162, February 2021

Back To Top Back To Top