In this application note, it is shown that the BioResolve RP mAb Polyphenyl Column, when paired with simple 0.1% TFA waters/acetonitrile mobile phases, works well as a tool to use in the quantification of various types of proteins that might be formulated in buffers containing L-histidine and rHSA.
Protein quantification is a basic requirement in protein drug substance and product testing. Typically, this quantification is performed using UV absorbance at 280 nm. However, there may be conditions where components of the protein formulation buffer interfere with using UV absorbance.
In this application note, a BioResolve RP mAb Polyphenyl Column is used to perform reversed-phase LC separations and to quantify rituximab (a monoclonal antibody), interleukin-12, erythropoietin, and abatacept (a fusion protein) in the presence of histidine buffer and recombinant human serum albumin (rHSA). The BioResolve RP mAb Polyphenyl Column is well suited to this application being that it is based on an efficient, silica-based, solid-core, 2.7 µm particle with an optimized 450Å pore diameter and novel polyphenyl bonding.1,2
Rituximab, interleukin-12, erythropoietin, and abatacept were diluted into a series of concentrations using 26 mM histidine buffer, pH 6. A constant concentration (1 or 2.5 mg/mL) of recombinant human serum albumin (rHSA) was also added to each sample.
System: |
ACQUITY UPLC H-Class Bio |
System configuration: |
From auto sampler to column inlet: |
Active pre-heater (APH), MP35N, 12.5 (p/n: 205000756) |
|
From column outlet to TUV: |
|
Assy, tubing inlet 0.0025 ID LT PEEK NUT, 8.5" (p/n: 700009971) |
|
Sample temp.: |
4 °C |
Column temp.: |
60 °C for IL-12, EPO and abatacept |
80 °C for rituximab |
|
Flow rate: |
0.3 mL/min |
0.2 mL/min |
|
Injection volume: |
10 µL |
Column: |
BioResolve RP mAb Polyphenyl, 450Å, 2.7 µm, 2.1 x 50 mm (p/n: 176004156 that contains column and intact mAb and subunit reference standards) |
Detection: |
ACQUITY UPLC TUV Detector with 5 mm titanium flow cell, 280 nm |
Sample collection/vials: |
LCGC Certified Clear Glass 12 x 32 mm Screw Neck Total Recovery Vial, with Cap and Preslit PTFE/Silicone Septa, 1 mL Volume, 100/pkg (p/n: 186000385C) |
Mobile phase A: |
0.1% (v/v) trifluoroacetic acid (TFA) |
Mobile phase B: |
0.1% (v/v) trifluoroacetic acid (TFA) |
Data management: |
Empower 3 Software |
Time |
Flow Rate (mL/min) |
%A |
%B |
Curve |
---|---|---|---|---|
0.00 |
0.3 |
61 |
39 |
- |
0.50 |
0.3 |
61 |
39 |
6 |
3.00 |
0.3 |
42 |
58 |
6 |
4.00 |
0.3 |
10 |
90 |
6 |
4.01 |
0.3 |
61 |
39 |
11 |
15.00 |
0.0 |
61 |
39 |
11 |
Time |
Flow Rate (mL/min) |
%A |
%B |
Curve |
---|---|---|---|---|
0.000 |
1.8 |
65 |
35 |
- |
0.083 |
1.8 |
65 |
35 |
6 |
0.500 |
1.8 |
45 |
55 |
6 |
0.650 |
1.8 |
10 |
90 |
6 |
0.660 |
1.8 |
65 |
35 |
11 |
5.000 |
0.0 |
65 |
35 |
11 |
Time |
Flow Rate (mL/min) |
%A |
%B |
Curve |
---|---|---|---|---|
0.00 |
0.3 |
63 |
37 |
- |
0.50 |
0.3 |
63 |
37 |
6 |
3.00 |
0.3 |
40 |
60 |
6 |
4.00 |
0.3 |
10 |
90 |
6 |
4.01 |
0.3 |
63 |
37 |
11 |
15.00 |
0.0 |
63 |
37 |
11 |
Time |
Flow Rate (mL/min) |
%A |
%B |
Curve |
---|---|---|---|---|
0.00 |
0.2 |
60.5 |
39.5 |
- |
0.50 |
0.2 |
60.5 |
39.5 |
6 |
3.00 |
0.2 |
53.0 |
47.0 |
6 |
4.00 |
0.2 |
10.0 |
90.0 |
6 |
4.01 |
0.2 |
60.5 |
39.5 |
11 |
15.00 |
0.0 |
60.5 |
39.5 |
11 |
Time |
Flow Rate (mL/min) |
%A |
%B |
Curve |
---|---|---|---|---|
0.00 |
0.3 |
62 |
38 |
- |
0.50 |
0.3 |
62 |
38 |
6 |
5.50 |
0.3 |
57 |
43 |
6 |
6.50 |
0.3 |
10 |
90 |
6 |
6.51 |
0.3 |
62 |
38 |
11 |
15.00 |
0.0 |
62 |
38 |
11 |
A protein drug substance or drug product is usually dissolved in a formulation buffer, for which histidine is commonly used.3 In a formulation, rHSA is also often used as an excipient to increase the stability and to act as a carrier protein.4 In this experiment, L-histidine and rHSA were added intentionally to the protein solutions to mimic a formulation buffer. In order to be quantified, proteins need to be separated chromatographically from both histidine and rHSA. On reversed-phase columns, histidine elutes in the void. So, the task was to separate the protein drug from rHSA, and construct a calibration curve for quantification that would be valid even without the presence of rHSA. The molecular mass of rHSA is about 67 KDa.
Interleukin-12 (IL-12) is a key immunoregulatory cytokine with a molecular mass of 70 kDa. It has been suggested that IL-12 plays a vital role in treating diseases such as viral and bacterial infections and cancers.5
Figure 1A shows IL-12 and rHSA separated on a BioResolve RP mAb Polyphenyl Column in under 4 minutes, with a resolution of 3.5 between the column bound rHSA and IL-12. Figure 1B shows peaks from various concentrations of IL-12. Based on the peak area, a calibration curve was constructed (bottom panel of Figure 1C). Two linear dynamic ranges were identified from 0.01 to 0.1 µg and from 0.1 to 2 µg. The mass load (x) was calculated back from the peak area (y) and the linear equation obtained from the calibration curve, and it was then compared with the experimental mass load. The % error was calculated as (calculated mass load – experimental mass load)/experimental mass load *100%. A residual plot was constructed showing % error vs. mass load (top panel of figure 1c). For both linear ranges, the % error was less than 8% for all mass loads.
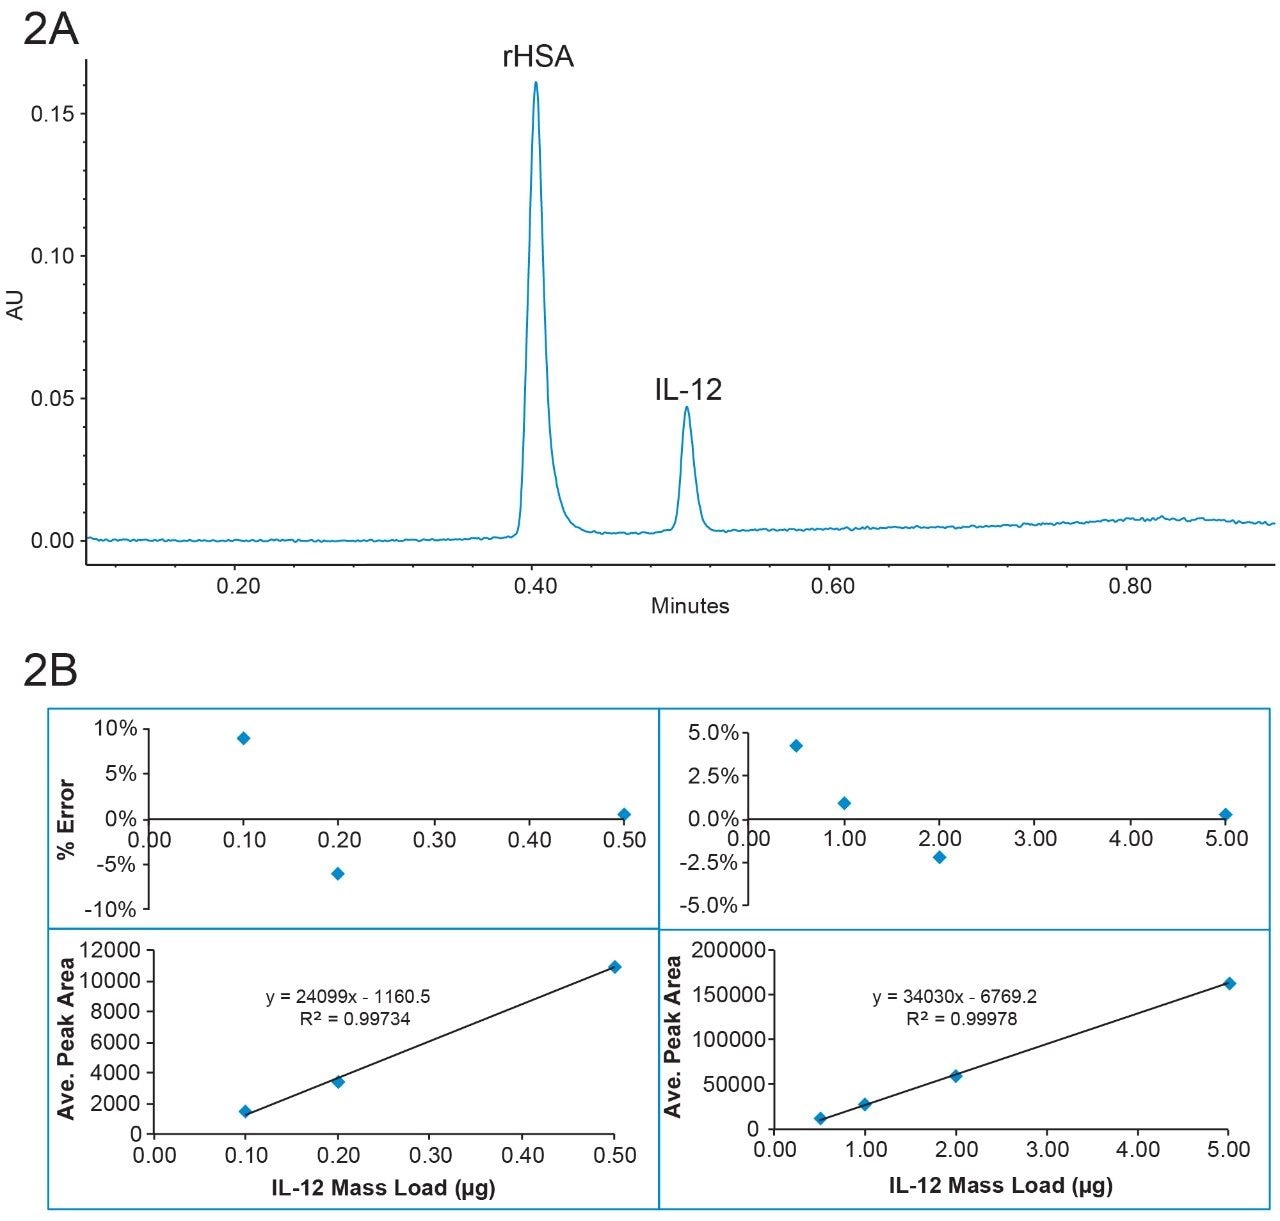
Since the BioResolve RP mAb Polyphenyl Column is packed with solid-core particles, higher flow rate and faster separation can be employed without sacrificing chromatographic performance, due to the excellent mass transfer (kinetic) property of these particles. As seen in Figure 2A, IL-12 and rHSA was separated under 1 minute at a flow rate of 1.8 mL/min. The resolution is the same as when the sample was separated at 0.3 mL/min with the same gradient slope (data not shown). Figure 2B shows the calibration curve and residual plot with the flow rate of 1.8 mL/min. The mass load % error was within 10% for the two linear dynamic ranges (0.1–0.5 µg and 0.5–5 µg). These results demonstrate that BioResolve RP mAb Polyphenyl Columns can be used for high throughput protein quantification in formulation buffer.
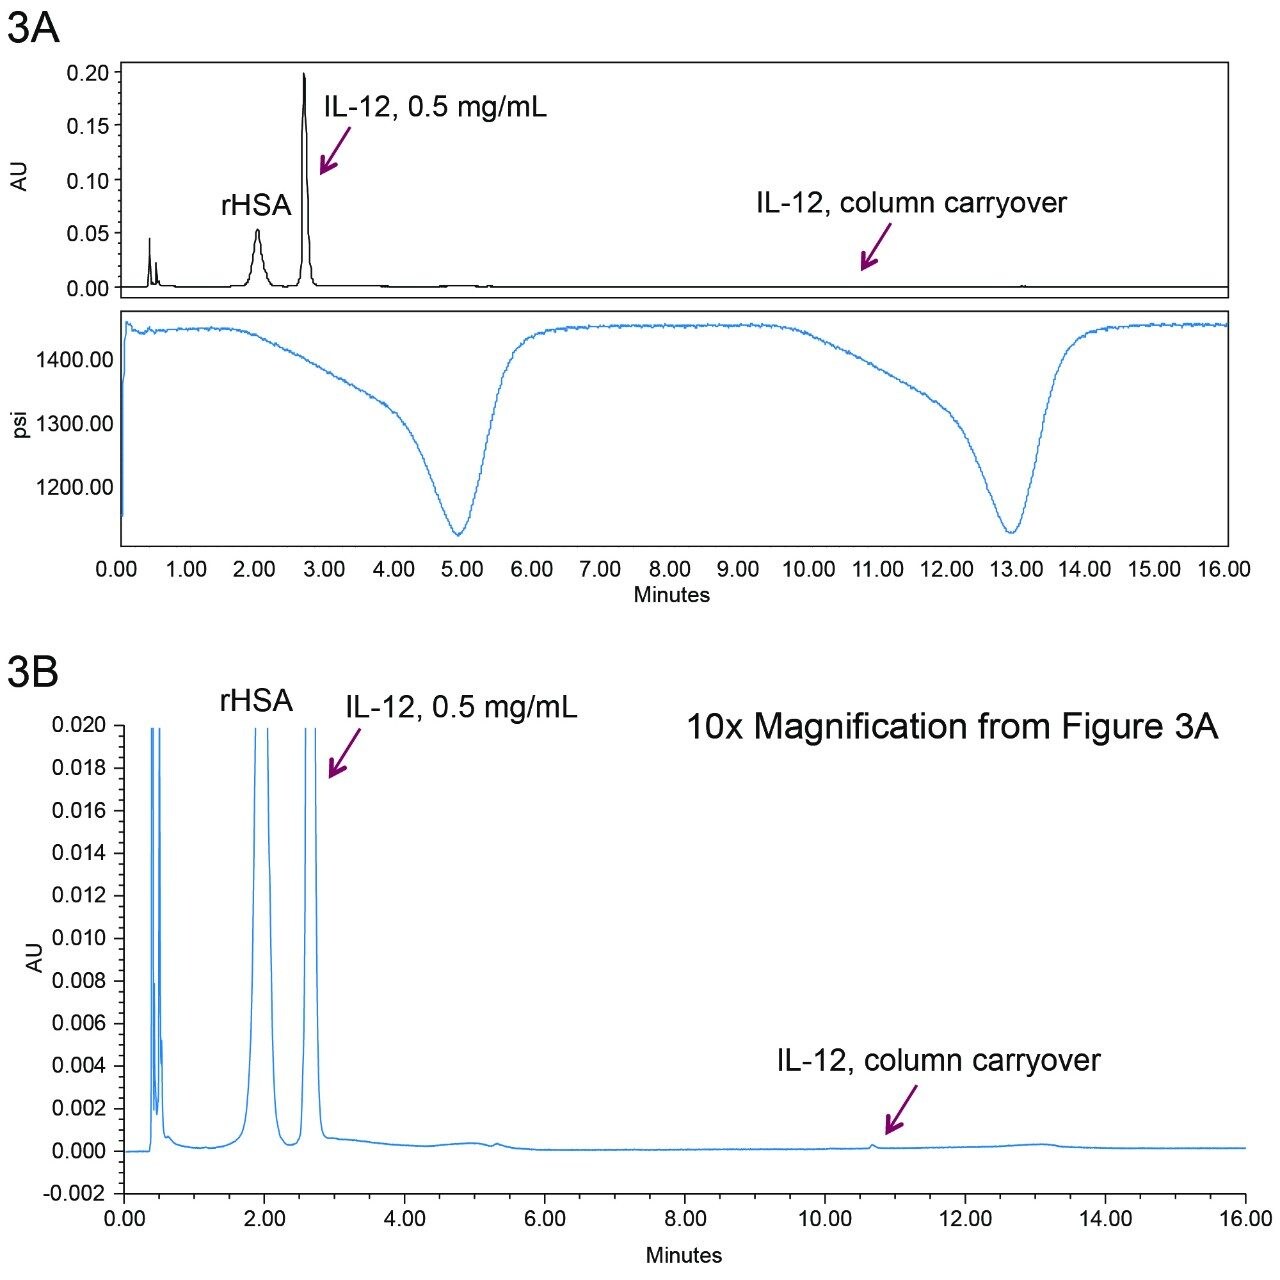
Injection-to-injection sample carryover from the column can be a problem for many reversed-phase protein separations, making quantification inaccurate. The BioResolve RP mAb Polyphenyl Column has been designed to have very low carryover by way of high coverage of the specially designed polyphenyl bonding. A double gradient was used to determine the carryover from the column. This example is shown in Figure 3A.
The sample was injected and the components were separated during the first gradient. After completion of the first gradient, a second gradient was started immediately without injecting the sample. If the column were to show carryover, IL-12 would be seen to elute at the indicated retention time. The ratio of the IL-12 peak areas between the second gradient and the first gradient is calculated as the percent carryover from the column. In Figure 3A, the top panel shows the chromatogram, the bottom panel shows the pressure trace, and arrows indicate where IL-12 is supposed to elute from the carryover determining gradient run. Figure 3B is a zoomed view of the y-axis. A small peak can be seen at a retention time of 10.6 minutes, which corresponds to IL-12 column carryover. The IL-12 carryover from the column is calculated as 0.11%, which limits the linear dynamic range to approximately 2–3 orders of magnitude. Additional blanks would be added to extend the linear dynamic range of the assay.
There is a possibility that the carryover could be masked by the carrier protein rHSA, with it potentially blocking the non-specific binding sites throughout the column. However, similar carryover was observed for a neat injection of IL-12 (0.08%).
EPO is a biotherapeutics glycoprotein that stimulates a patient’s production of red blood cells. It is used to treat anemia resulting from kidney failure or cancer treatment.6 The molecular mass of EPO is approximately 30.4 KDa.
Figure 4 shows various concentrations of EPO separated from rHSA on a BioResolve RP mAb Polyphenyl Column, and the insert shows the corresponding calibration curve and the residual plot. EPO was well resolved from rHSA with a resolution of >5. The linear dynamic range is from 0.5 to 10 µg with an R2 value of 0.9999. The mass load % error is within 3%. Column carryover for EPO was not detectable.
Abatacept is a Fc-fusion protein used to treat autoimmune diseases such as rheumatoid arthritis.7 The molecular mass of Abatacept is about 90 KDa.
Figure 5 shows various concentrations of abatacept separated from rHSA. Although the separation was not baseline resolved, a linear dynamic range from 0.2 to 5 µg was achieved with R2 = 0.9999. The mass load % error is within 3%. Column carryover for abatacept was undetectable.
Rituximab is a monoclonal antibody that treats certain autoimmune diseases and types of cancer.8 The molecular mass of rituximab is around 150 kDa.
Figures 6 shows the chromatograms of various concentrations of rituximab separated from rHSA. For these separations, the column temperature was increased from 60 to 80 °C to ensure full recovery of the injected rituximab. Each separation took less than 10 minutes. From these data, a calibration curve was constructed, and the linear dynamic range was found to be from 0.1 to 5 µg with an R2 value of 0.9993. The residual plot shows that the calculated mass load % error is <12%. Column carryover for rituximab was not detectable.
The quantification of proteins as they exist in various biotherapeutic drug formulations is important in drug substance and drug product testing. In some cases, a formulation buffer might prohibit the use of simple UV absorbance measurements. There may even be cases, such as when using Immobilized Metal Affinity Chromatography (IMAC) with imidazole buffers, where purification intermediates cannot be quantified with direct UV absorbance measurements. In these cases, a chromatographic separation based on reversed-phase or affinity chromatography is needed to separate and accurately quantitate the drug from interfering UV absorbing contaminants.
In this application note, we have shown that the BioResolve RP mAb Polyphenyl Column, when paired with simple 0.1% TFA water/acetonitrile mobile phases, works well as a tool to use in the quantification of various types of proteins that might be formulated in buffers containing L-histidine and rHSA. With the methods presented here, it was possible to obtain excellent linearity, low % error, good dynamic ranges, along with extremely low column injection-to-injection sample carryover to allow for the routine, high throughput analyses.
720006233, March 2018