For research use only. Not for use in diagnostic procedures.
This application note describes the SONAR mode of acquisition implemented on a benchtop quadrupole, the Xevo G2-XS QTof Mass Spectrometer, that has been embedded into a DESI imaging workflow for lipid imaging and identification directly from rat brain tissue sections.
Mass spectrometry imaging (MSI) allows the correlation of spatial and chemical information directly from biological tissues. Desorption Electrospray Ionization (DESI) is an ambient ionization technique that has gained popularity over the past few years due to the ease of sample preparation, the ESI-like spectra, and also the non-destructive nature of the DESI technique.1
Typically MSI experiments are untargeted and are performed using the full scan MS mode of data acquisition. After mining the MSI data and identifying potential biomarkers, the next step is their identification which is usually performed using a limited number of manually entered MS/MS experiments.
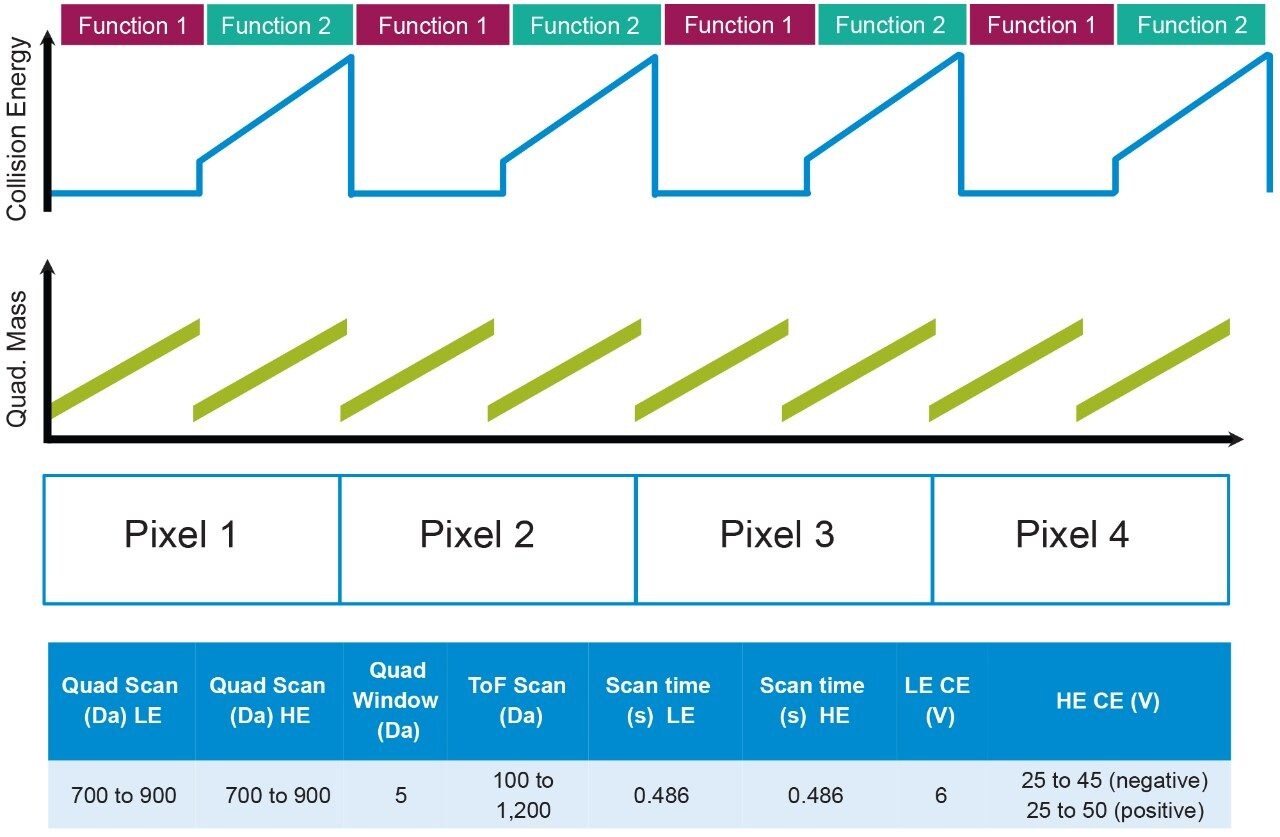
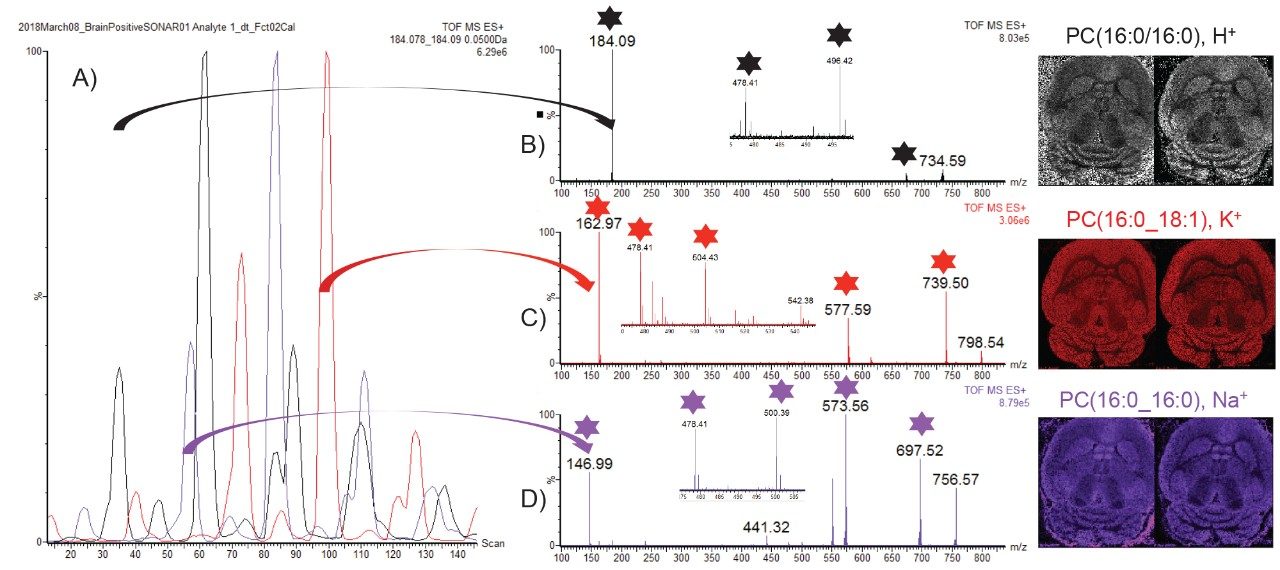
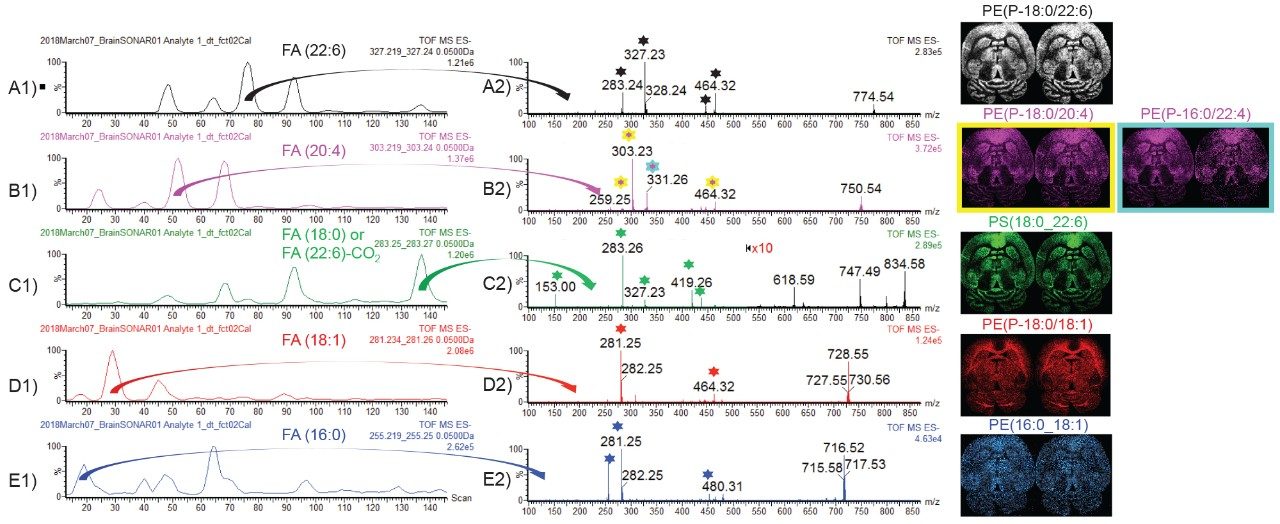
Recently, a new Data Independent Acquisition (DIA) method called SONAR has been introduced, utilizing a scanning quadrupole mass filter m/z window in a QTof geometry. In this method, a resolving quadrupole mass filter m/z window is scanned repetitively with precursor and MS/MS data acquired at rapid spectral acquisition rates. The method produces a highly specific and unbiased two-dimensional dataset that can be viewed and processed using a variety of informatics tools.
Here, we describe the SONAR mode of acquisition implemented on a benchtop quadrupole, the Xevo G2-XS QTof Mass Spectrometer, that has been embedded into a DESI imaging workflow for lipid imaging and identification directly from rat brain tissue sections.
Experiments have been carried out on rat brain tissue sections. These were produced using a cryotome and deposited on a standard microscope slide stored at -80 °C until analysis. The slides were directly mounted into the DESI source straight from the freezer, with no sample preparation or pre-treatment required.
MS imaging experiments were performed in positive and negative ionization modes using a Waters 2D DESI stage mounted on a Xevo G2-XS QTof operating in SONAR mode (MassLynx SCN 949).
For DESI, the solvent flow rate was set at 2 μL/min (95:5 MeOH:water) with a nebulizing gas pressure of 5 bar. Figure 1 describes the method whereby both precursor and pseudo MS/MS data are acquired for each pixel (100 × 100 μm), with the quadrupole m/z window scanning for the low collision energy (LE) function to collect the precursor information (Function 1) and the elevated ramping collision energy (HE) to collect the fragment information (Function 2). The QTof acquisition system profiles the scanning quadrupole m/z window in the same way that mobility measurements are profiled allowing a time dependent linkage of the precursor and fragment ions to be established, more details of the mechanics of SONAR can be found in reference Rapid Commun Mass Spectrom. 2017;31:1599-1606.2
The imaging data were processed and visualized using the High Definition Imaging (HDI) Software v1.4 (Waters Corporation) for detailed image analysis. Visualization of the multi-dimensional data was conducted with MassLynx Software and DriftScope Software. Lipid identification was performed using the MS tools functionality in LipidMaps (http://www.lipidmaps.org/).
Figure 2 shows the intense lipid ion signal observed between m/z 700 and 900 in the LE SONAR MS spectra from the whole brain tissue, in both positive and negative ionization mode. Furthermore in the HE SONAR spectra, fragment ions were detected between m/z 100 and 900 due to the elevated collision energy inducing CID fragmentation.
After data collection, the mass spectral data may be interrogated using the DriftScope Software package where 2-Dimensions or 3-Dimensions of the data can be visualized, as seen in Figures 3B and 3C. In this case, the drift time axis is related to the quadrupole set mass. The data cube was rotated to show scanning quad m/z window instead of acquisition time and exported into MassLynx, as seen in Figure 3A. In this instance, the X,Y dimension information is essentially flattened. An example spectrum of the HE SONAR fragmentation can be observed in Figure 3D. This pseudo MS/MS spectrum was extracted for the lipid species m/z 885.56 which has been identified as a phosphatidylinositol (PI)(18:0_20:4). The key indicative fragments are m/z 241 (inositol head group fragment ion), m/z 283 (fatty acid chain [18:0]-), and m/z 303 (fatty acid chain [20:4]-).
As data were recorded in an imaging mode, the LE and HE functions could be processed and visualized using HDI Software v1.4. In this case, the whole data set is peak picked allowing correlation of the LE and HE species. Figure 4A shows the LE and HE images, spectra, and the 2D plot that contained both LE and HE information. Using HDI Software v1.4, it was possible, after the selection of precursor m/z 798.54, to correlate the fragments associated with the appropriate calculated quadrupole set m/z as displayed in Figure 4B. However it can be observed that there were several fragments in the spectra that do not originate from m/z 798.54 precursor ion. An additional type of correlation was performed based on the spatial distribution which should be the same between the precursor ion and its fragment ions. The spatial correlation was achieved using the Pearson productmoment algorithm where a perfect match gives a correlation factor R of 1 and an opposite correlation gives an R value of -1. Here, R filter settings were set between 0.3 and 1, resulting in a more specific number of correlated fragments as displayed in Figure 4C. It was then possible to generate a composite image from the fragments m/z 162.97 (H2O4PC2H4K+), 478.34, 504.36, 577.53(M-H2O4PC2H4N(CH3)3)K+), and 739.47 (M-N(CH3)3)K+).
In positive ion mode, lipids can be detected in protonated, potassiated, and sodiated forms with headgroup fragment ions of m/z 184, 163, and 147 respectively. A novel way of mining the complex DESI imaging data is to extract specifically the quadrupole window m/z scanning chromatogram for each of the characteristic m/z peaks related to each cation form as seen in Figure 5A. It can be observed that some scanning quadrupole window contained multiple cation forms which could indicate a mix of lipids. However some bins only present one cation form. The MS/MS spectrum in Figure 5B only contains m/z 184 for the precursor ion m/z 734.6 and has been identified as phosphatidylcholines (PC) (16:0/16:0) [H]+. The MS/MS spectrum in Figure 5C only contains m/z 163 for the precursor ion m/z 798.54 and has been identified as PC(16:0_18:1), [K]+. The MS/MS spectrum in Figure 5D only contains m/z 147 for the precursor ion 756.57 and has been identified as PC(16:0/16:0) [Na]+. For each identified lipid, the ion image of the precursor from the LE function (left) and composite image from the fragments (with stars) in the HE function is displayed.
In negative ion mode, lipids ionize in deprotonated form only. The benefit of fragmenting deprotonated lipids is the generation of intense fragments that are characteristic to the fatty acid (FA) chains of the lipids. Fragment ion m/z 255 is characteristic to FA(16:0), m/z 281 to FA(18:1), m/z 283 to FA(18:0) or FA(22:6)-CO2, m/z 303 to FA(20:4), and m/z 327 to FA(22:6). Figure 6 A1, B1, C1, D1, and E1 display the extracted quadrupole window scanning chromatograms for each of the characteristic FA fragment ions. For example, in the MS/MS spectrum in Figure B2, two lipids have been identified for m/z 750.5, PE(P-18:0/20:4) with characteristic fragment ions m/z 259, 303, and 464 and a PE(P-16:0/22:4) with characteristic fragment ions m/z 331.
Rat brain tissue sections were kindly provided by the Maastricht MultiModal Molecular Imaging (M4I) Institute, financially supported by the Dutch Province of Limburg as part of the “LINK” program.
720006384, September 2018