This application note demonstrates detailed and thorough workflows for identification and characterization of complex multispecies data sets. Trends and pharmacokinetic profiles for multiple metabolites were evaluated, which enabled confirmation of human metabolites in preclinical species.
Metabolite identification has evolved in recent years from a largely labor intensive manual process to a technique that leverages software, which can rapidly screen and detect metabolites from in vitro or in vivo studies. Screening also requires close integration with tools that enable accurate quantification, trend plotting, and reporting. Projects that involve challenging drug concentrations, complex pathways, drug delivery systems, or biotherapeutic molecules may also require additional analytical tools such as ion mobility, targeted modes, and/or tailored workflows.
The analysis of data generated from ion mobility-equipped instrumentation has historically required separate software packages and processing workflows. UNIFI and Vion IMS QTof implement this in a straightforward, integrated manner, enabling easy access to cleaner data with high quality, excellent mass accuracy, and robust CCS measurements.
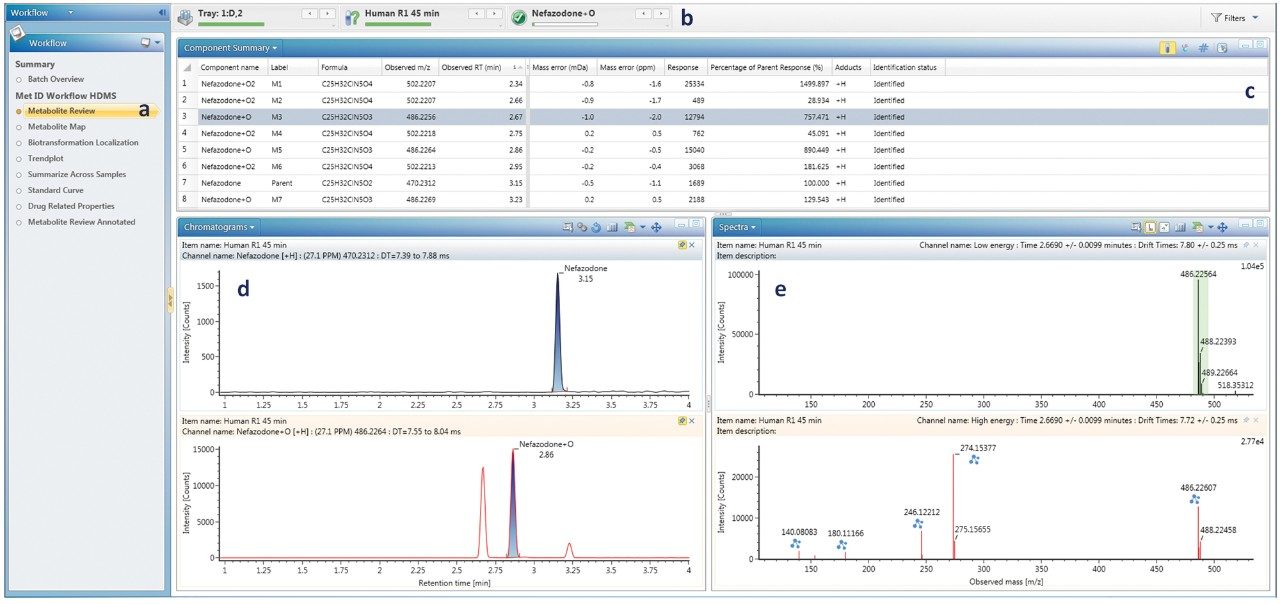
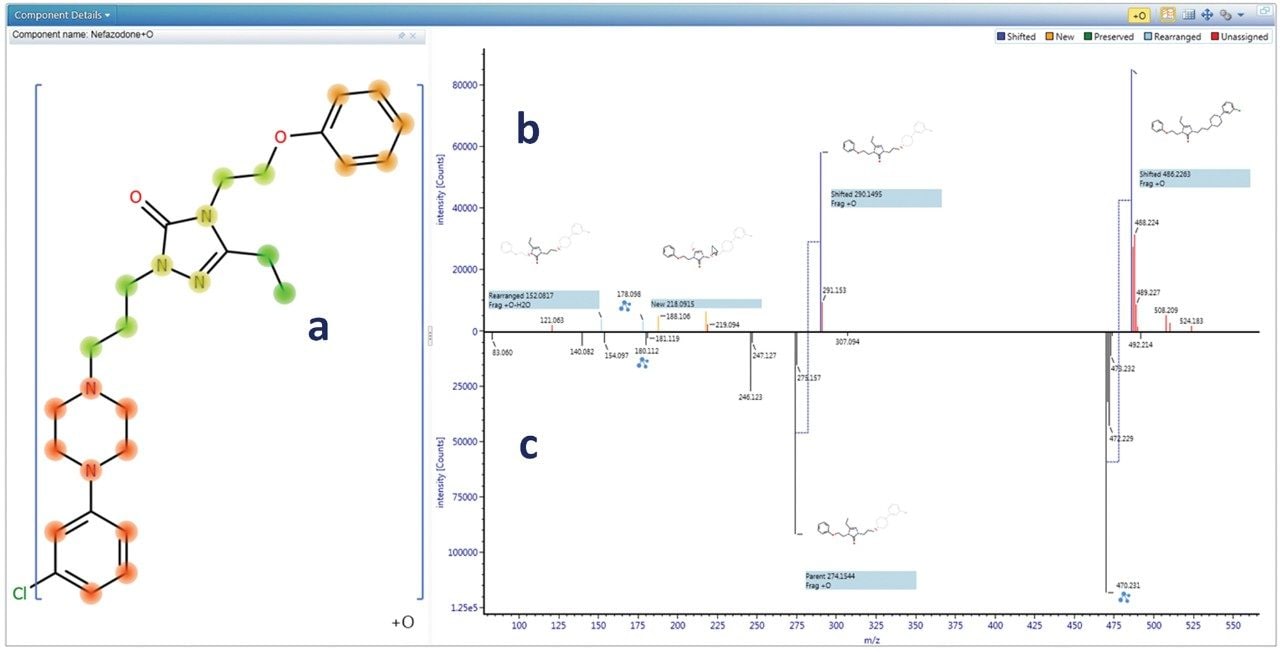
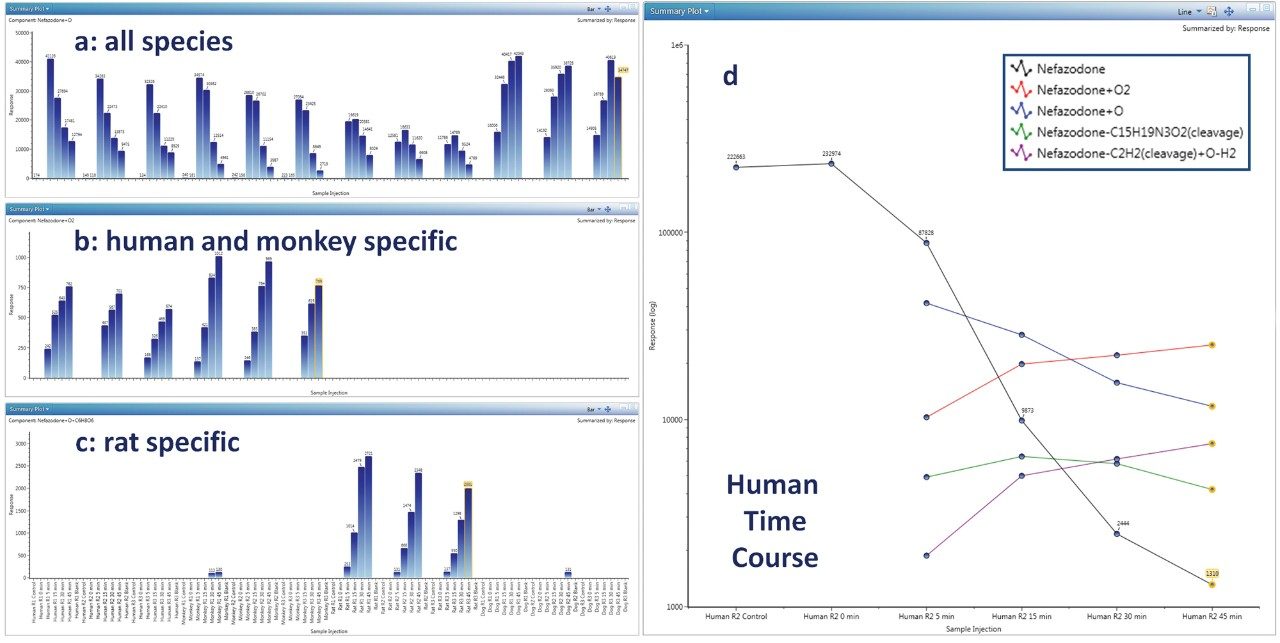
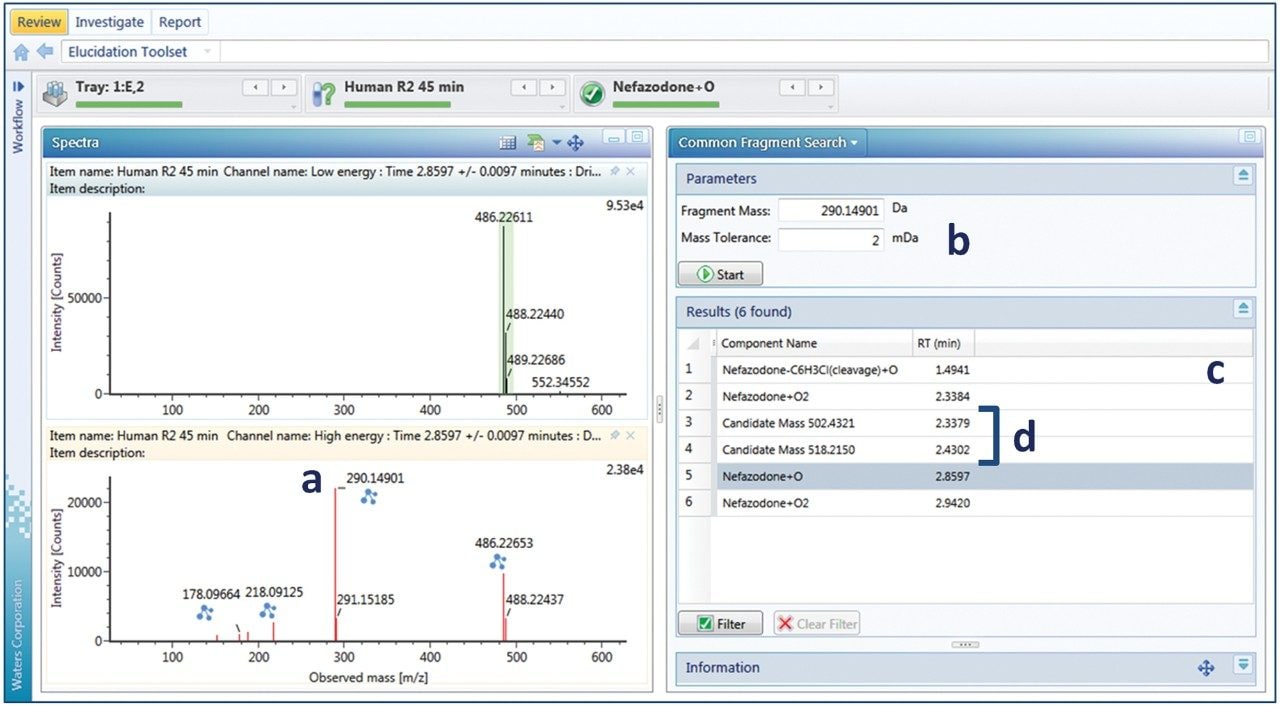
This application note outlines the use of integrated quantitative and qualitative processing for managing multispecies studies. UNIFI enables advanced features such as: flexible viewing of samples/species/time data; trend plot tools for visualizing studies; use of scientific libraries to store and retrieve identified compounds; and comprehensive tools for analyzing unknowns and characterizing metabolites and impurities.
Nefazodone (10 µM) was incubated (in triplicate) with cryopreserved rat, dog, cynomolgus monkey, and human hepatocytes at 37 ˚C for 0, 5, 15, 30, and 45 minutes. Incubations were terminated by addition of an equal volume of ice cold acetonitrile, centrifuged, and aliquots of the supernatant submitted for analysis.
System: |
ACQUITY UPLC I-Class with FTN |
Column: |
ACQUITY UPLC HSS T3 2.1 x 100 mm, 1.8 μm (P/N 186003539) |
Run time: |
4 min |
Vials: |
Waters Maximum Recovery LCMS Certified (P/N 600000670CV) |
Column temp.: |
45 °C |
Sample temp.: |
8 °C |
Injection volume: |
1 μL |
Flow rate: |
0.6 mL/min |
Mobile phase A: |
Water + 0.1% formic acid |
Mobile phase B: |
Acetonitrile + 0.1% formic acid |
Time |
%A |
%B |
Curve |
---|---|---|---|
0 |
98 |
2 |
– |
4 |
40 |
60 |
6 |
4.5 |
0 |
100 |
6 |
5 |
98 |
2 |
11 |
MS system: |
Vion IMS QTof |
Ionization mode: |
ESI+ |
Acquisition mode: |
HDMSE 0.1 Hz |
Source temp.: |
120 °C |
Desolvation temp.: |
450 °C |
Desolvation gas: |
800 L/hr |
Capillary voltage: |
1.0 kV |
Cone voltage: |
40 V |
Reference mass: |
Leucine enkephalin [M+H]+ m/z 556.2765 |
The core workflow is comprised of eight standardized steps (Table 1). It is fully customizable and each assay-specific workflow can be saved and shared between users. More information on workflows and application media may also be found at marketplace.waters.com. Metabolite review, biotransformation localization, and trendplot are discussed in this application note in detail.
The UNIFI Scientific Library was used to upload the structures of drug molecules prior to analysis. The metabolite review step shows all peaks that match m/z of predicted metabolites, along with a chromatogram and spectral view for the currently selected drug or metabolite (Figure 1). All other metabolites were reviewed by navigating down the component summary list.
The biotransformation was localized to the smallest sub structure, which still contains the modification, by rapidly reviewing all of the fragmentation data. Figure 2 shows the biotransformation localization for a hydroxylated nefazodone metabolite. The software utilizes all identified fragments and neutral losses, and automatically compares to fragments observed for the parent compound to assess the biotransformation hot spots.
Determination of preclinical species suitable for studying human metabolism is a critical function and requires collation and comparison of many metabolites across many experimental data points. Figure 3 (a,b,c) shows several ways to display and track metabolites across all species, times, and replicates: 3a shows a metabolite present in all preclinical species (nefazodone +O); 3b shows one which is human/monkey specific (+2O) and; 3c shows a metabolite that is rat specific (+O+Glucuronidation). Cross sample data may be plotted in a number of ways including bar, line, or line overlay with linear or log scaling. Figure 3d shows a (log scale) pharmacokinetic profile (0–45 min) for nefazodone in human hepatocytes overlaid with the formation of major metabolites. Full quan/qual support is built in, enabling precise absolute quantification of parent compound, as well as relative or semi quantification of metabolites (assuming that parents and metabolites have comparable response factors). Quantification using UV or analog traces are also supported (PDA and/or eSAT/IN required, not shown).
Once targets are known, dedicated Tof quantification workflows are also available, which can speed up processing for large datasets where only quantitative outcomes are required. Quantitative workflows are available for full scan modes, MS/MS as well as Tof MRM methods.2
For peaks where additional scrutiny is required, data may be further analyzed using a number of investigative tools. Elucidation toolset provides functionality, which can be used to manually interrogate and assign unknown peaks (or candidates). One of these tools is common fragment search, which is facilitated through the use of DIA acquisition approaches (MSE or HDMSE). Figure 4 shows an example of how to find related metabolites using the common fragment search tool. A fragment pattern is selected (typically the parent molecule or any identified metabolite) to look for related compounds. Figure 4b shows the fragment pattern for the major oxidative metabolite (nefazodone +O). The major fragment ion for this peak is the hydroxylated fragment ion at m/z 290 (+16 to the 274 nefazodone parent ion,) which is screened for (Figure 4b). Several related metabolites were observed and four metabolites that also contain the same diagnostic fragment are shown in Figure 4c. In this example, one related cleavage product, dihydroxylation product and at least two related glucuronidative species (detected ions at m/z 502 and 518, Figure 4d) can be readily identified. Using this information, the method was reoptimized to screen for additional glucuronidative and multiple oxidation pathways. Common fragment ions (and neutral losses) may also be searched for directly in a routine analysis, enabling full screening of drug-related (and pathway-related, such as glucuronidation) components. New, unique metabolites, once identified, can also be easily added to the library to be screened for in future studies.
Metabolites were reported using the built-in standard metabolite reporting template, which includes metabolites found with supporting isotopic, mass accuracy, biotransformation localization, chromatographic, and spectral data (Figure 5a). Customized reports can also be created to include any additional information required by application or departmental needs. This can include experimental data and metadata, such as methods, tables, figures, data, custom calculations, filters, and also logos and other custom elements (Figure 5b). Reports are available for review and sign off, and can be accessed electronically on a restricted user/manager-based log in (optional). If needed, the user can automatically export any table, graphic, or text for easy integration with existing platforms (MS Office/Adobe) using the extraction method tools.
Ion mobility typically requires additional (and often poorly integrated) software to leverage ion mobility or Collision Cross Section (CCS) information. With UNIFI and Vion IMS QTof, the process is fully integrated and CCS values are automatically calculated for all ions and metabolites as part of the routine application workflows. Ion mobility system calibrations are also automatically performed as part of the simplified instrument setup routine.
CCS and ion mobility enables the use of an additional distinguishing identifying property beyond m/z and mass resolution to help discriminate and track metabolites across multiple samples, matrices, and chromatography.3,4 Vion enables generation of the highest quality spectral data and routine calculation of CCS values for all ions present in samples.
Data was collected, processed, and reported on a compliant platform enabling both GLP and non-GLP flexibility for projects and/or reporting. The UNIFI Scientific Information System has been built to securely capture and store not only data, but also methods, measurements, structures, identifications, figures, tables, and reports – all of the information gathered during the study. UNIFI is designed to operate in a stand alone or networked environment, enabling the instruments to continue collecting data, while acquired datasets are automatically moved, processed, and accessed via more powerful computing infrastructure. This eliminates the need for users to manage multiple copies of data. Instruments can also be managed on a network from any client on the network. This enables better utilization of both lab instrument acquisition time and powerful processing computers/servers.
Detailed and thorough workflows for identification and characterization for complex multispecies data sets were demonstrated. Trends and pharmacokinetic profiles for multiple metabolites were evaluated, which enabled confirmation of human metabolites in preclinical species.
UNIFI provides a comprehensive solution for studying drug metabolism in detail. All workflows were capable of processing both MS and IMS data for routine screening and metabolite identification. Flexible future proof options are also available to access large molecule and quantitative HRMS workflows on a single platform.
720006106, October 2017