This application note investigates the metabotyping of human urine by integrating IMS with gradient reversed-phase UPLC as a means of enhancing “peak recovery”.
The incorporation of ion mobility as a separation modality between LC separations and MS detection significantly increases the number of features detected in metabolic phenotyping.
The reason(s) for the observed increase in feature detection warrants further investigation but is most likely due to a combination of the separation of co-eluting compounds, noise reduction, resolution of isobaric components and separation of fragment ions. Therefore the incorporation of IMS with shorter LC gradient times may provide a means for the rapid profiling of large sample cohorts on metabonomics studies.
The use of metabolic phenotyping (metabonomics/metabolomics) to discover biomarkers of organismal response to environmental and physiological change is now widespread. In biomedical applications, metabolic phenotyping, or metabotyping,1,2 is being deployed as a method for finding novel, mechanistic, biomarkers of disease with obvious potential for improving diagnosis, patient stratification, and both predicting and monitoring patient response to therapy.
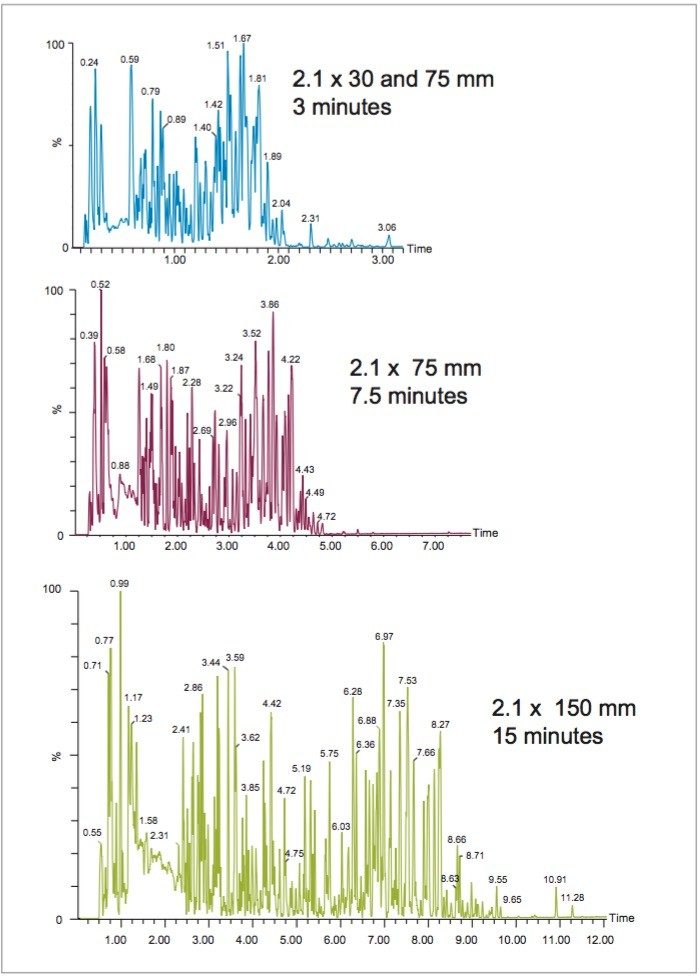
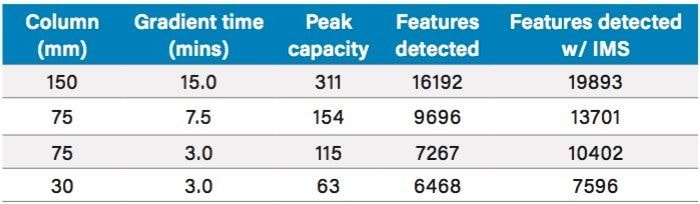
In liquid chromatography/mass spectrometry (LC-MS)-based phenotyping, the need for rapid and efficient high-throughput analysis often requires compromises to be made between speed and metabolome coverage. As the separation time is reduced to increase throughput, ion suppression (due to peaks co-elution) increases, reducing the number of features detected.3,4
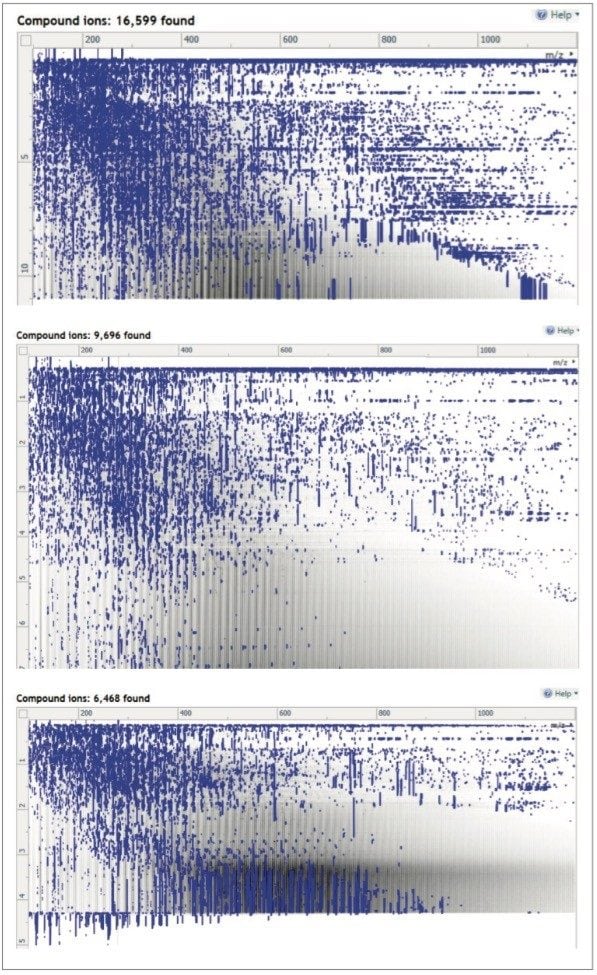
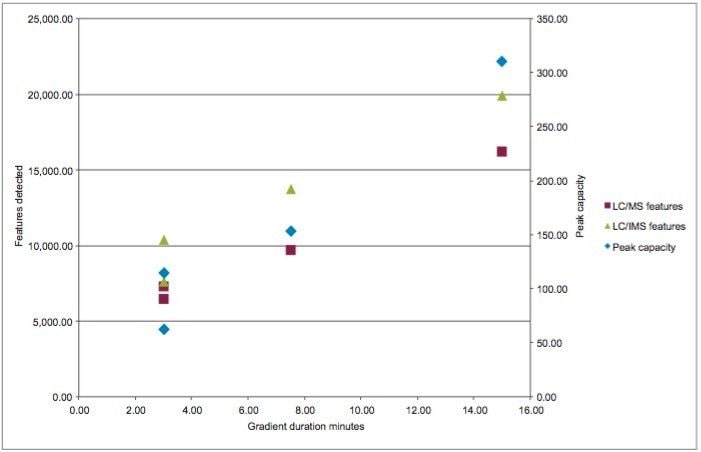
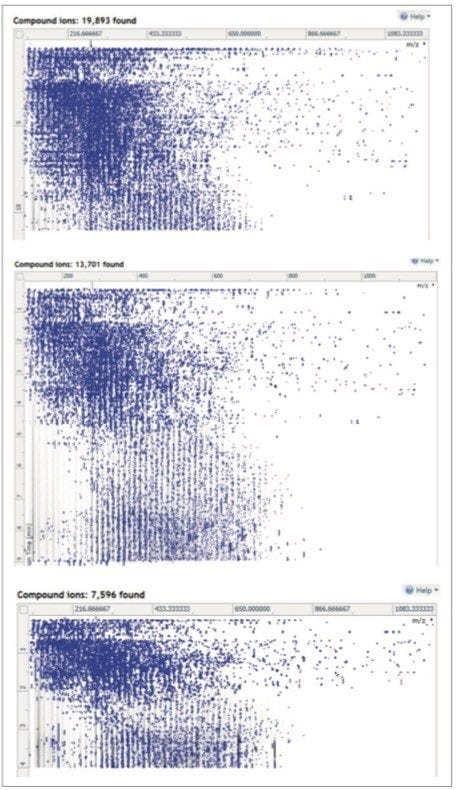
One potential means of maximizing metabolite detection without increasing analysis time is to employ ion mobility spectrometry (IMS) prior to MS detection in a hyphenated UPLC-IM-MS system. The ion mobility separation is performed post ionization in the vacuum region of the mass spectrometer and has a rapid time scale, typically in the 10s of milliseconds range. This makes such a configuration ideal for coupling between UPLC-based separations, with peaks eluting over a few seconds, and ToF mass spectrometry which operates on a microsecond time scale. The use of the collision cross-section (CCS) within the mass spectrometer allows analytes of interest to be separated and detected even in the presence of a co-eluting isobaric species. This orthogonal separation therefore provides an increase in peak capacity.
Here we describe the results of the investigation of the effect of integrating IMS with gradient reversed-phase UPLC as a means of enhancing “peak recovery” for the metabotyping of human urine.
LC system: |
ACQUITY UPLC I-Class |
Detection: |
MS |
Column: |
ACQUITY UPLC HSS T3 2.1 x 150 mm, 2.1 x 75 mm, or 2.1 x 30 mm |
Column temp.: |
40 °C |
Sample temp.: |
10 °C |
Injection volume : |
2 μL |
Flow rate: |
600 μL/min |
Mobile phase A: |
Aqueous formic acid (0.1% v/v) |
Mobile phase B: |
Acetonitrile, formic acid (0.1% v/v) |
MS system: |
Synapt G2-Si operating in MSE or HDMSE mode |
Ionization mode: |
ESI positive ion |
Acquisition range: |
100–1200 m/z |
Capillary voltage: |
2.5 kV |
Collision energy: |
5–40 eV |
Cone voltage: |
30 V |
MassLynx Software with Progenesis QI Software
Column length and gradient duration: |
|
150 mm column: |
Initial hold at 2% B for 1 minute followed by a linear gradient of 2–15% B over 3 minutes; raise to 50% B at 9.0 minutes; raise to 95% at 15 minutes; hold for 1 minute and return to initial conditions. |
75 mm column: |
Initial hold at 2% B for 0.5 minute followed by a linear gradient of 2–15% B over 1.5 minutes; raise to 50% B at 4.5 minutes; raise to 95% at 7.5 minutes; hold for 1.0 minute and return to initial conditions. |
30 mm column: |
Initial hold at 2% B for 0.3 minute followed by a linear gradient of 2–15% B over 0.6 minutes; raise to 50% B at 2.2 minutes; raise to 95% at 3 minutes; hold for 1.0 minute and return to initial conditions. |
In addition, a further analysis was run at accelerated linear velocity of 800 μL/min on the 75 mm column length under the following gradient conditions: |
|
75 mm column: |
Initial hold at 2% B for 0.3 minutes followed by a linear gradient of 2–15% B over 0.6 minutes; raise to 50% B at 2.2 minutes; raise to 95% at 3 minutes; hold for 1.0 minute and return to initial conditions. |
Human urine was collected and immediately frozen at -80 °C. Aliquots were then prepared by diluting 1:4 with water followed by centrifugation at 15,000 relative centrifugal force (RCF) for 5 minutes. The supernatant was then collected for injection onto the LC-MS system.
In this study, the effect of LC column length and gradient duration on feature detection in metabonomics study was first determined using human urine from 6 volunteers. Chromatographic analysis of the urine using a 15 cm length column enabled the detection of over 16,000 features (Table 1) in positive ion electrospray ionization (ESI) mode (Figure 1). The base peak ion (BPI) chromatogram of the urine analysis shows that the component peaks were well distributed across the first 10 min of the analysis.
The relationship between the number of features detected and the chromatographic conditions, with respect to column length and gradient duration, was then investigated by analyzing the urine sample using 150, 75, and 30 mm columns with solvent gradients from 2 to 95% acetonitrile of 15, 7.5, and 3-minutes duration respectively (Table 1 and Figures 2 and 3). The use of these chromatographic conditions meant that the separations were scaled directly so as to ensure that the number of column volumes defining the gradient, in this instance 34, remained constant for each column. Peak capacity is defined here as the theoretical number of chromatographic peaks that can be baseline-resolved during the gradient duration. The peak capacity of the separations thus ranged from 311 (average peak width 2.9 secs) when using the 150 mm column and its corresponding 15-minute gradient, to 154 (average peak width 2.9 secs) with the 75 mm column and 7.5 minute gradient, to 115 (average peak width 2.5 secs) with the 75 mm column and 3 minute gradient, and to 63 (average peak width 2.0 secs) with the 30 mm column and 3 minute gradient.
The number of features detected in the urine sample varied depending on the length of the column and corresponding analysis time (Table 1 and Figure 3). Thus from the maximum observed number of approximately 16,000 features observed for the longer 15-minute separation performed on the 150 mm length column, the number fell to 9,600 with the 75 mm column and 7.5-minute gradient and to almost 8,000 in the case of the 30 mm column and 3-minute separation (Table 1 and Figure 1–3). These data show that despite reducing the column length and gradient duration it was still possible to obtain feature rich analysis in a half or one third of the time, thus improving throughput. These finding are consistent with previous reports.4,5
The use of IMS integrated into the UPLC-MS system offers the opportunity to provide an extra dimension of separation to the analysis process allowing for the resolution of co-eluting analytes based on their ion mobility.6 The chromatographic analysis of human urine described above was repeated with IMS incorporated before the collision cell in the Synapt G2-Si Mass Spectrometer. The data obtained is summarized in Table 1 and Figures 3 and 4.
The UPLC-IM-MS analysis produced between a 25 and 40% increase in the number features detected in the urine analysis compared to UPLC-MS alone. Thus, the 15-minute separation on the 150 mm column, when performed with IMS, yielded nearly 20,000 features compared to the ca. 16,000 without IMS. Similarly, the 7.5-minute analysis on the 75 mm column resulted in an increase in the number of features detected from ca. 10,000 to nearly 14,000, and the 3-minute separation on the 3 mm column, showed an increase in features from ca. 6,500 to ca. 7,600 (Table 1).
The data obtained indicated that by employing ion mobility in the mass spectrometry process prior to the time-of-flight tube, the number of features detected was increased by 23, 41, and 17% for the 15, 7.5, and 3 minute separations on the 150, 75, and 30 mm columns respectively.
The observed increase in the features detected is therefore most likely attributable to the separation of co-eluting compounds and resolution of isobaric features (or have virtually identical m/z values). Comparison of the peak density maps for the UPLC-MS and UPLC-IM-MS data shown in Figures 2 and 4 clearly indicates that the UPLC-IM-MS data (Figure 4) had significantly less noise in the peak density maps compared to those for the conventional UPLC-MS analysis (Figure 2). This suggests that a significant reason for the greater number of detected peaks is due to the reduction in extraneous noise and hence easier detection of “true” analyte peaks.
As shown here, the incorporation of ion mobility as a separation modality between LC separations and MS detection significantly increases the number of features detected in metabolic phenotyping. The increase in the number of features detected varied from 41% for the 7.5-minute analysis to 17% for the 3-minute analysis, and even with the longer 15-minute separation the number of features detected was increased by 23%. The reason(s) for the observed increase in feature detection warrants further investigation but is most likely due to a combination of the separation of co-eluting compounds, noise reduction, resolution of isobaric components and separation of fragment ions. Therefore the incorporation of IMS with shorter LC gradient times may provide a means for the rapid profiling of large sample cohorts on metabonomics studies.
720005933, March 2017