For research use only. Not for use in diagnostic procedures.
This is an Application Brief and does not contain a detailed Experimental section.
This application brief shows that the CORTECS UPLC T3 Column possesses a unique selectivity that makes it ideal for the analysis of CoQ10 in plasma.
The CORTECS UPLC T3 Column possesses a unique selectivity that makes it ideal for the analysis of CoQ10 in plasma.
Coenzyme Q10 (CoQ10; Figure 1) is a ubiquitous lipid soluble molecule that is a key component of the mitochondrial electron transport chain and is necessary for ATP synthesis. It also can act as an important antioxidant.1-3 CoQ10 deficiency has been associated with many diseases including neurologic disorders,4 but is of particular interest as a cardioprotective molecule. Deficiencies in CoQ10 have been associated with heart failure and supplementation with CoQ10 has been found to improve cardiac function.5 Because of this, there is an ongoing interest in the quantification of CoQ10 in human plasma.
From an analytical standpoint, CoQ10 tends to be found at relatively high concentrations in plasma and can often be readily detected by non-specific HPLC detection methods such as electrochemical detection or UV detection. While this can be an advantage for research laboratories that may have limited mass spectrometry capabilities, it does mean that chromatography becomes critical, as CoQ10 must be adequately separated from endogenous interferences in order to achieve accurate and reproducible quantification.
CoQ10 was analyzed under isocratic mobile phase conditions consisting of 20% IPA (mobile phase A) and 80% ACN containing 0.1% formic acid (mobile phase B). A Waters ACQUITY UPLC I-Class System was used for solvent delivery at a flow rate of 0.6 mL/min. Less IPA resulted in retention times that were excessively long, while more IPA resulted in compressed retention times that made the separation of CoQ10 from endogenous interferences difficult. Detection was achieved with an ACQUITY UPLC PDA Detector at a wavelength of 275 nm. The newly developed CORTECS UPLC T3 Column demonstrated an ideal selectivity that enabled the baseline separation of CoQ10 from the endogenous interferences in plasma.
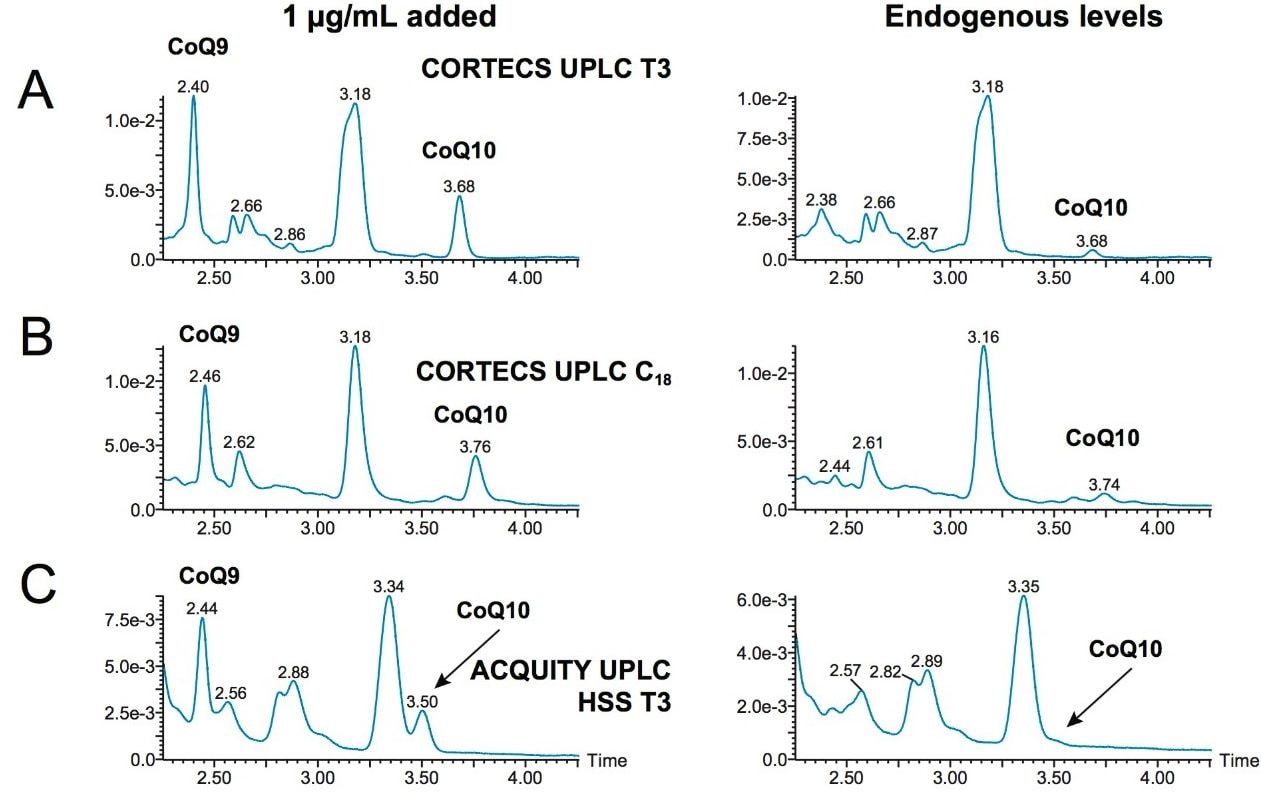
Figure 2A shows the chromatography of CoQ10 and CoQ9 (used as an internal retention time marker) from an extracted plasma sample on a CORTECS UPLC T3 Column (1.6 µm; 2.1 x 100 mm) (p/n 186008536). The left trace shows the chromatography of a plasma sample fortified with 1 µg/mL CoQ10 while the right trace is a blank plasma sample with endogenous CoQ10 highlighted. CoQ10 is well separated from the large interfering peak at 3.18 minutes and there are no interfering peaks in the region of CoQ10 at 3.68 minutes. The baseline is also flat, enabling accurate integration and quantification.
Other commonly employed, traditional columns were evaluated during the development of this method, but were unable to deliver the performance of the CORTECS UPLC T3 Column. The lower two traces in Figure 2 show CoQ10 chromatography with both a CORTECS UPLC C18 Column (Figure 2B) and an ACQUITY UPLC HSS T3 Column (Figure 2C). The CORTECS C18 Column is based upon the same solid-core particle as the column that was chosen, but with a traditional C18 functionality, rather than the T3 format. The HSS T3 Column has the same functionality as the CORTECS T3 Column, but is bonded to a fully porous high strength silica (HSS) particle. All of the columns evaluated had the same dimensions (2.1 x 100 mm).
Comparing performance, the left traces are from plasma samples fortified with 1 µg/mL CoQ10, and the right traces are from a non-fortified plasma sample and highlight the endogenous levels of CoQ10. The CORTECS UPLC C18 Column shown in Figure 2B is able to provide adequate separation from the large interfering peak at 3.18 minutes as the CORTECS UPLC T3 Column does. However, small interfering peaks are present at 3.6 and 3.88 minutes that can significantly impact the integration and quantification of CoQ10 at endogenous concentrations.
These details can be more clearly seen in Figures 3A and 3B, which enlarge the CoQ10 region of all chromatographs. A cleaner, improved baseline can also be seen when using the CORTECS UPLC T3 Column. In the case of the ACQUITY UPLC HSS T3 Column, CoQ10 is not baseline separated from the interfering peak at 3.34 minutes and is almost indistinguishable at its endogenous concentration in the unfortified sample (Figure 2C and Figure 3C), making accurate quantification extremely difficult, if not impossible. The combination of the CORTECS particle with the T3 functionality appears to be necessary for the unique separation shown in Figure 2A.
This work shows that the CORTECS UPLC T3 Column possesses a unique selectivity that makes it ideal for the analysis of CoQ10 in plasma. The combination of the CORTECS particle with the T3 functionality enables a separation that was unobtainable on either the ACQUITY UPLC HSS T3 Column or the CORTECS UPLC C18 Column. This enables the use of non-specific UV detection for the rapid analysis of this important molecule.
720005975, April 2017