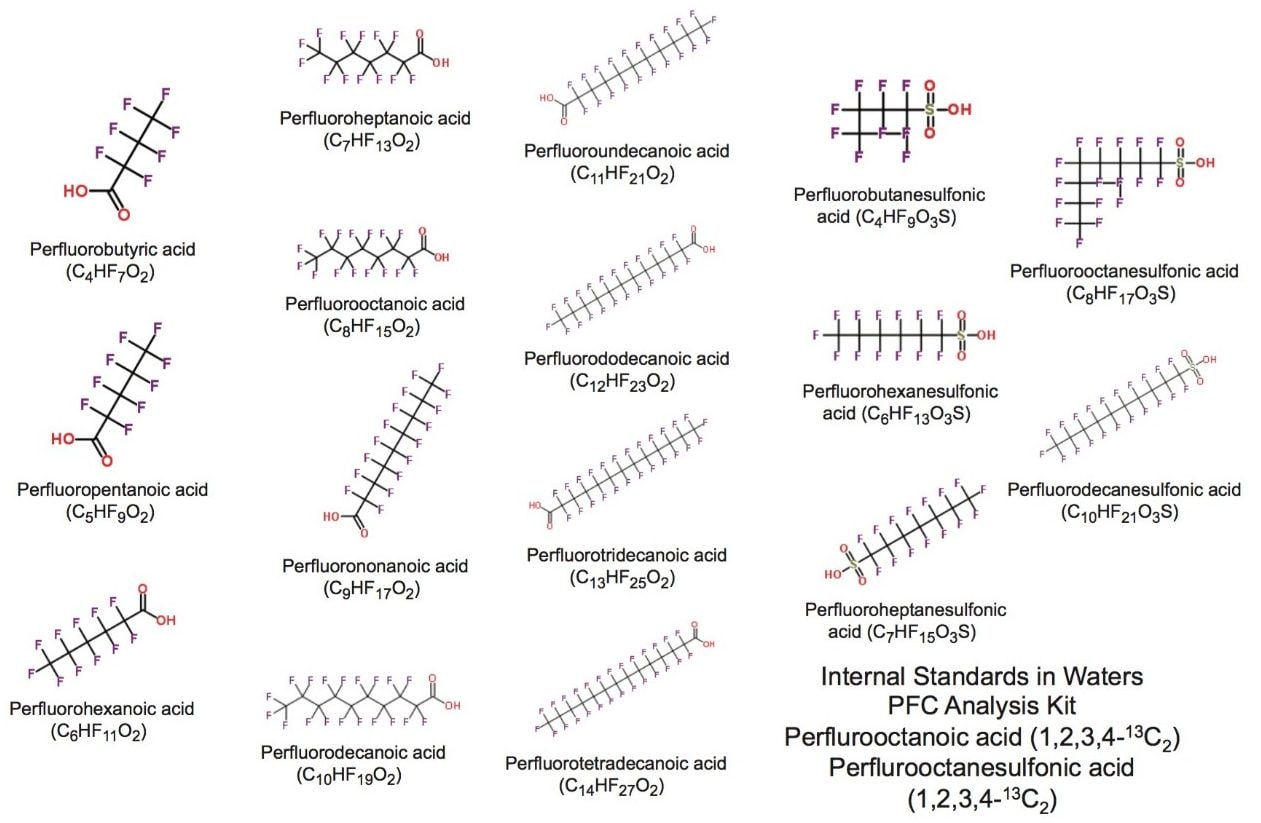
Perfluoroalkyl substances (PFASs) encompass a range of fully fluorinated alkyl compounds, typically with an anionic end group. These compounds have been implemented in a range of consumer goods and industrial processes due to their hydro- and lipo-phobic properties. As a result of their widespread use and subsequent leaching from materials, they have been found in various environmental and biological samples.
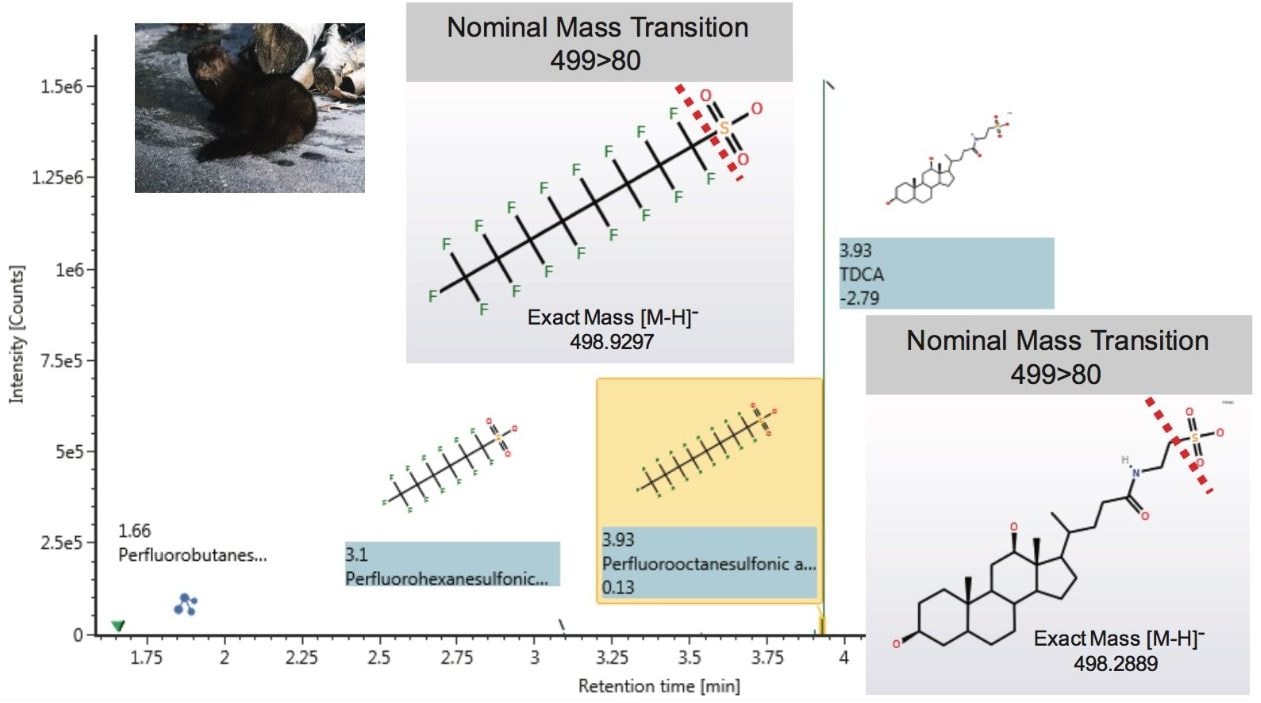
Concern that these compounds exhibit characteristics of persistent organic pollutants (POPs) has resulted in study and legislation against their use. For monitoring and research purposes, sub-ppb detection of these compounds is often required. Traditionally, this type of analysis has been performed using the selective MRM approach on a tandem quadrupole MS. However, the ability to identify other contaminants of concern post acquisition or matrix components such as co-extracted bile acids supports the use of high resolution mass spectrometry (HRMS).
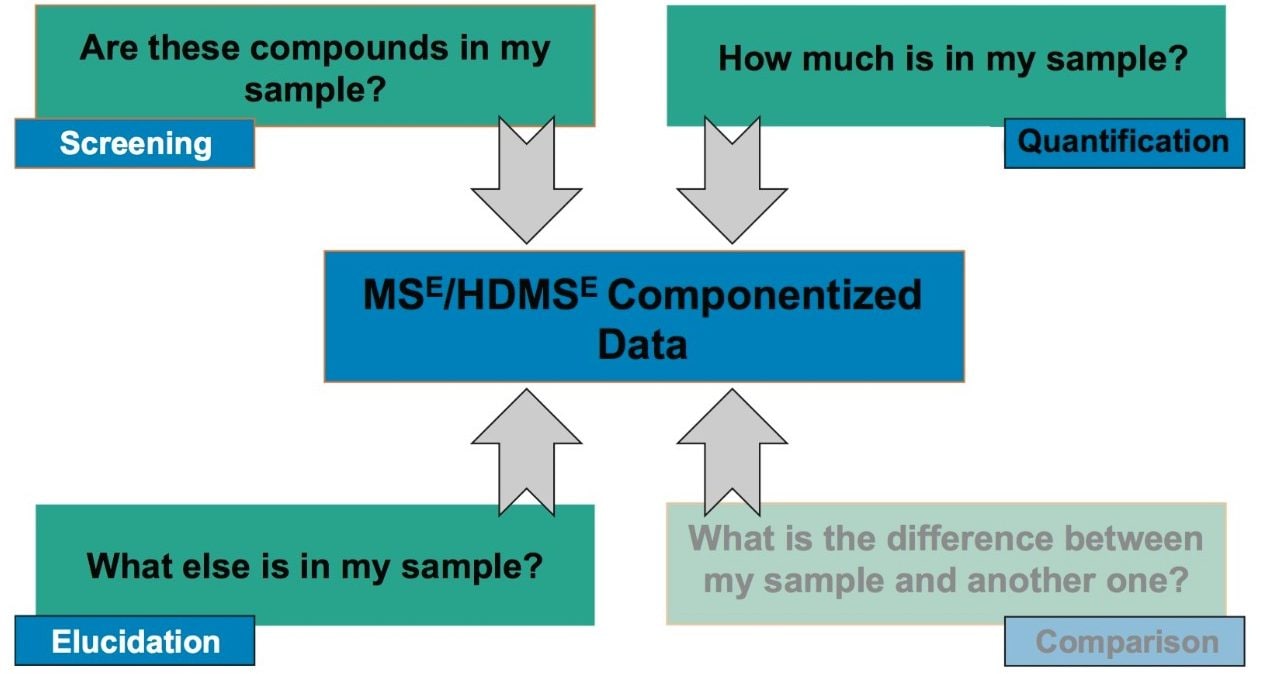
HRMS screening techniques can, in theory, monitor an unlimited number of targets at the same time as providing information to help discover unknown compounds or metabolites of interest. The ease of use and efficacy of a non-targeted, data independent, analysis type (MSE), coupled with a state-of-the-art scientific information system (UNIFI) for multi-analyte screening in environmental samples is demonstrated.
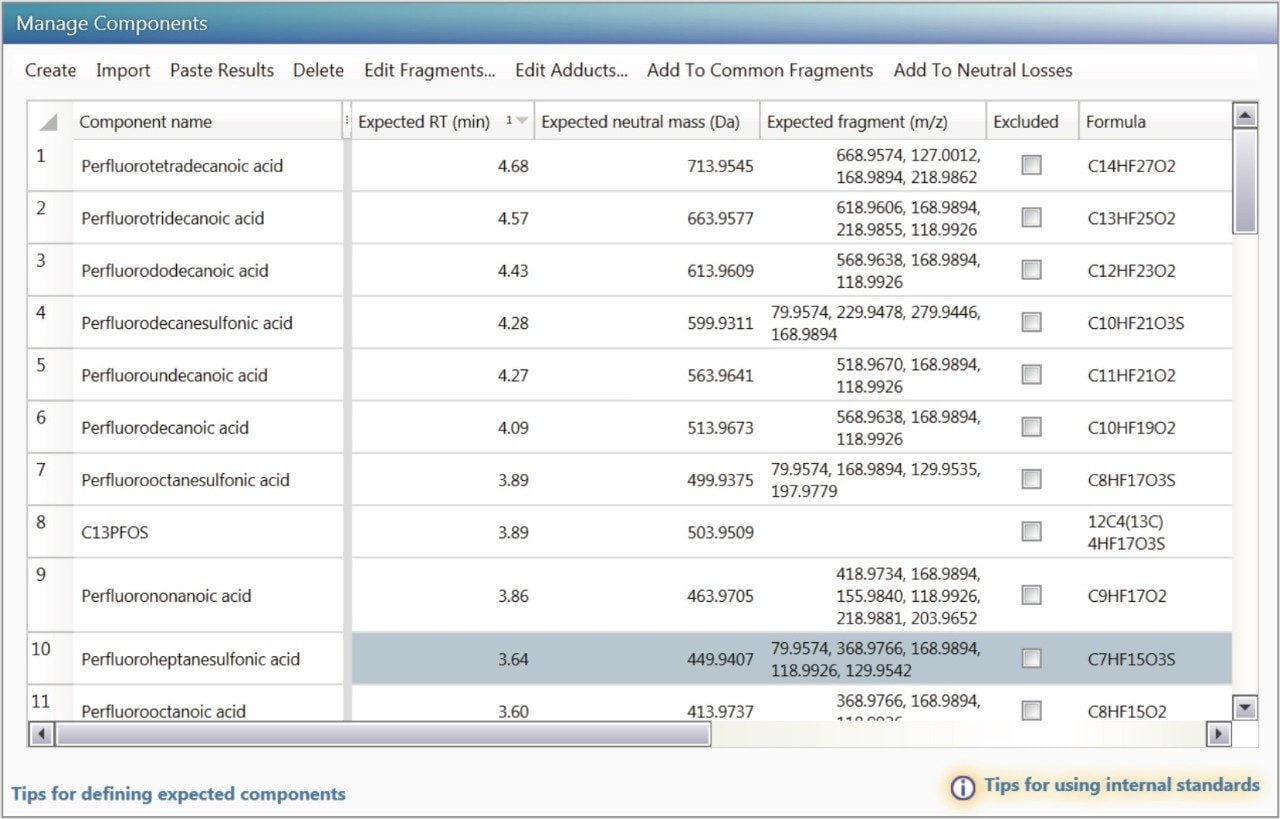
This approach was undertaken on an authentic sample analysis of mink liver for low level detection (ppb and sub-ppb) and quantification of identified PFASs. This particular application note will focus on introducing the novel way a user in a routine environment can customize data review within the scientific information system to establish an fast, concise, and consistent approach to reviewing HRMS data.