• Application Note

Method Transfer and Reliability of the ACQUITY Arc for Peptide Mapping

Method Transfer and Reliability of the ACQUITY Arc for Peptide Mapping

  • Brooke M. Koshel
  • Sean M. McCarthy
  • Waters Corporation

Abstract

This application note demonstrates the method equivalency of a peptide map method when transferred between LC platforms.

The ACQUITY Arc System has the ability to emulate legacy HPLC methods, but also allows HPLC methods to be updated to UHPLC methods with the use of Arc Multi-flow path technology. By updating an HPLC method to a UHPLC method and incorporating the ACQUITY QDa Detector, routine mass detection can be incorporated into analysis to aid in confirmation of results.

Benefits

  • Seamless method transfer of a peptide map from an Agilent 1100 Series HPLC System to the ACQUITY Arc System without changing method parameters
  • System-to-system reproducibility between different ACQUITY Arc Systems
  • Complementary mass detection data incorporated with routine workflow

Introduction

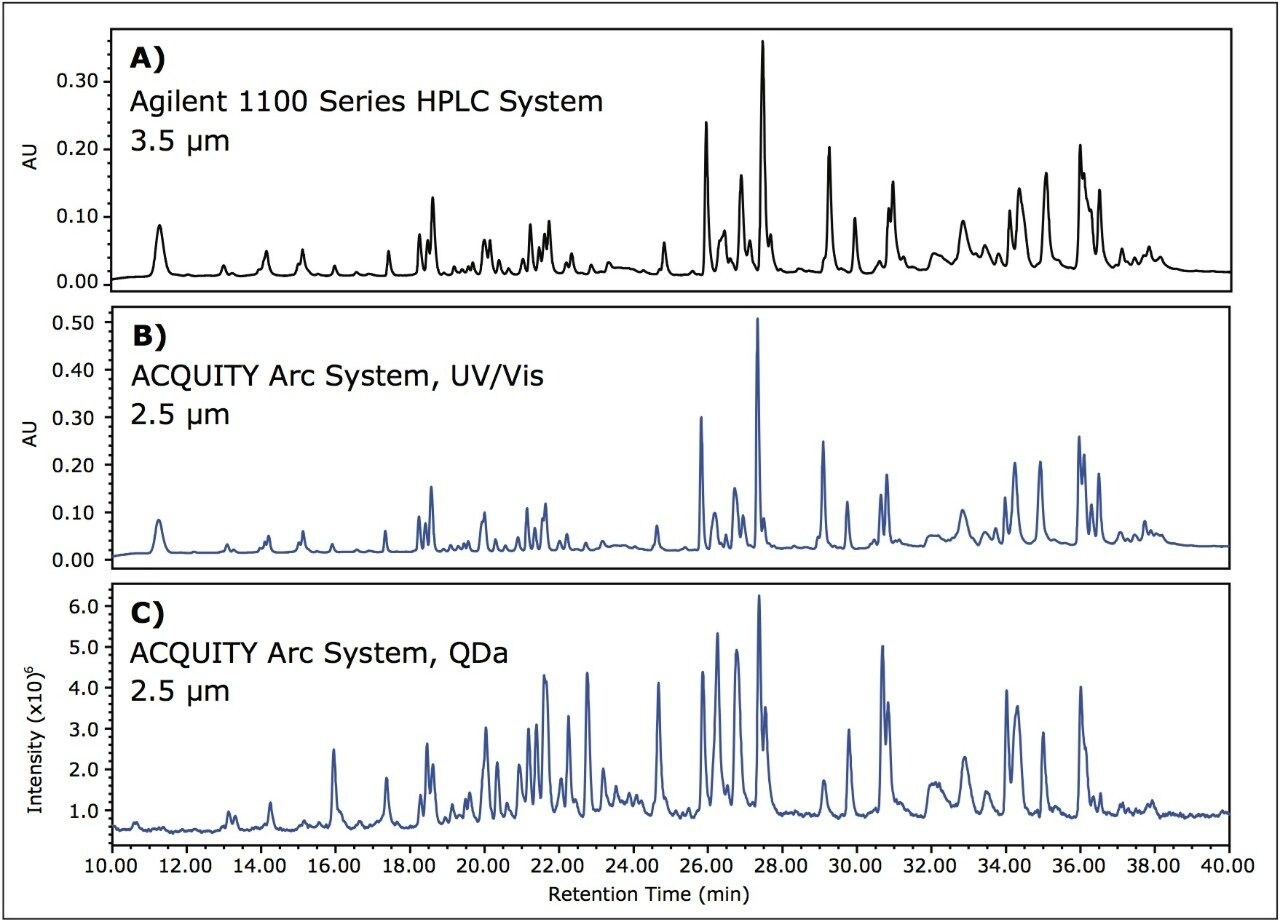
The ACQUITY Arc System was introduced as an LC platform meant to bridge the gap between HPLC and UPLC by enabling both HPLC and UHPLC separations to be run on a single platform. Arc Multi-flow path technology readily switches between Path 1 and Path 2 to allow seamless method transfer or improvements to existing methods. Previous work demonstrated the ease of use of the ACQUITY Arc System in transferring SEC-HPLC1 and CEX-HPLC2 methods for monoclonal antibody analysis. Both studies used Path 1 to emulate an HPLC separation, and both analyses showed near identical relative retention times, peak area percentages, and resolution between systems. The purpose of this application note is to demonstrate method equivalency of a peptide map method when transferred between LC platforms.

Peptide mapping has become a routine analysis in the biopharmaceutical industry, and is often used as a platform assay. Peptide maps are used to characterize the amino acid sequence of a protein in order to establish identity and characterize post-translational modifications. As products move towards commercialization, peptide maps are commonly used for batch release or to determine genetic stability once identity is established.3 Peptide maps are not considered a general method, but rather as an assay that must be developed for each unique protein.4 Each assay must consider both digestion and separation factors in an effort to yield a reproducible peptide map for enabling assessment of identity and critical quality attributes (CQAs) associated with stability, safety, and efficacy.

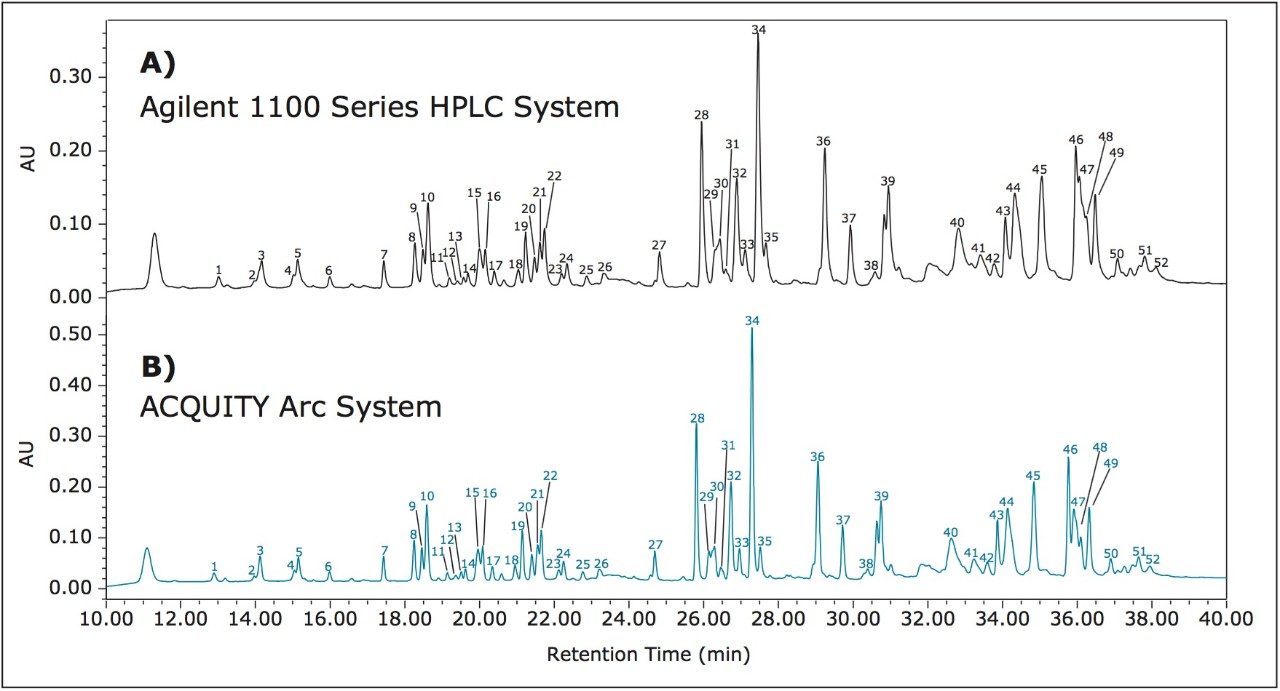
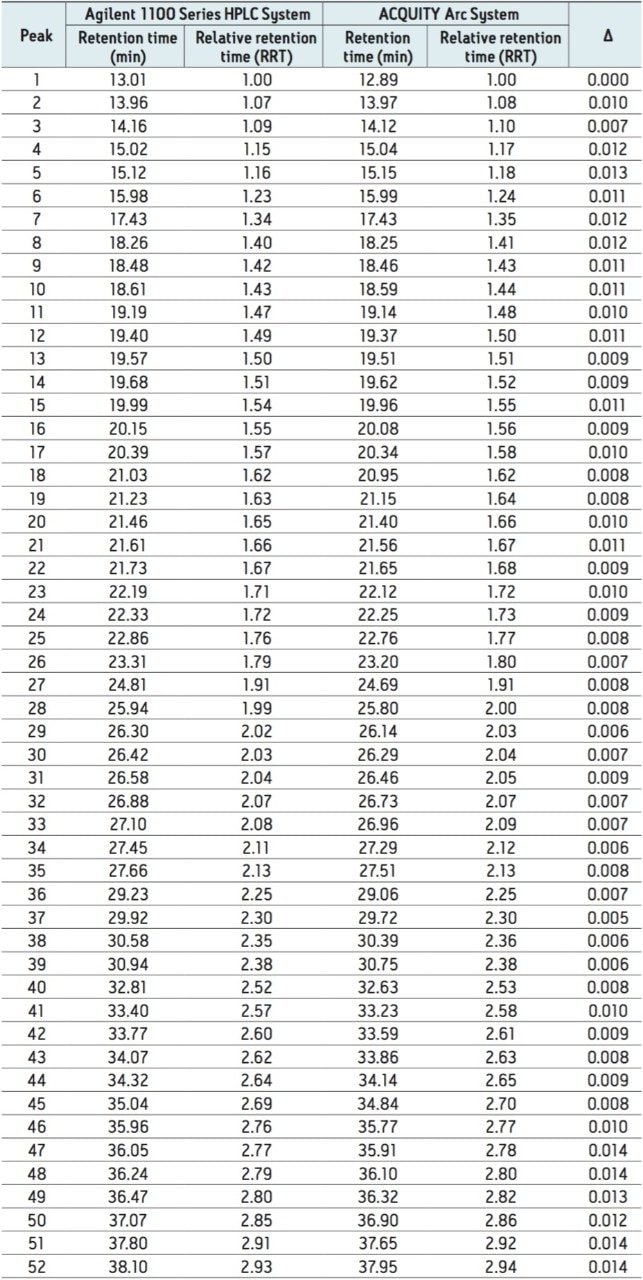
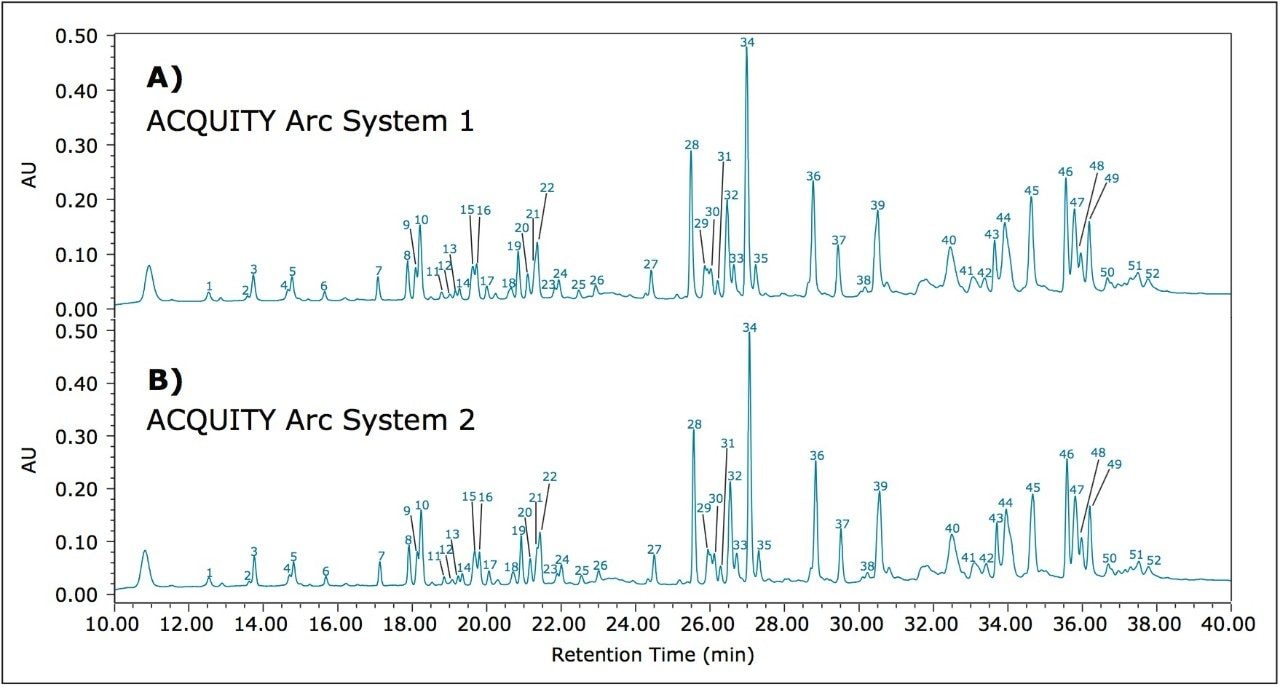
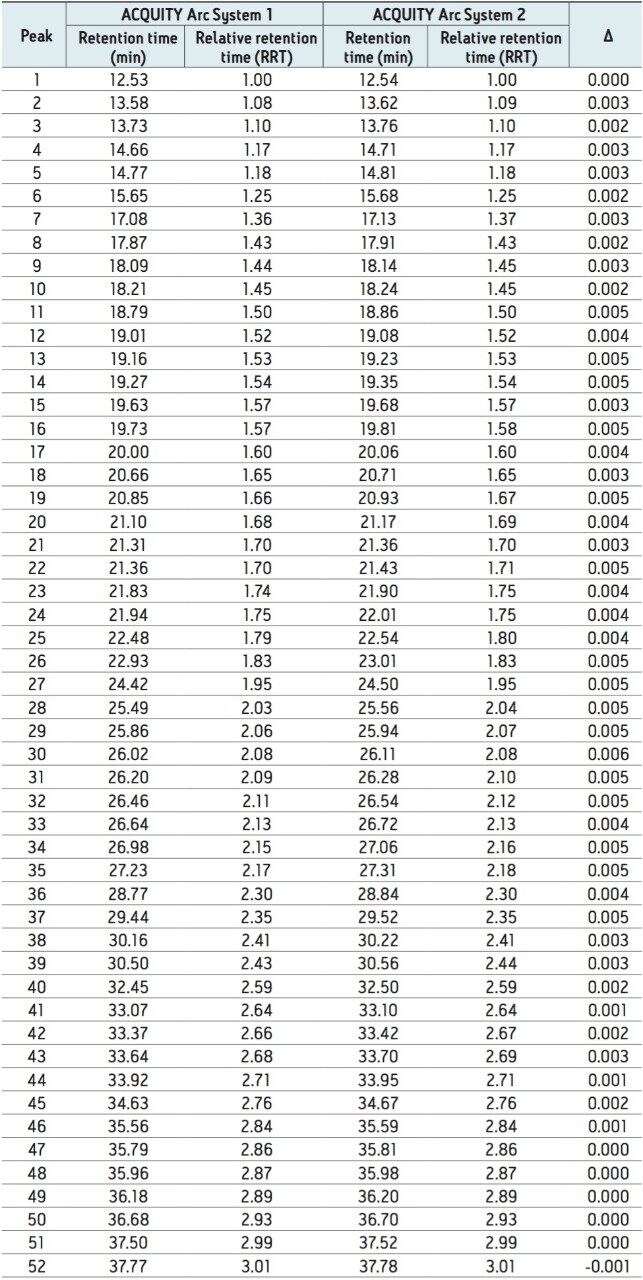
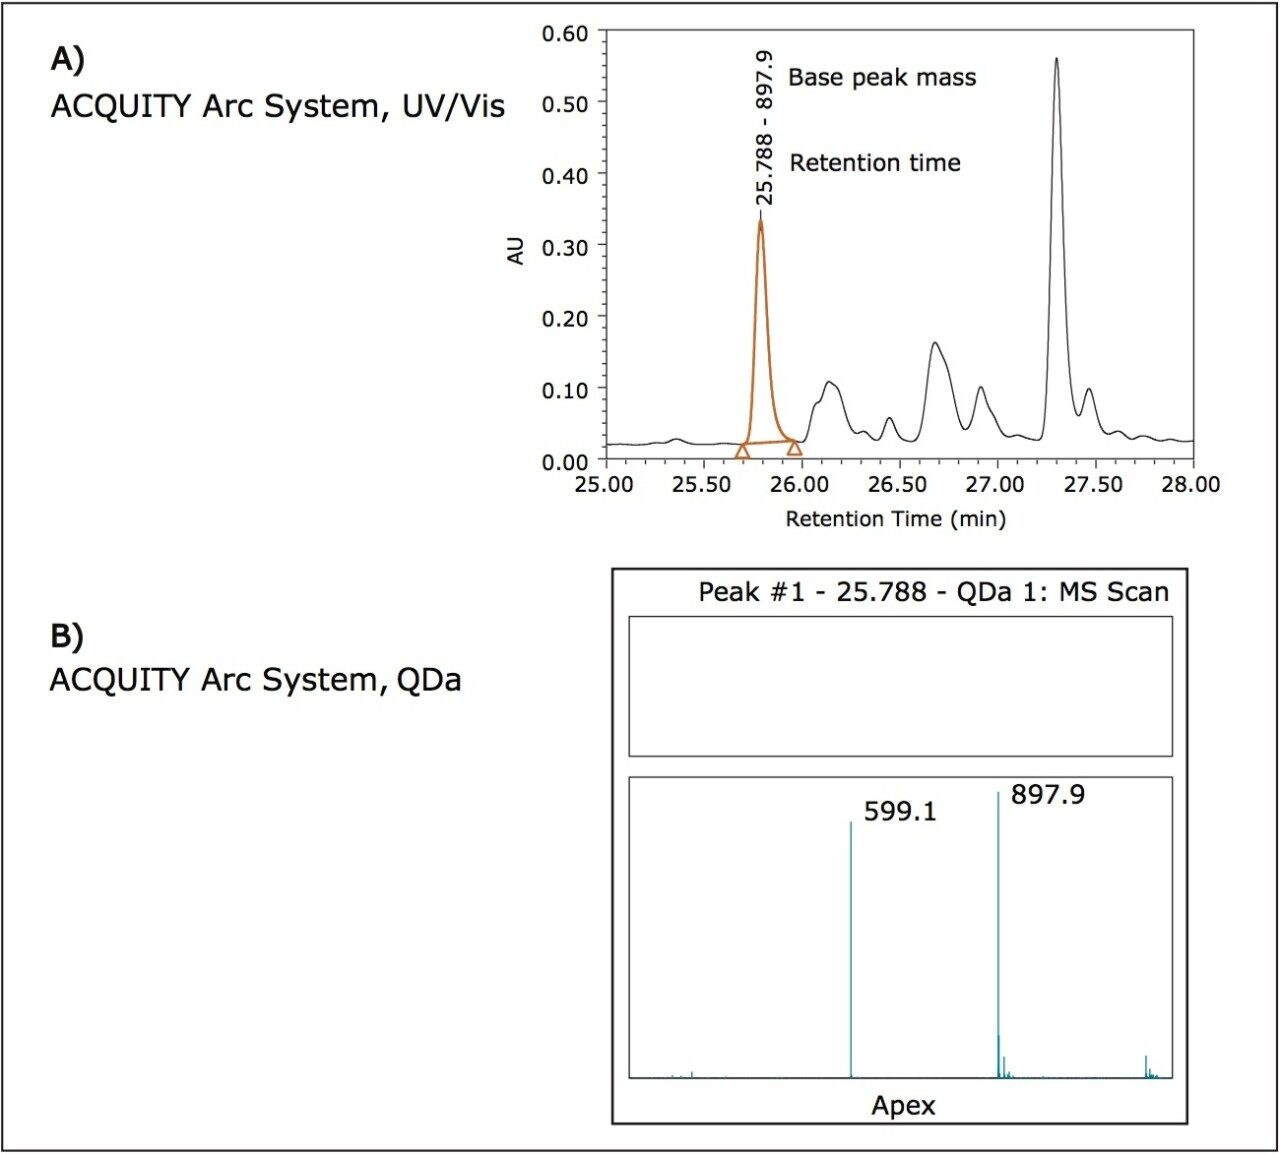
Because establishing a peptide map for a unique protein can be challenging, this application note uses a 60 minute general platform method to assess method transfer from an Agilent 1100 Series HPLC System to the ACQUITY Arc System. This same method is then used to address system-to-system variability by comparing results obtained from two different ACQUITY Arc Systems. Finally, an ACQUITY QDa Detector will be used in addition to optical detection to demonstrate how mass detection can be incorporated into analysis.

Experimental

Sample description

A 90-μL aliquot of infliximab at 10 mg/mL was reduced with dithiothreitol and alkylated with iodoacetamide. Samples were then digested with trypsin at a 1:20 enzyme to substrate ratio and incubated at 37 °C for 18 hours. Neat TFA was added to deactivate the trypsin. Digested samples had an estimated final concentration of 0.4 mg/mL and were injected without any further dilution.

LC conditions

LC systems:

ACQUITY Arc System with 2489 UV/Vis Detector and QDa Detector, flow path 1

Agilent 1100 Series HPLC System with quaternary pump and DAD detector

Extension loop:

100 μL

Absorption wavelength:

214 nm

Sample rate:

20 Hz

Columns:

XBridge BEH C18 130Å, 3.5 μm, 4.6 mm x 100 mm (P/N 186003033)

XBridge BEH C18 XP 130Å, 2.5 μm, 4.6 mm x 100 mm (P/N 186006039)

Column temp.:

40 °C

Mobile phase A:

H2O with 0.1% (v/v) TFA

Mobile phase B:

Acetonitrile with 0.1% (v/v) TFA

Sample temp.:

4 °C

Injection volume:

75 μL

Gradient:

Time(min)

Flow rate(mL/min)

%A

%B

%C

%D

Initial

0.500

95

5

0

0

5.00

0.500

95

5

0

0

45.00

0.500

50

50

0

0

47.50

0.500

5

95

0

0

52.50

0.500

5

95

0

0

52.60

0.500

95

5

0

0

60.00

0.500

95

5

0

0

QDa settings

Sample rate:

2 Hz

Mass range:

350 to 1250 Da

Cone voltage:

10 V

Capillary voltage:

1.5 kV

Probe temp.:

500 °C

Data management

Empower 3 CDS Software, SR2

Results and Discussion

HPLC peptide map shows method equivalency when transferred from an Agilent 1100 Series HPLC System to the ACQUITY Arc System

To assess method transfer of a peptide map method from an Agilent 1100 Series HPLC System to the ACQUITY Arc System, a peptide map of infliximab was generated using the method parameters described above. Based on a previous evaluation, an active preheater (CH-30A) was configured on the ACQUITY Arc System to ensure comparable temperature control between the two systems.5 The separation was first run on an Agilent 1100 Series HPLC System to establish a benchmark result (Figure 1A). The method was then transferred to the ACQUITY Arc System without any changes to the method parameters. The results showed a gradient offset equivalent to 185 μL between the two systems. Gradient SmartStart Technology6 was used to compensate for differences in dwell volume between the two systems and was applied post injection. This feature allows the gradient to be adjusted relative to the injection without making any changes to the gradient table. The resulting chromatogram produced by the ACQUITY Arc System can be seen in Figure 1B. The chromatograms generated from the two systems show good agreement with one another.

Comparison of infliximab peptide maps
Figure 1. Comparison of infliximab peptide maps acquired on an A) Agilent 1100 Series HPLC System and B) ACQUITY Arc System with gradient offset applied. Relative retention times were determined for all labeled peaks. Peak selection was determined by elution position and intensity. Relative retention times are calculated against Peak 1.

To further evaluate the comparability of results, retention time can be studied. Slight differences in retention time are seen between similar peaks and are reported in Table 1 for 52 peaks. When relative retention time is calculated, the difference between like peaks is negligible. By using Path 1 with Gradient SmartStart Technology, an HPLC methodwas successfully transferred to a modern LC platform without any changes made to the method.

Comparison of retention times of 52 peaks identified in Figure 1
Table 1. Comparison of retention times of 52 peaks identified in Figure 1 for an Agilent 1100 Series HPLC System and the ACQUITY Arc System. Gradient SmartStart Technology was used to account for differences in dwell volume between the two systems. The relative retention times resulting from the offset are almost indistinguishable from one another, as shown by the Δ values calculated.

ACQUITY Arc System shows system-to-system repeatability when comparing two systems

When a new instrument platform is deployed across a laboratory or to additional sites, it is important that results remain consistent. To compare results from different ACQUITY Arc Systems, the above method conditions were used to collect data from two different ACQUITY Arc Systems having the same core configuration. Both systems were configured with a 30-cm CH passive preheater. Mobile phase and samples were prepared for each system independently in an effort to simulate an industry environment where multiple analysts would be running samples across various laboratories. From Figure 2, the infliximab peptide maps from each of the systems are aligned. When assessing the difference in relative retention time between the two systems as reported in Table 2, the difference is no greater than 0.006. Acquiring nearly identical results on two different instruments of the same platform builds confidence in results.

Comparison of infliximab peptide maps
Figure 2. Comparison of infliximab peptide maps acquired on two different ACQUITY Arc Systems: A) ACQUITY Arc System 1 and B) ACQUITY Arc System 2. Relative retention times were determined for all labeled peaks. Peak selection was determined by elution position and intensity. Relative retention times are calculated against Peak 1.
 Comparison of retention times of 52 peaks identified in Figure 2
Table 2. Comparison of retention times of 52 peaks identified in Figure 2 for two different ACQUITY Arc Systems. Retention times show very little variation between systems. From the Δ values calculated, relative retention times are almost identical.

UHPLC peptide map data shows improved resolution, mass detection

Often times in routine peptide monitoring, optical detection alone is used to determine relativ  retention time and peak area of a sample and is related back to a reference standard to determine if suitability criteria are met. By introducing the ACQUITY QDa Detector as an orthogonal detection method, the resulting mass information can increase confidence when determining product consistency. To provide mass data for the peptide map method described above, the ACQUITY QDa Detector was used in series after optical detection. In doing this, columns packed with smaller diameter particles were used to take advantage of the capability of the ACQUITY Arc System to run both HPLC and UHPLC separations. In this example, the 3.5 μm column was replaced with a 2.5 μm column. Instead of scaling the method to a shorter run time to account for a change in particle size, the same 60 minute method was run in an effort to take advantage of greater resolution and higher peak capacity resulting from moving to smaller particle sizes.

In Figure 3A, the chromatogram obtained on the Agilent 1100 Series HPLC System for the 3.5 μm column is displayed for comparison purposes (see also: Figure 1A). Figure 3B shows results from the ACQUITY Arc System using the 2.5 μm column, and Figure 3C shows the corresponding mass response. In decreasing the particle size from 3.5 μm particles to 2.5 μm particles, small differences in resolution can be observed. A high degree of correlation exists between the UV/Vis data and the corresponding mass data, suggesting that the ACQUITY QDa Detector can be implemented with routine analysis.

Comparison of infliximab peptide maps
Figure 3. Comparison of infliximab peptide maps acquired on an A) Agilent 1100 Series HPLC System and B) ACQUITY Arc System with C) corresponding mass data acquired from an ACQUITY QDa Detector. Data collected on the Agilent 1100 Series HPLC System used an XBridge BEH C18 130 Å, 4.6 mm x 100 mm column packed with 3.5 μm particles, while data collected on the ACQUITY Arc System used an XBridge BEH C18 130 Å, 4.6 mm x 100 mm column packed with 2.5 μm particles. The corresponding mass data shows a high degree of correlation to the optical data.

The usefulness of the addition of the ACQUITY QDa Detector can be envisioned in a scenario where peaks have already been characterized and the additional mass data aids in identity confirmation for batch release or lot-to-lot comparisons. For example, consider the peptide given by the following sequence: ASQFVGSSIHWYQQR where the bold portion describes a complementary determining region (CDR) sequence. Using the average mass of the peptide, 1794.0 Da, the [M+1H],+1 [M+2H],+2 and [M+3H]+3 charge states can be calculated as 1795.0 Da, 898.0 Da, and 599.0 Da respectively. The integrated peak in the optical trace in Figure 4A shows corresponding mass data at the apex of the peak in Figure 4B. The ACQUITY QDa Detector was set to scan from 350 m/z to 1250 m/z, which is the maximum. From the mass data in Figure 4B, the charge states that fall within this scan range can be seen. In a laboratory environment where it is assumed that characterization would already have taken place, the additional mass data serves as confirmation of the desired product.

Zoomed-in region of infliximab peptide map
Figure 4. Zoomed-in region of infliximab peptide map from an ACQUITY Arc System showing A) optical data and B) corresponding mass data for the integrated peak in the optical trace. Data collected employed an XBridge BEH C18 130 Å, 4.6 mm x 100 mm column packed with 2.5 μm particles. The charge states indicated in B) match [M+1H]+1 and [M+2H]+2 values calculated for a peptide given by the following sequence: ASQFVGSSIHWYQQR where the bold portion represents a CDR sequence.

Conclusion

The biopharmaceutical industry acknowledges the need to adopt new technologies and methodologies by incorporating modern LC platforms such as the ACQUITY Arc System into laboratories. Because it has become commonplace to transition methods across an organization or to contract organizations, there is a need to demonstrate consistency of results across the same and different instrument platforms alike. The ACQUITY Arc System has the ability to emulate legacy HPLC methods, but also allows HPLC methods to be updated to UHPLC methods with the use of Arc Multi-flow path technology. By updating an HPLC method to a UHPLC method and incorporating the ACQUITY QDa Detector, routine mass detection can be incorporated into analysis to aid in confirmation of results.

References

  1. Koshel, B. M., McCarthy, S. M. Transfer of an SEC Method for Monoclonal Antibody Analysis from HPLC to UHPLC using the ACQUITY Arc System. 2015; 720005510en.
  2. Koshel, B. M., McCarthy, S. M. IEX Method Transfer: Replicating a Method for Monoclonal Antibody Analysis on an ACQUITY Arc System. 2015; 720005529en.
  3. Luo, Y. et al. Handbook of Modern Pharmaceutical Analysis. In Separation Science and Technology; Ahuja, S.; Scypinski, S., Ed.; Academic Press: Burlington, MA, 2010; Vol. 10; pp 283–359.
  4. U.S. Pharmacopeial Convention, General Chapter <1055> Biotechnology-Derived Articles- Peptide Mapping, USP38-NF33, Official from August 1, 2015.
  5. Hong, P., McConville, P. R. Method Transfer from Agilent 1100 Series LC System to the ACQUITY UPLC H-Class System: The Effect of Temperature. 2015; 720005204en.
  6. ACQUITY Arc System Brochure. Waters Brochure. 2015; 720005393en

720005588, January 2016

Back To Top Back To Top