This application note demonstrates the effects of solvent and analyte polarity as they relate to distorted peak profiles as well as offer general recommendations.
Peak distortion is often overlooked, but can be a major contributor to wide peaks and poor peak shape. Choosing the right injection solvent for UltraPerformance Convergence Chromatography (UPC2) and supercritical fluid chromatography (SFC) separations requires some consideration by the analyst.1,2 Here, peak distortion for a range of analyte polarities, represented as cLog P (calculated partition coefficient) is examined for chiral UPC2 separations. The columns used were ACQUITY UPC2 Trefoil Columns, which contain particles that have been coated with derivatized polysaccharides. The end result of the coating is a hydrophilic stationary phase affording separation of enantiomers. Since chiral separations of both polar and apolar species can be achieved in the same hydrophilic, chiral environment, choosing an appropriate injection solvent is important. There are many other factors which can lead to less than ideal peak shapes, such as secondary interactions between analytes and the stationary phase and a heterogeneous packed bed. The sample diluent can induce distorted elution bands when the local mobile phase equilibrium is disrupted. Here, we demonstrate the effects of solvent and analyte polarity as they relate to distorted peak profiles as well as offer general recommendations.
All samples were prepared at 0.4 g/L in the given injection solvents: methanol, isopropanol, and heptane. Where mixtures are noted, a concentrated stock solution was made and diluted to achieve the desired concentration of analyte and solvent mixture. Each analyte was dissolved and injected in methanol (MeOH), isopropanol (IPA), and heptane (or heptane/IPA mixture) at injection volumes of 1, 2, 4, 6, 7.5, and 9 μL.
LC system: |
ACQUITY UPC2 |
Detector: |
ACQUITY PDA |
Vials: |
TruView LCMS Certified |
Columns: |
2.1 x 150 mm, 2.5 μm, Trefoil AMY1 and CEL1 |
Column temp.: |
40 °C |
Sample temp.: |
10 °C |
Injection volume: |
1–9 μL |
Flow rate: |
1.2 mL/min |
Mobile phase A: |
CO2 |
Mobile phase B: |
50/50 MeOH/IPA + 20 mM NH3 |
Weak wash: |
IPA |
Strong wash: |
MeOH |
Wavelength: |
λ=220 nm; 350–450 nm λ compensated |
Sampling rate: |
20 Hz |
Empower 3 Chromatography Data Software
It is well known that thermal, viscosity, and eluent mismatches can cause strange peak profiles.3-7 As a best practice, dissolving and injecting a sample prepared in the exact same composition as the mobile phase (or initial mobile phase conditions of a gradient) is recommended. Unfortunately, dissolving and injecting a sample prepared in a supercritical fluid is difficult and very rarely done. Alternatively, an analyst could prepare a sample in a small extraction or dissolution vessel and use the compressed mobile phase to instantly dissolve and carry the sample to a column inlet. Extraction vessels have been used successfully on supercritical fluid extraction (SFE) and preparative SFC systems; however, it requires the sample be dissolved instantly and completely by the effluent, making broad implementation difficult. Those factors make choosing the right sample solvent or diluent paramount to achieving optimal peak profiles for routine analytical injections. It should also be noted that the Partial Loop with Needle Overfill (PLNO) method of injection used by ACQUITY UPC2 systems will also inject a small amount of ‘weak needle wash’, which is used to transfer the sample liquid from a vial to the injector loop. As the name implies, a weak eluent is necessary to prevent disruption of the injected sample band. The experiments performed in this application only address the effects of injection solvent and analyte polarity in chiral UPC2 separations. Sample loading was not a consideration and should be examined on a case-by-case basis.
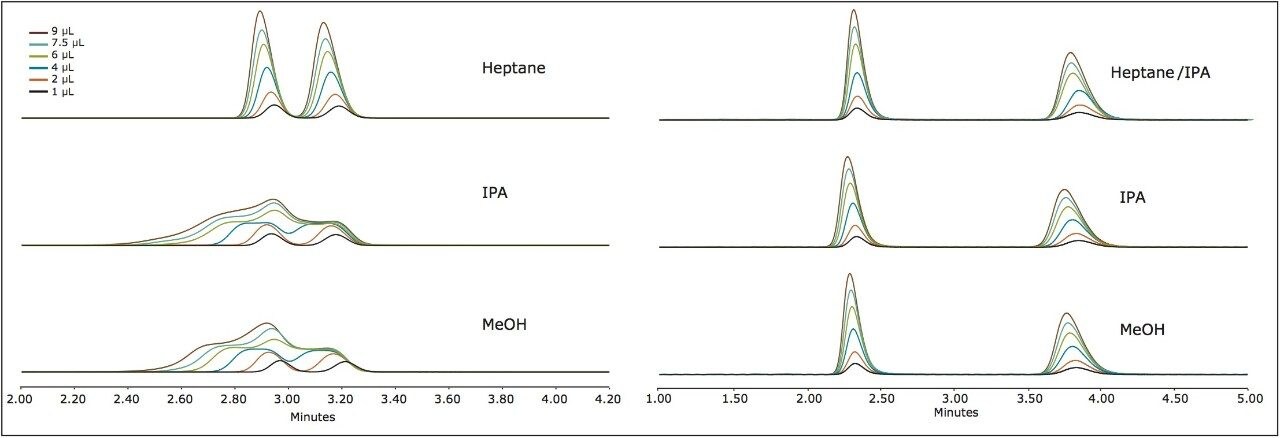
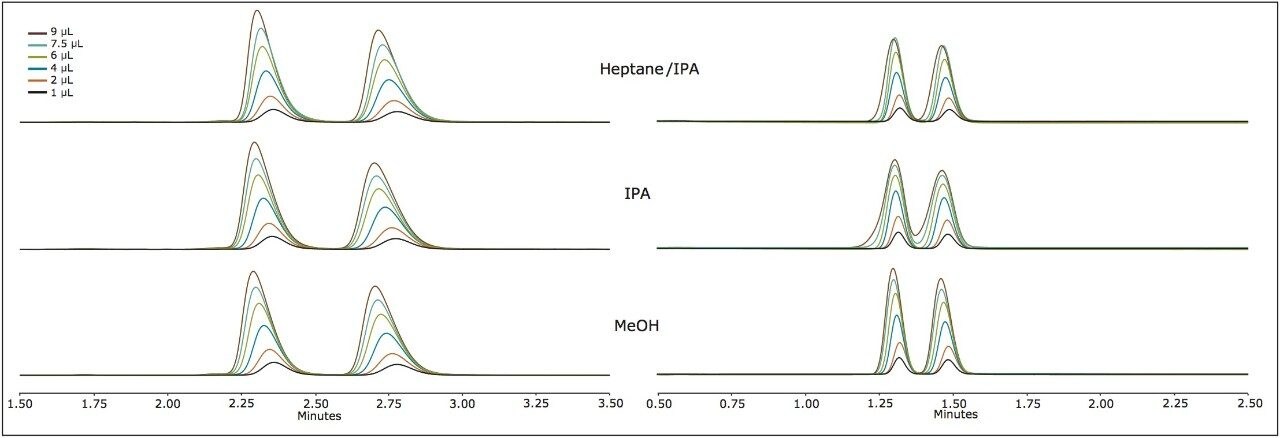
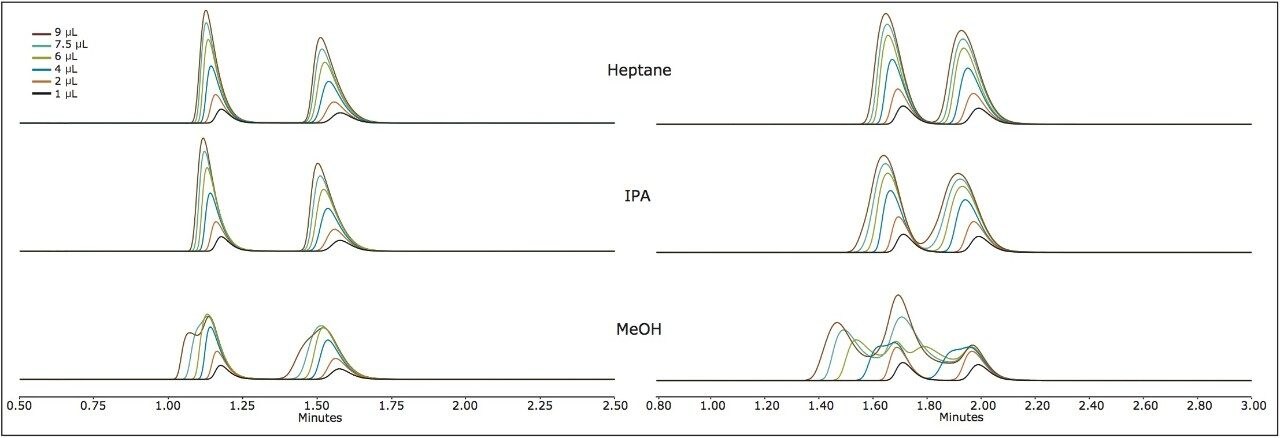
Sample diluent induced peak distortion is due to a disruption of the equilibrium between mobile and stationary phases. When a sample is injected into a mobile phase stream of a different composition, e.g. a weaker or stronger elution solvent, the local mobile phase composition alters the peak elution profile. The distortion occurs briefly at the inlet of a column bed. In the case of using a sample diluent weaker than the mobile phase, peak sharpening or focusing will occur. When the sample diluent has a stronger elution strength than the mobile phase, peak broadening will occur. We have found that distorted peak profiles caused by the strong solvent effect (injecting a sample diluent having a stronger eluent than the mobile phase) are very repeatable. It should be noted that there are destructive solvents which should never be used as injection solvents or in mobile phases on Trefoil phases: tetrahydrofuran (THF), dimethylsulfoxide (DMSO), dichloromethane (DCM), and other halogenated solvents.8
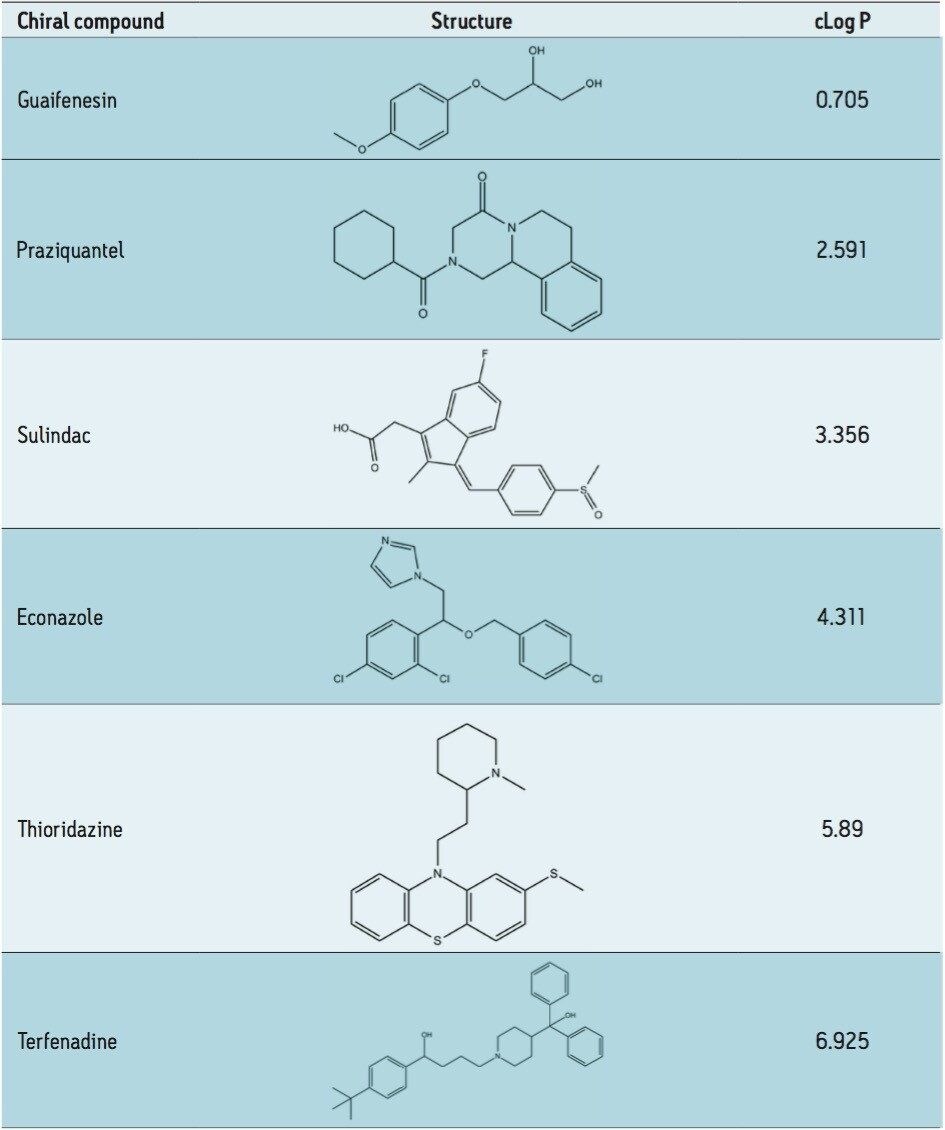
Suitable chiral separation conditions were found for each of the chiral analytes using the Trefoil AMY1 column, with the exception of terfenadine, which required the Trefoil CEL1 chemistry. A single co-solvent was employed and used for both isocratic and gradient elutions. The co-solvent percentage was adjusted for each compound to achieve retention times of less than five minutes for each analyte. The injection volume was increased for each sample, but never to a point of producing a mass overloaded peak profile. Mass overloading is not a concern in these experiments. For example, if we look at the peak profiles of the same injection volume across different sample diluents, the peak profiles can be very different, e.g. guaifenesin, or similar, e.g. praziquantel, but none of the results were characteristic of mass overloading. Furthermore, all the samples were prepared in dilute solutions, around 0.4 g/L, and injection volumes were less than 2.5% of the column hold-up volume. The initial observations of peak distortion show broadening of the peak, particularly near the peak apex. As the injection volume increases, peak distortion increases and has the appearance of a shouldering second peak. In the case where there are two closely eluting peaks, the profiles can be distorted so much that the two peaks can appear to be one or even three peaks. This can be a significant problem for chiral and preparative separations. Chiral separations limit the analyst’s ability to easily distinguish between the distorted peak profiles, as UV and MS signals are identical for a pair of enantiomers. In Figure 1, two contrasting results are seen between guiafenesin and praziquantel. The former peaks are highly distorted with the use of IPA or methanol as the injection solvent, while the latter is nearly unaffected by the choice of sample diluent. The relatively high retention (33% co-solvent was used for elution) for praziquantel and the mid-range cLog P value work together to mitigate the effect of sample diluent.
This trend is further confirmed in Figure 2 for sulindac and econazole, in which neither peak profile is significantly affected by the choice of sample diluent. As the cLog P increases, in the case of thioridazine and terfenadine, peak distortion is noted only for the most polar sample solvent (methanol). The mitigating effects of retention were observed when terfenadine was injected on the amylose versus cellulose based chemistries (AMY1 and CEL1, respectively, and the former inducing significantly more retention). The enantiomers are not separated on the AMY1 column with the given co-solvent. The peak profile seemed nearly unaffected by the composition of the sample solvent and had very high retention, requiring a gradient for elution (25–50% co-solvent). However, the enantiomers are separated isocratically at 25% co-solvent on the CEL1 chemistry (Figure 3) and demonstrate very distorted profiles when the sample solvent is methanol. On the CEL1 chemistry, the enantiomers are less retained, but interact with the chiral environment and become resolved. In methanol, the terfenadine peaks become so distorted they transition from two distinct peaks (1 and 2 μL injections), to two peaks with shoulders (4 μL), to four peaks (6 μL) and finally three peaks (7.5 and 9 μL).
The choice of sample solvent depends on both the nature of the stationary phase and the analyte.1 The results indicate a clear partitioning of analytes to like-polarity adsorption sites when a stationary phase has both polar and apolar characteristics. There are multiple factors influencing or mitigating peak distortion such as, the degree of interaction between analyte and stationary phase, relative polarity of the stationary phase, retention factor of the analyte, mobile phase composition and extra-column dispersion. Retention factor and amount of co-solvent have counter-acting effects to one another. Increasing the retention factor diminishes peak distortion, which can be achieved by lowering the amount of co-solvent. Yet, lowering the percentage of co-solvent will further induce peak distortion. Performing these sample solvent experiments reveal characteristics of the stationary phase, which indicate that the AMY1 and CEL1 materials most likely have a mid-range cLog P, which is evidenced by the lack of peak distortion and high retention for like analytes.
We have found that, in general, non-polar injection solvents should be used with Trefoil Columns. Heptane and heptane/IPA mixtures have been shown to be effective at mitigating peak distortion with compounds of various polarity. An interesting trend between analyte cLog P and injection solvent properties has been observed by examining the resultant peak distortion when these are varied. When cLog P is greater than ~2.5 and less than ~4.3 (praziquantel and econazole, respectively), the injection solvent polarity has little effect on the peak shape observed. The compounds tested required a significant amount of co-solvent to achieve reasonable retention, which should attenuate the strong solvent effect. To date, retention and resolution on chiral stationary phases is still unpredictable, which is why the use of broad spectrum chiral selectivity from coated chiral phases is recommended. The polar nature of the polysaccharide coatings and analyte-stationary phase interactions dictate the sample solvents of choice, just as in achiral separations. In all cases, the distorted peak profiles were not the result of mass overloading, evident by comparing injections between different solvents, but of the same mass load. The distorted peaks are caused by a mismatch between the injection solvent and mobile phase polarities. Distorted peak profiles are surprisingly reproducible, exemplified by the growing distorted peak shapes of guaifenesin dissolved in methanol and IPA. However, some distorted peak profiles can be difficult to predict and interpret without both higher and lower injection volumes, as seen with terfenadine dissolved in methanol. When performing analytical chiral separations, the practitioner should take care to examine the polarity of the analyte and stationary phase. By following the sample outline here: use non-polar injection solvents with polysaccharide chiral phases; one can avoid significant peak distortion in chiral separations.
720005472, August 2015