• Application Note

Impurity Profiling of Liquid Crystal Intermediates Using UltraPerformance Convergence Chromatography (UPC2 ) with PDA Detection

Impurity Profiling of Liquid Crystal Intermediates Using UltraPerformance Convergence Chromatography (UPC2 ) with PDA Detection

  • Jane Cooper
  • Waters Corporation

Abstract

This application note describes impurity analysis of liquid crystal intermediates utilizing UPC2 with Photodiode Array (PDA) detection offering robustness, selectivity, and sensitivity, with reduced run times and associated savings in the cost and disposal of non-toxic solvents.

Benefits

This application note illustrates cost-effective, efficient impurity profiling of liquid crystal intermediate compounds using Waters ACQUITY UPC2 System with PDA detection. When compared to standard methodology, it offers:

  • Greater than 110-fold reduction in the volume of toxic solvents used.
  • Greater than 13-fold increase in sample throughput.

Introduction

Liquid crystals combine the physical and optical properties of both liquids and solids. They flow and pour like liquids, but they have some of the optical properties of solids, such as birefringence. They also react predictably to an electric current, which enables the control of light passage. Because of these properties, liquid crystals are used in many items with electronic displays, for example watches, calculators, mobile phones, desktop monitors, and TVs.

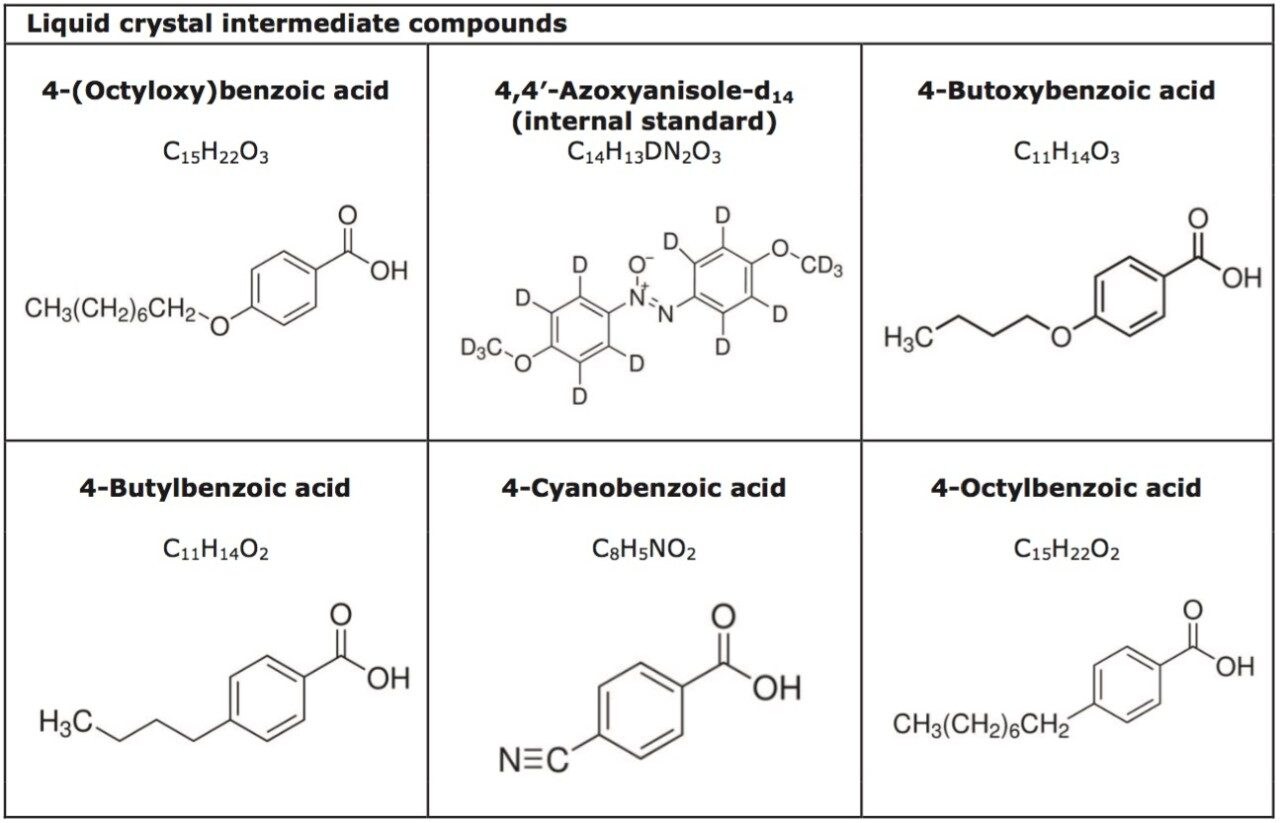
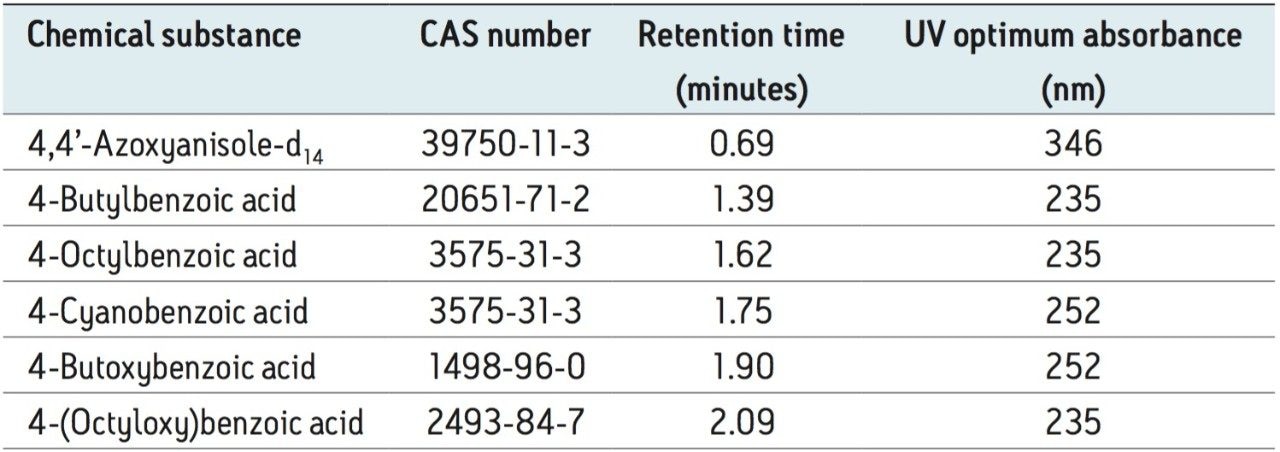
Liquid crystal intermediate compounds are the building blocks used to prepare liquid crystals. A typical liquid crystal mix, in order to achieve the material properties required, contains between 10 and 20 individual intermediate compounds. The purity of the liquid crystal intermediate compounds used is critical to ensuring optimum optical quality, performance, and lifetime of the electronic display device.

There are various analytical methods used to characterize liquid crystal intermediate compounds including: Differential Scanning Calorimetry,1,2 Fourier Transform Infrared,3 Raman Spectroscopy,3 Ultraviolet Absorption Spectrophotometry,1 and Optical Microscopy.2

For the impurity profiling aspect of characterization, typically a chromatographic technique would be used for the analysis of liquid crystal intermediate compounds, for example HPLC with UV detection,4 HPLC with MS detection,5 and GC with MS detection.6 However, these techniques have some limitations including: the compounds might not be thermally stable and/or volatile; there might be limited sample availability; the sample solubility might be incompatible with the solvent required for the technique, therefore requiring additional sample preparation stages; long analysis times with insufficient selectivity and sensitivity.

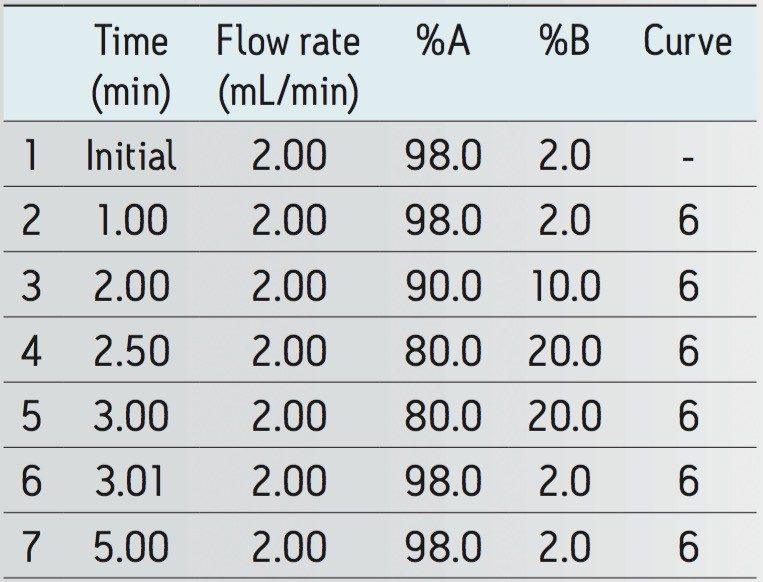
Convergence chromatography (CC) is a normal phase separation technique that uses carbon dioxide as the primary mobile phase, with the use of co-solvent such as methanol. Waters UltraPerformance Convergence Chromatography (UPC2) builds upon the potential of CC while using Waters’ proven and robust UPLC Technology.

Many liquid crystal intermediate compounds are not very stable at high temperatures, have low volatility, and similar UV spectra. Therefore, utilizing the separation powers of UPC2 with CO2 as the mobile phase is an ideal alternative to both HPLC and GC analysis.

This application note describes impurity analysis of liquid crystal intermediates utilizing UPC2 with Photodiode Array (PDA) detection offering robustness, selectivity, and sensitivity, with reduced run times and associated savings in the cost and disposal of non-toxic solvents.

Experimental

UPC2 conditions

System:

ACQUITY UPC2

Run time:

5.00 min

Column:

ACQUITY UPC2 CSH Fluoro-phenyl, 1.7 μm, 3.0 x 100 mm

Column temp.:

50 °C

CCM back pressure:

2000 psi

Sample temp.:

20 °C

Mobile phase A:

CO2

Mobile phase B:

Methanol (2% formic acid + 15 mM ammonium acetate)

Flow rate:

2.0 mL/min

Injection volume:

1 μL

Vials:

Waters Amber Glass Screw Neck 12 x 32 mm, 2 mL

Table 1. ACQUITY UPC2 System mobile phase gradient.

PDA conditions

UV detector:

ACQUITY UPC2 PDA

Range :

210 to 450 nm

Resolution:

1.2 nm

Sampling rate:

20 pts/s

Filter time constant:

Slow (0.2 s)

Sample description

The liquid crystal intermediate compounds were purchased from Sigma-Aldrich (their structures are shown in Table 2). Individual stock solutions were prepared to a concentration of 5 mg/mL, dissolved in either 9:1 heptane/ethanol or methanol. Serial dilutions of the stock solutions were carried out in 9:1 heptane /isopropanol in order to prepare mixed calibration standards.

Instrument control, data acquisition, and results processing

Empower 3 Software was used to control the ACQUITY UPC2 System and the ACQUITY UPC2 PDA Detector, and provide data acquisition.

Results and Discussion

UPC2 conditions were optimized for the analysis of the selected liquid crystal intermediate compounds. Retention times and UV optimum absorbances were established by analyzing single component standards (Table 3).

Table 3. Liquid crystal intermediate compounds, associated CAS number, measured retention times, and the UV optimum absorbance.

The analysis of five liquid crystal intermediate compounds along with one internal standard was achieved using Waters’ ACQUITY UPC2 System and the ACQUITY UPC2 PDA Detector.

Optimum UPC2 and PDA conditions were developed, with the elution of all compounds within a five-minute run. Reported run times between 65 and 110 minutes have been reported using HPLC,4,5 for the analysis of liquid crystal intermediate compounds.

Mixed calibration standards, 0.001 to 0.25 mg/mL, were prepared and analyzed for all the compounds considered. The calibration curve results generated by Empower 3 Software for 4-cyanobenzoic acid are shown in Figure 1.

The UV chromatograms for each liquid crystal intermediate compound in a mixed 0.1 mg/mL calibration standard are shown in Figure 2, and the associated UV spectra are shown in Figure 3.

Figure 2. UV chromatograms for each liquid crystal intermediate compound, at their optimum wavelength of either 252, 235, or 346 nm, in a mixed 0.1 mg/mL calibration standard.
Figure 3. UV spectra for each liquid crystal intermediate compound in a mixed 0.1 mg/mL calibration standard (all compounds were resolved by retention time).

Impurity profiling

The purity of the liquid crystal intermediate compounds is paramount to achieving optimum optical quality, performance, and lifetime of the electronic device. Therefore, the ability to detect impurities is critical to ensuring optimum efficiency of the liquid crystal. Impurities can be present due to many factors, including contamination, as by-products, or as degradation products.

UPC2 can be used for impurity profiling of liquid crystal intermediate compounds. Typically, impurities present above 0.1% are considered significant and could potentially reduce optical quality, performance, and product lifetime. In order to demonstrate this, one liquid crystal intermediate compound (4-butylbenzoic acid) was spiked at 0.1% with three other liquid crystal intermediate compounds, and analyzed using the developed UPC2 conditions with PDA detection. The resulting UV chromatograms achieved, as shown in Figure 4, demonstrate that the identification of an impurity at 0.1% can be achieved for the liquid crystal intermediate compounds considered.

Conclusion

By utilizing ACQUITY UPC2 with PDA detection, a cost-effective, efficient impurity profiling method has been developed for the analysis of liquid crystal intermediate compounds.

Many liquid crystal intermediate compounds are not very stable at high temperatures, have low volatility, and have similar UV spectra. Therefore, separation by UPC2 with CO2 as the mobile phase is an ideal alternative to both HPLC and GC analysis.

The efficiency of the ACQUITY UPC2 System, which builds upon the potential of convergence chromatography while using proven and robust UPLC Technology, can be used as an orthogonal technique to ensure full characterization of liquid crystal intermediate compounds.

The described approach offers many business and analytical benefits, when compared to HPLC for the analysis of liquid crystal intermediate compounds, with typically greater than a 13-fold increase in sample thoughtput and a 110-fold reduction in the volume of toxic solvent required.

References

  1. Özgan S, Okumus M. Thermal and Spectrophotometric Analysis of Liquid Crystal 8CB/*OCB Mixtures. Braz. J. Phys. 2011; 41: 118-122.
  2. Delica S, Estonactoc M, Micaller M, et al. Phase Diagram of Binary Mixture E7: TM74A Liquid Crystals. Science Diliman. 1999; 11: 22-24.
  3. Fathima Beegum M, Usha Kurari L, Harikumar B. Vibrational Spectroscopic Studies of 4-Cyanobenzoic Acid. Rasayan J. Chem. 2008; 1(2): 258-262.
  4. Brás A, Henriques S, Casimiro T, et al. Characterization of a Nematic Mixture by Reversed-Phase HPLC and UV Spectroscopy: Application to Phase Behavior Studies in Liquid Crystal-CO2 Systems. electronic-Liquid Crystal Communications. March 28, 2005. [cited 2013 May 2020]. Available from: http://www.e-lc.org/tmp/M.___Dion%EDsio_2005_03_21_07_41_31.pdf
  5. Martin T, Hass W. Analysis of Liquid Crystal Mixtures. Analytical Chemistry. 1981; 53(4): 593-602.
  6. Laclercq P, van den Bogaert H. Mass Spectra of Liquid Crystals. Organic Mass Spectrometry. 1991; 26: 276-278.

720004743, June 2013

Back To Top Back To Top