This application note demonstrates the rapid analysis of BPA, BPB, and BPE in powdered milk formula and baby food in less than five minutes.
The use of RADAR functionality and the TargetLynx Matrix Calculator are valuable tools that provide crucial insights and that can be used to optimize the method development toward a successful multi-step extraction method.
Bisphenol A (BPA) is an additive primarily used in the production of polycarbonate plastics and epoxy resins. These synthetic materials are widely used in food packaging to protect the safety and integrity of foods and beverages. Polycarbonates are used to produce many food and beverage containers, such as baby bottles, tableware, and other food containers. Epoxy resin coatings prevent corrosion of metal cans and contamination of foods.
BPA is an endocrine disruptor, which can mimic the body’s own hormones and may lead to negative health effects. In 2001, concerns about the estrogenic activity of BPA were raised and several governments released reports questioning the safety of its use in consumer products. Canada became the first country to take action on BPA through their Chemicals Management Plan, listing BPA as a toxic substance. The United States Food and Drug Administration (FDA) released a report in 2010 expressing some concern regarding BPA exposure of fetuses, infants, and young children, which has prompted further studies into the safety of BPA.1 A recent European Union directive (EU 2011/8/EU) has banned the use of BPA in infant feeding bottles.2 Since the recent ban of BPA products targeting the food industry, manufacturers are actively working to identify substitute bisphenols for new epoxy formulation.3,4 This application note presents the results for three bisphenols (A, B, and E) in baby food and powder milk formula.
Sample preparation conditions
Tube 1: |
50-mL tube, part #186004837 |
|
4.0 g MgSO4, 1.0 g NaCl, 1.5 g Na Citrate |
Tube 2: |
15-mL tube, part #186004834 |
|
900 mg MgSO4, 150 mg PSA, 150 mg C18 |
Cartridge: |
Oasis HLB 30 mm, 60 mg/3 cc |
Condition: |
2 mL methanol |
Equilibrate: |
2 mL water |
Load: |
70 mL diluted extract |
Flow rate: |
< 5 mL/min |
Wash: |
2 mL 40% MeOH in Water |
Elute: |
1 mL 100% MeOH |
UPLC system: |
ACQUITY UPLC |
Runtime: |
5.0 min |
Column: |
ACQUITY UPLC BEH C18, 2.1 x 50 mm, 1.7 µm |
Column temp.: |
40 °C |
Mobile phase A: |
0.5% NH4OH in water |
Mobile phase B: |
0.5% NH4OH in methanol |
Elution: |
3 min linear gradient from 5% (B) to 95% (B) |
Flow rate: |
0.5 mL/min |
Injection volume: |
50 µL |
MS system: |
Xevo TQD |
Ionization mode: |
ESI negative |
Capillary voltage: |
3.5 kV |
Cone voltage: |
30.0 V |
Source temp.: |
140 °C |
Desolvation temp.: |
350 °C |
Desolvation gas: |
550 L/hr |
Cone gas: |
50 L/hr |
The chemical structure and MRM conditions used for the bisphenols (BPA, BPB, and BPE) are listed in Figure 1 and Table 1, respectively. Bisphenol A D16 was used as internal standard.
The experimental extraction protocol for powdered infant formula and baby food combines several extraction techniques as outlined in Figure 2. The first step of the protocol employs an acetonitrile salting-out effect often referred to as the QuEChERS approach.5 This step was performed using Waters DisQuE Clean-Up Tube, which contains the appropriate proportions of sodium citrate, sodium chloride, and magnesium sulfate salts. The organic layer (acetonitrile) was further cleaned using the second DisQuE Tube, which contained a mix of magnesium sulfate, primary secondary amine (PSA), and C18. The second step of the protocol used solid phase extraction (SPE) on an Oasis HLB Cartridge, as shown in Figure 2. The final methanol extract was simply diluted 1:1 with water prior to injection on an ACQUITY UPLC Column. This avoided any evaporation and reconstitution steps.
Chromatographic separation was performed on an ACQUITY UPLC System equipped with an ACQUITY UPLC BEH C18 2.1 x 50 mm column. A three-minute linear water/methanol gradient with 0.5% NH4OH was used. The detection was performed using a Xevo TQD.
The analysis of food samples generally poses a significant analytical challenge with regards to extracting the analytes of concern from the food matrix. In order to achieve high quality extracts for quantitative analysis it may be necessary to use a combination of several extraction techniques. In addition, a requirement for robust quantitative LC-MS/MS assays is to assess and minimize any matrix effects, whenever possible. These effects may include peak distortion and signal suppression or enhancement.
The development of appropriate extraction techniques and assessment of any matrix effects can therefore be a time-consuming and laborious task. Tools that provide critical information through the process of method development can help to reduce the steps in the development process and improve lab efficiency. The information can also be used to ensure that the selected method is robust. In this application note two tools that can help with this process are described: RADAR and the Matrix Calculator.
RADAR is a unique capability of Xevo tandem quadrupole mass spectrometers that enables the simultaneous acquisition of full scan MS data and MRM transitions. This functionality enables informed decisions to be made during the method development process. For the analysis of bisphenol A in powdered infant formula and baby food, these two tools were used to assess the method robustness and matrix effects through the method development process. Examples of the use of these tools are presented in this application note, along with results from spiked samples taken through the final method. Figure 3 shows RADAR (full scan) total ion current chromatograms of powdered infant formula extracts from two different protocols. The insets of each chromatogram show a photograph of the corresponding extract. Chromatogram A was generated from an extract that used only protein precipitation followed by SPE on an Oasis HLB Cartridge. As seen in the full scan TIC chromatogram, there are multiple potential interferences in the chromatogram. The photograph in the inset shows that the extract was cloudy following this sample preparation.
Chromatogram B corresponds to an extract that incorporated a QuEChERS protocol prior to the SPE step, as shown in Figure 2. As can be seen from the RADAR chromatogram, the interferences have been reduced. The extract was also clear, as shown in the inset.
The Matrix Calculator, which is a tool within the TargetLynx Application Manager, provides an easy protocol for the assessment of the matrix impact on the quantitative analysis of a particular analyte. The combination of the qualitative information from RADAR with a calculation on the matrix factor provides further information that is useful in method development. The matrix effect is calculated by measuring the response ratio of the target analyte and internal standard in a clean extracted reference versus a matrix extract. In the application presented here, distilled water was chosen as the reference. A calculated value of 1.0 indicates that no matrix effect was detected during the analysis. If an extract shows a value lower than 1.0, ion suppression is implied. A value greater than 1.0 indicates signal enhancement.
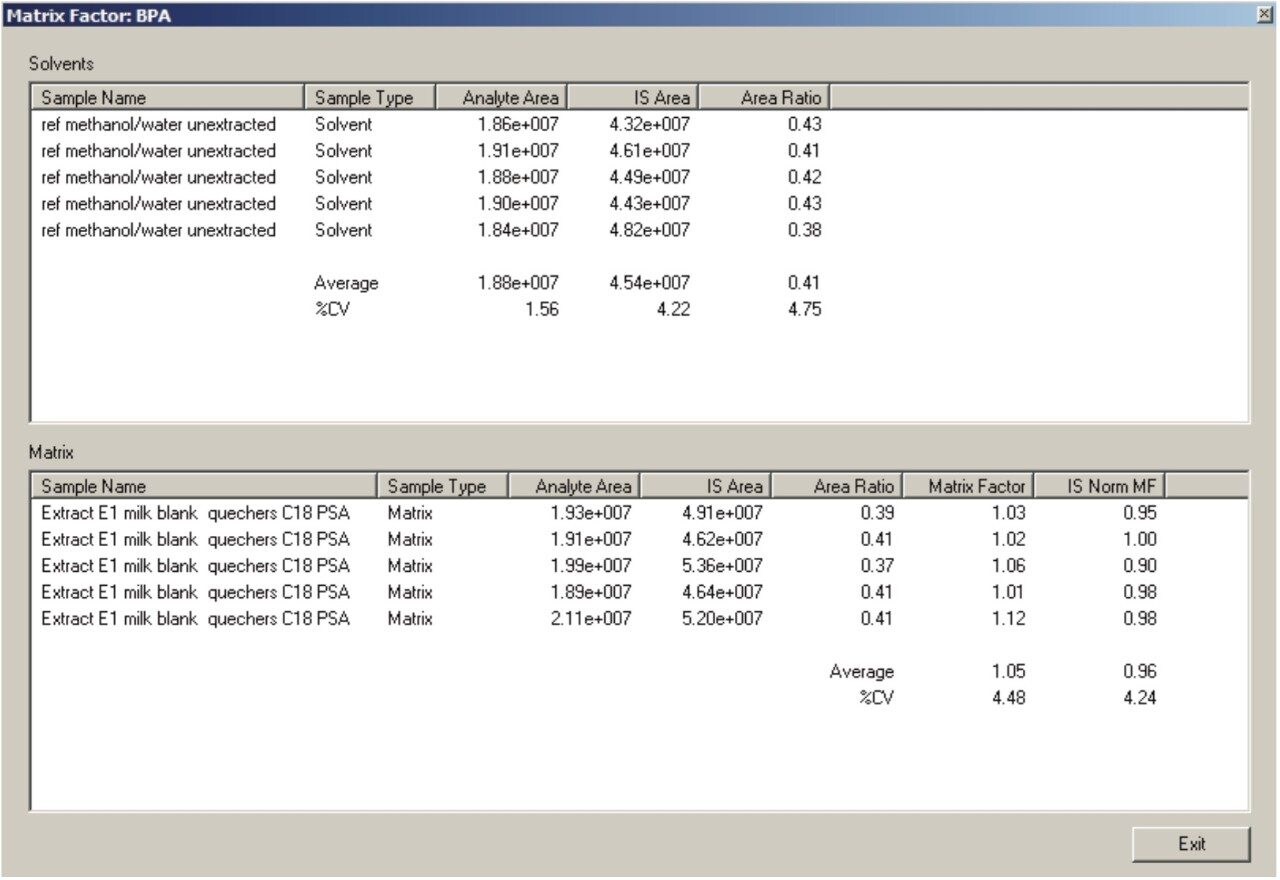
The use of the Matrix Calculator is described in-depth in application note no. 720003580en.6 Figure 4 shows an example screen shot of the results obtained from the Matrix Calculator for BPA in powdered infant formula.
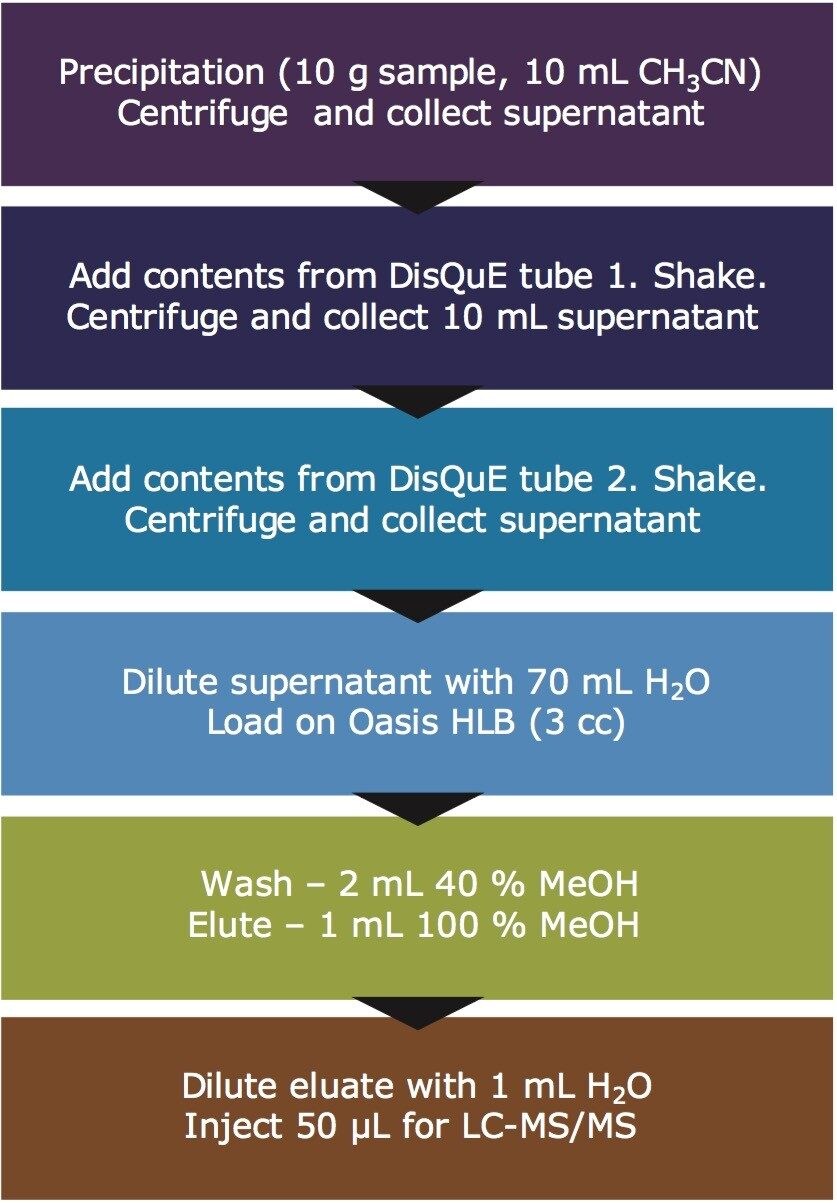
In this application note, the matrix values for BPA, BPB, and BPE for the powdered infant formula sample with the SPE protocol only were measured at 0.89, 0.72, and 0.86, respectively. With the sample extraction protocol outlined in Figure 2, the matrix values for powdered infant formula showed net improvement with 1.05 for BPA, 0.95 for BPB, and 1.04 for BPE. Figure 4 shows the results with and without the IS. Without the IS the matrix factor was calculated to be 1.05 with a %CV of 4.5, showing that there was no measureable matrix effect. The calculated matrix factor with the IS also shows a matrix factor close to 1.0.
The combination of RADAR and the Matrix Calculator provided clear insight into the method development procedure and led to the use of a multi-step extraction protocol based on measurable observations.
To assess the quantitative performance of the multi-step extraction protocol, bisphenols A, B, and E were spiked into powdered infant formula that had been reconstituted according to the manufacturer’s instructions. BPA, BPB, and BPE were also spiked into pureed green bean baby food. Figures 5 and 6 show the MRM chromatograms for powdered infant formula and baby food, each spiked at 1 ppb. For the powdered infant formula, a clear extract was obtained and the resulting MRM chromatograms showed a stable baseline with minor interferences. For the green bean baby food sample, the final extract was of a pale green coloration, most likely from the chlorophyll pigment found in green vegetables.
Figure 7 shows an example extracted calibration curve for BPA spiked into infant formula. Each concentration level was prepared in infant formula in replicate and extracted. The calibration curve from 0.5 ppb to 20.0 ppb for BPA in powdered infant formula showed a linear response with an R2 value of 0.996. Similar results were obtained for the other bisphenols in both powdered infant formula and baby food.
The recoveries of BPA, BPB, and BPE in powdered infant formula (10 ppb spike) and baby food (20 ppb spike) are shown in Table 2. In food applications, recoveries in the range of 80% to 120% are considered to be acceptable;7,8 therefore the recoveries reported for both the powdered infant formula and baby food confirmed the suitability of the multi-step sample extraction protocol.
The analysis of food samples undeniably requires a robust extraction protocol when targeting trace level detection of contaminants. This application note demonstrates the versatility of the Xevo TQD Mass Spectrometer for the analysis of BPA, BPB, and BPE in powdered milk formula and baby food. The use of RADAR functionality and the TargetLynx Matrix Calculator proved to be highly valuable tools during method development. These novel features provided crucial insights and were used to optimize the method development toward a successful multi-step extraction method. The final method resulted in excellent linearity and recoveries in both food matrices. Since the bisphenols were highly retained on the ACQUITY UPLC BEH C18 Column, the final methanol extract was simply diluted to a 1:1 ratio with water, thus avoiding any evaporation and reconstitution steps. This ability, along with an overall analysis time of less than five minutes provides a rapid method for the analysis of bisphenols A, B, and E in these infant food products. There is potential for extending this methodology to other food products that could come into contact with polycarbonates or epoxy resins.
720004192, January 2012