Target contaminants in water are usually present at trace levels (sub ppb). In order to bring the final concentration of analytes into the detectable range for a chosen detector (e.g. UV, ELSD, MS), a pre-concentration stage is required. An enrichment factor is calculated from the original sample volume and the final extract volume. For example, an initial sample volume of 500 mL is concentrated to a final volume of 1 mL for a 500:1 enrichment. It is common to have methods starting with higher volumes, such as 1 L, and a final extract as low as 500 μl. These methods require extensive manual labor with loading, evaporation, and reconstitution steps that may take several hours.
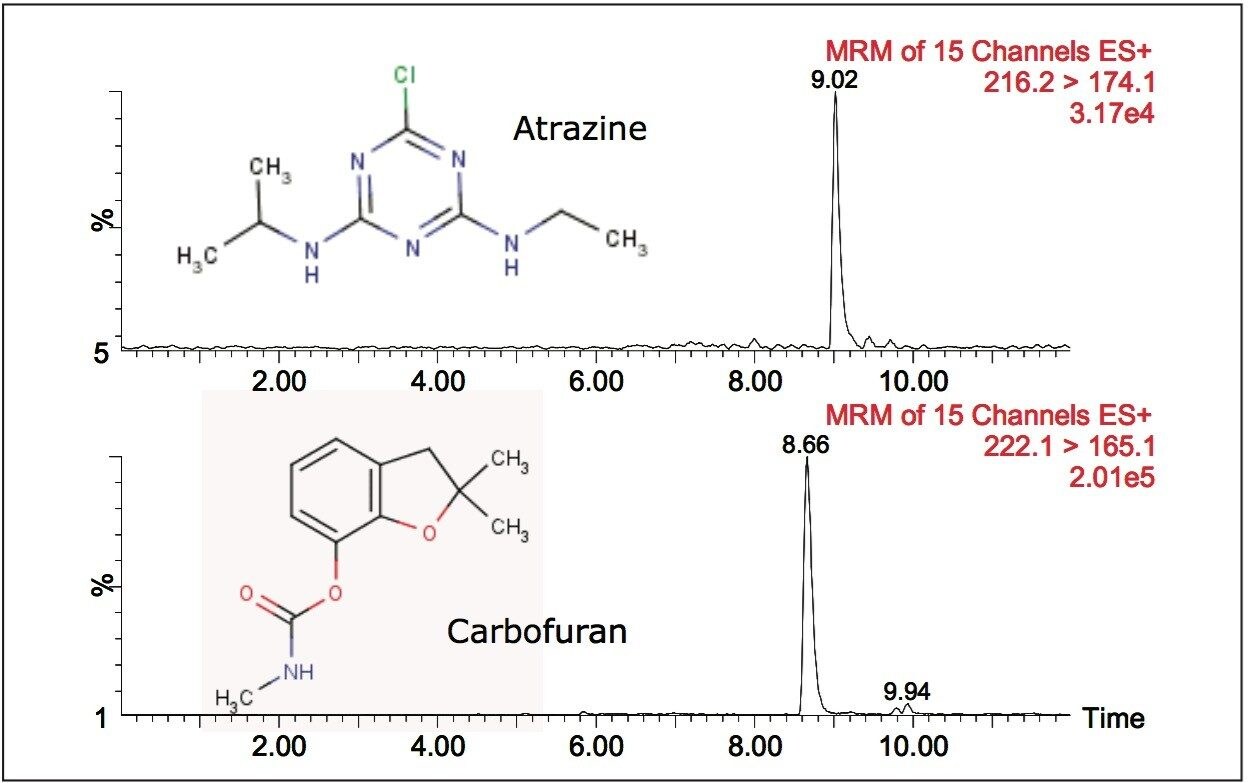
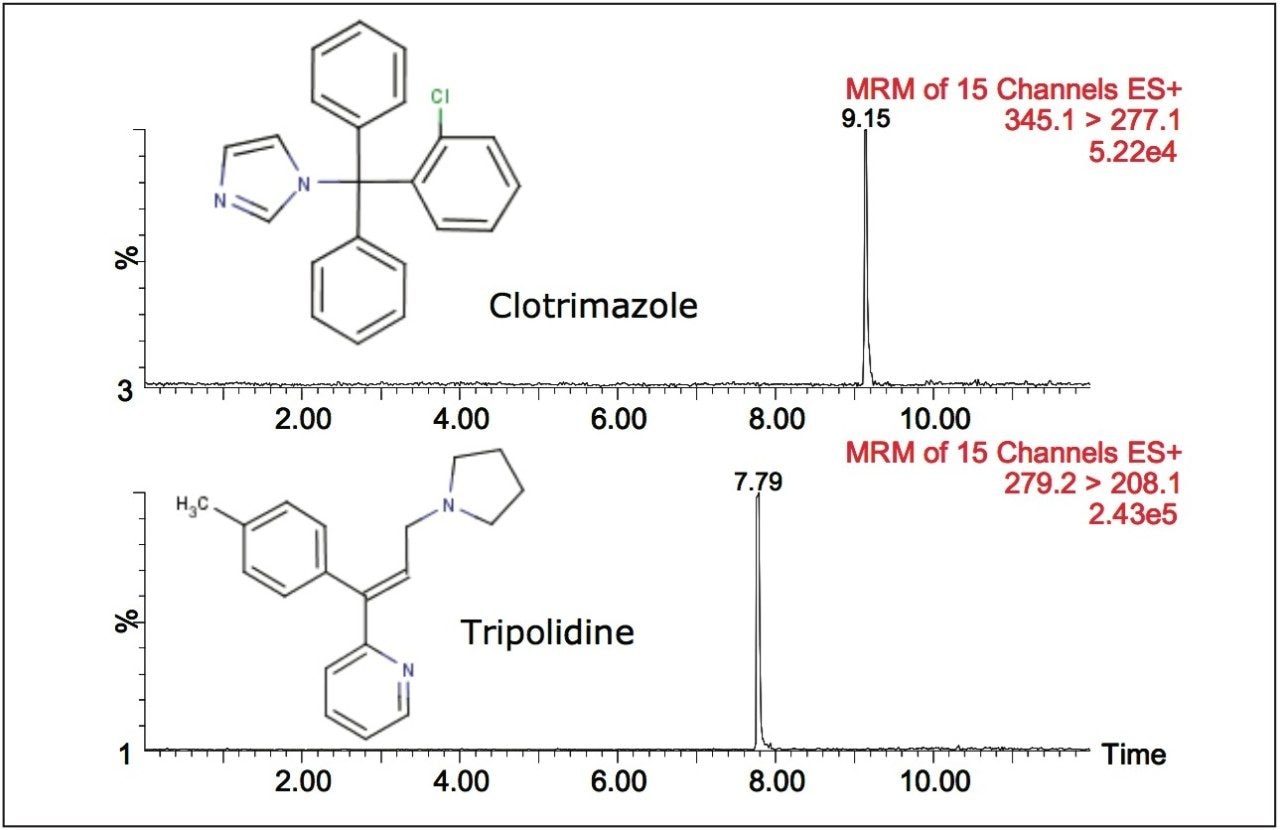
This application note details the analysis of pesticide residues and pharmaceuticals of concern in drinking water samples present at trace levels (sub ppb). Sample volumes of less than 20 mL were used to achieve the same trace level results as 1 L samples using the off-line approach. Samples can be collected in the field directly into 20 mL vials.
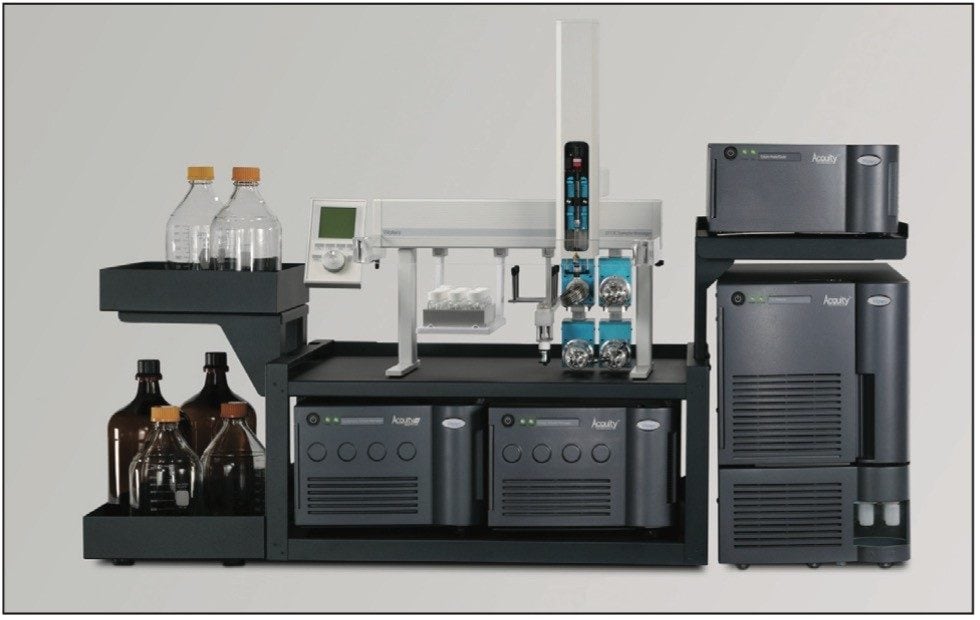
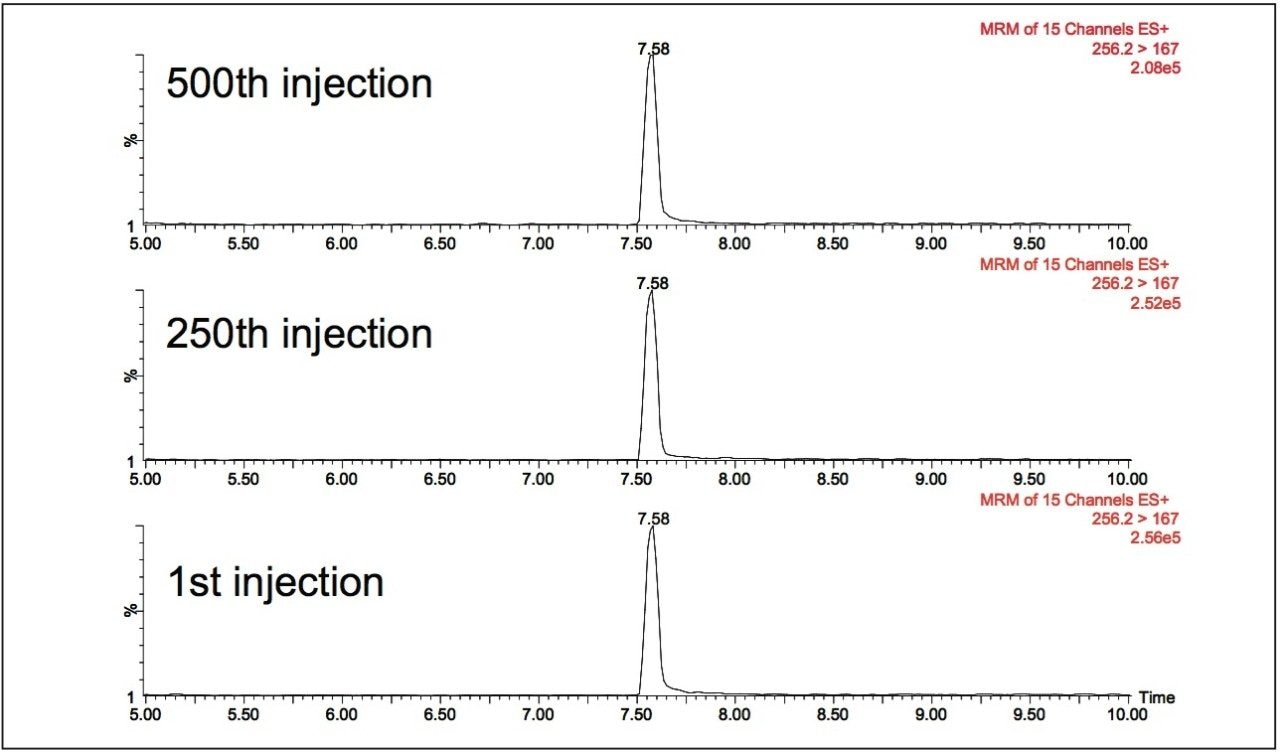
The UPLC with On-line SPE Technology used for these analyses provides a number of advantages:
- Eliminates tedious evaporation and reconstitution steps
- Manages several methods without operator intervention
- Manages methods requiring different conditions
- Reduces the required sample volume
- Minimizes sample transfer and handling