This application note provides an easy-to-use tool for differentiation between commercially available recordable compact discs (CD-Rs), and to identify counterfeit products.
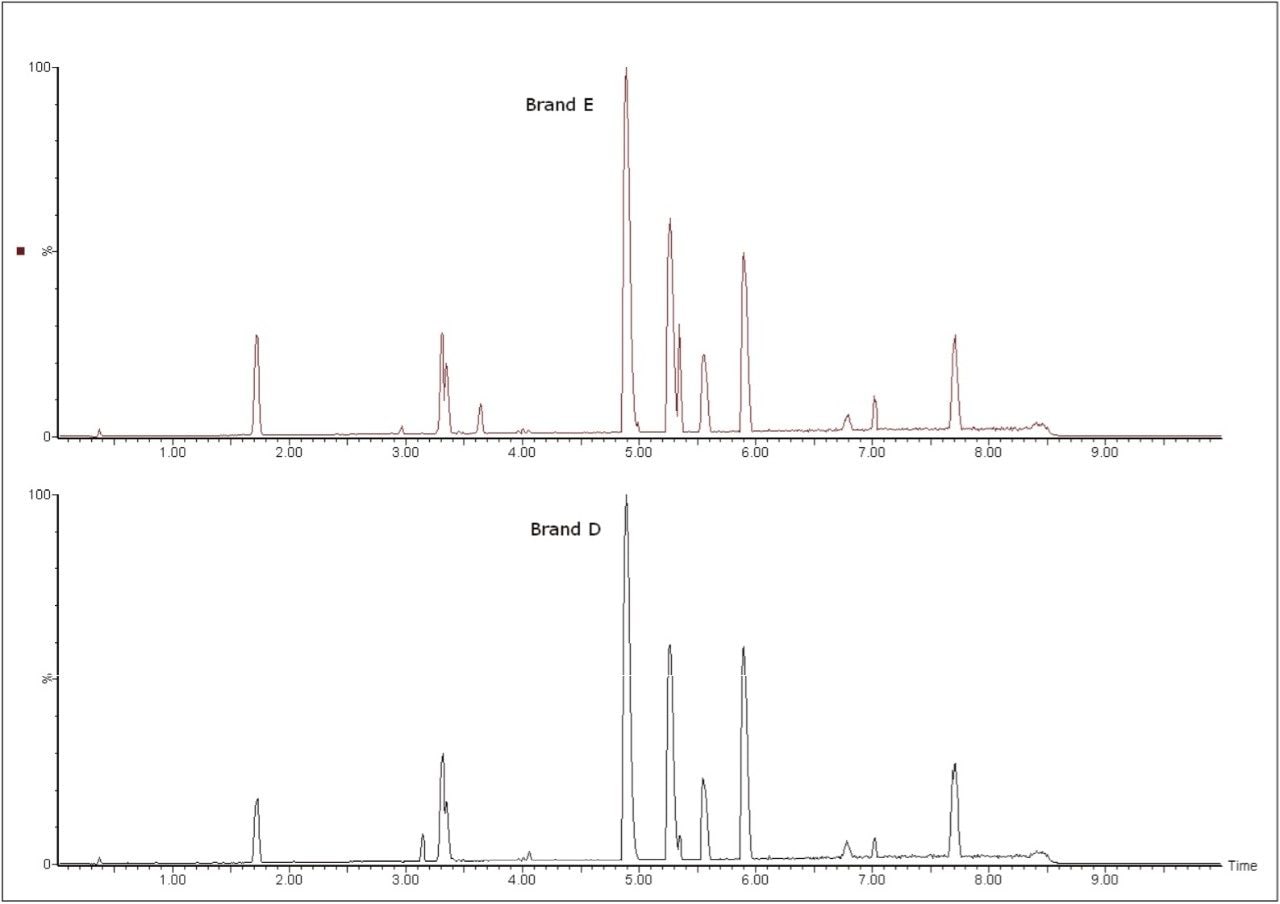
CD-R discs are composed of layers of polycarbonate, a burnable dye, a reflective layer, and a protective coating. The data are written using a laser beam, which follows the grooves in the polycarbonate, burning pits into a special dye that creates a code on the surface. When reading, the laser is set to a lower intensity, and the movement over the edges of the pits causes the reflection of the laser to flicker - which is transformed into a signal by a photo detector.The type of burnable dye used by manufacturers is often patented with premium disc brands using dyes and other additives that give the best performance, while being stable to atmospheric conditions, such as light and humidity. Cheaper products often use less stable dye components, which can change over time, leading to possible data degradation. This burnable dye is sometimes mixed with other dyes to change its color and appearance in order to make the disc more attractive to consumers, and to conceal the type of burnable dye used from competitors.
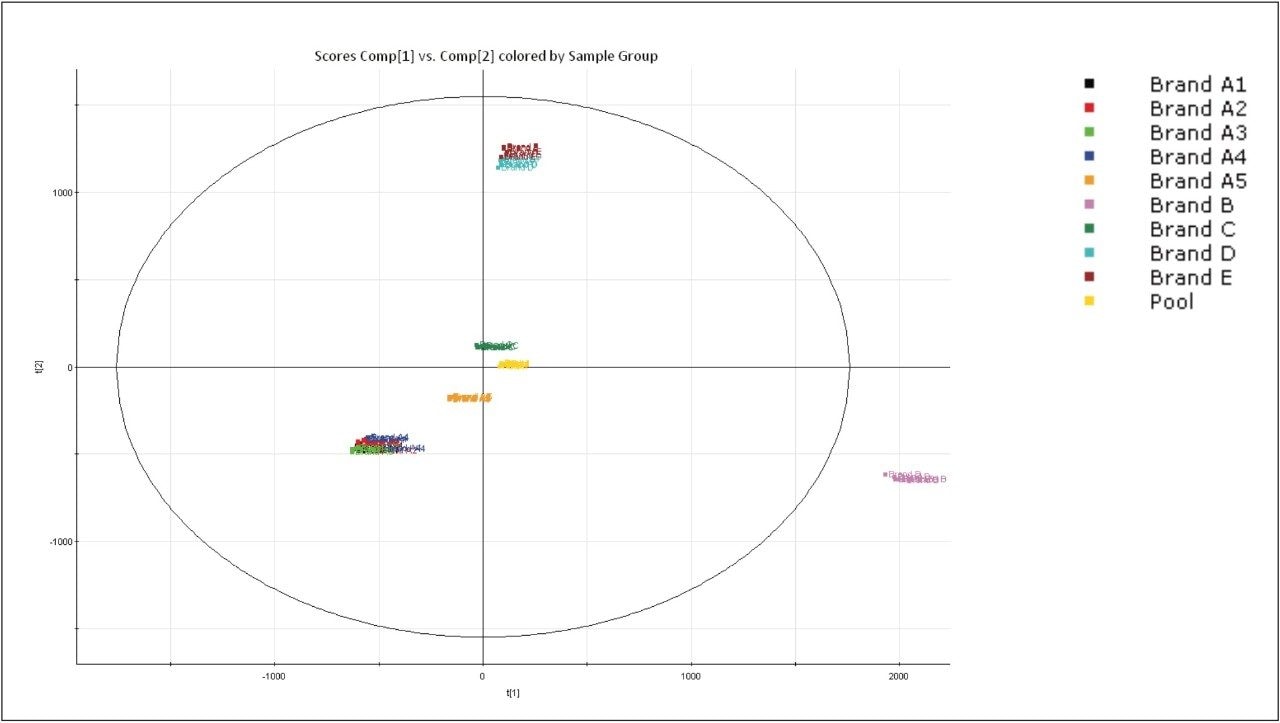
This competitive environment increases the manufacturers’ need for reliable and reproducible testing techniques that can be used to identify differences between brands, and to detect forgeries. Ensuring the consistency of product composition is essential for maintaining product performance and quality. Many manufacturers are seeking ways to profile, or ‘fingerprint’ their brands by using analytical techniques capable of detecting lower quality counterfeit products that may infringe upon their patents.
A chemometric approach can be adopted for this analysis. This approach can quickly provide information about the similarities and differences within a chromatographic dataset. Automation of this process can greatly reduce the analysis time required, and the probability of error in this assessment.
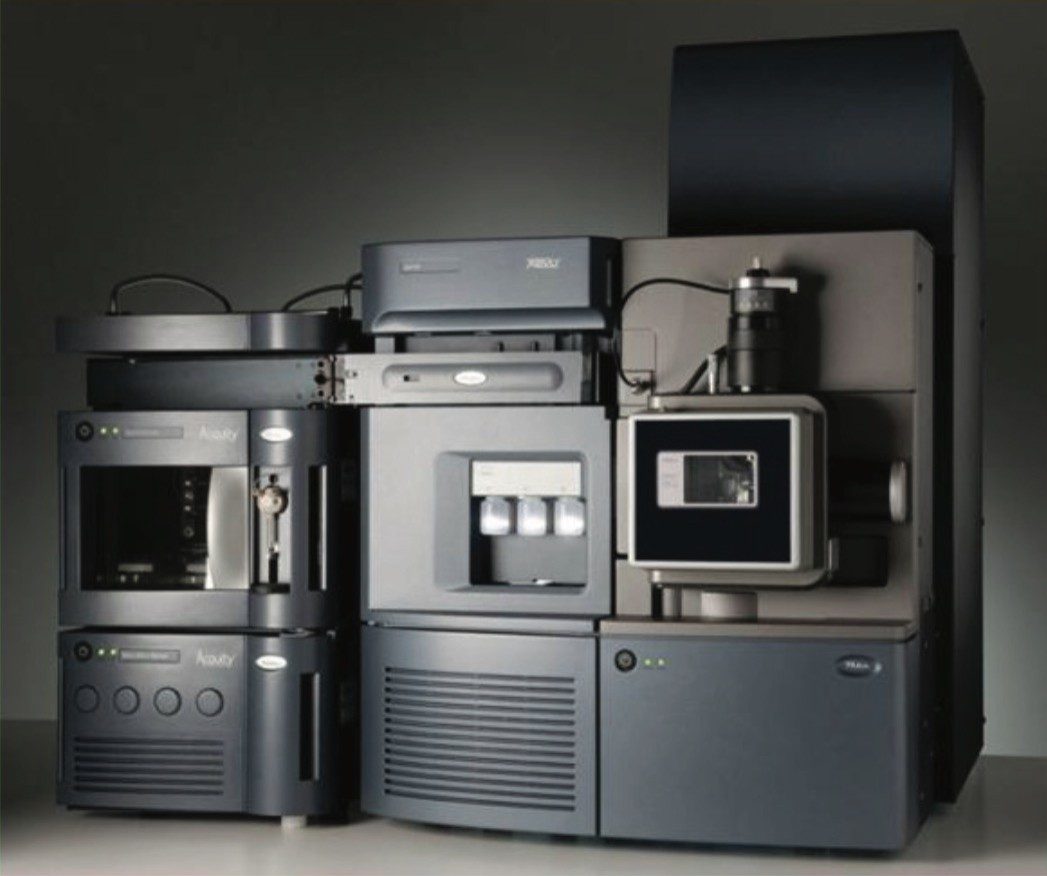
Advances in ease-of-use mass spectrometer operational software have changed working practices from complex to routine, making day-to-day MS use easier for all. This application note describes the characterization of commercially available recordable compact discs using Time-of-flight Mass Spectrometry, (TOF-MS), especially designed for inexperienced users and simplified for experienced users.
The Waters ACQUITY UPLC with Xevo QTof MS is an LC-MS/MS system that simplifies the process of acquiring and interpreting data to allow new users to feel confident when they have limited experience with TOF-MS. For the first time, Waters’ IntelliStart Software has been included with this type of mass spectrometer. With its advanced and basic settings, IntelliStart allows an experienced user to perform the initial instrument setup, which can then be accessed by less practiced analysts.
Figure 1 describes this calibration workflow and shows the report generated with a few simple mouse clicks. This workflow indicates if the instrument is performing within preset user-defined parameters. Calibration can be performed infrequently for an instrument situated in a well-regulated, temperature controlled laboratory. LockSpray conditions can also be defined here using a setup wizard that can run in conjunction with the calibration.
Once the calibration profile and LockSpray have been set up and saved, further checks can be performed on these files to confirm that the instrument is still within its correct operating range. This will typically be performed before an important batch of samples to ensure precise accurate mass data.
Less-experienced users can verify the calibration and lock mass properties on a more frequent basis to ensure accurate mass precision. IntelliStart Technology uses a simplified computer wizard to run a fully automated procedure. With a few easy mouse clicks it will ready the instrument for use. This check takes the profile, earlier established by an experienced user, and confirms that it still valid and appropriate to use.
Figure 2 shows a previously checked and loaded calibration profile.
A few mouse clicks and IntelliStart runs through its automated checks to give a clear indication that the system is performing correctly. The three green positive confirmation marks (✓) indicate that the system has passed its user defined limits and it is ready to use.
A simple sample extraction was employed. The CD-R was cut into small segments which were placed in a 100 mL bottle. 50 mL methanol was added, and the bottle was vigorously shaken for 10 min. The supernatant was filtered and placed into a Waters Certified vial, capped, and placed in the ACQUITY Sample Manager for analysis.
LC system: |
ACQUITY UPLC |
Column: |
ACQUITY UPLC HSS C18 2.1 x 50 mm, 1.8 μm |
Column temp: |
40 ˚C |
Sample temp: |
5 ˚C |
Gradient: |
0.00 min 95% A 6.00 min 0% A 8.00 min 0% A 8.10 min 95% A |
Mobile phase: A |
Water + 0.1% formic acid |
Mobile phase: B |
Methanol + 0.1% formic acid |
Weak needle: wash |
Water + 0.1% formic acid |
Strong needle: wash |
Methanol + 0.1% formic acid |
Total runtime: |
10 min |
Injection volume: |
5 μL, partial loop injection with needle overfill |
MS system: |
Xevo QTof MS |
Ionization mode: |
ESI positive |
Capillary voltage: |
3 kV |
Sample cone: |
30 V |
Source Temperature: |
120 °C |
Desolvation gas: |
Nitrogen, 800 L/Hr, 400 ˚C |
Cone gas: |
Nitrogen, 5 L/Hr |
Lock mass compound: |
Leucine enkephalin |
The design of the Xevo QTof MS allows for three bottles to be utilized by the on-board fluidics system, as shown in Figure 6. Typically, these would be for a lock mass solution, a calibration solution, and a compound of interest that may require infusing. The infusion from these bottles is easily controlled from the instrument page, or automatically from the MS method used for the acquisition of samples, or IntelliStart Software.
A novel feature of Xevo QTof MS is its ability to run methods with a multi point lock mass. This is used to “invisibly” correct the data to give precise accurate masses during the run at the time of ionization. It uses a patented, in-source switching baffle that quickly alternates between analyte and LockSpray flows. This method eliminates the need for any post-column plumbing, or extending sample analysis times, as it uses the on-board fluidics with an automated method of delivery to the source chamber during each injection.
Up to four different points across the mass range can be chosen, giving the analyst a greater choice when looking at compounds across the mass range. Figure 3 shows leucine enkephalin with three user-defined mass values of 556.2771, 425.1825, and 278.1141, all of which will be used to give a precise accurate mass.
The samples were analyzed using ACQUITY UPLC with Xevo QTof MS to show the differences between them. MarkerLynx XS Software was used to process the data into an easily understandable format, with all the calculations and comparisons performed automatically by the software.
Data were acquired using Waters’ MassLynx Software, v.4.1. Incorporated into MassLynx, IntelliStart Technology automates calibration and lock mass checks. Its real-time monitoring also gives the user confidence that the system is running at optimum conditions.
The data were processed using MarkerLynx XS Application Manager. This software enables users to overcome the time-consuming problem of identifying patterns in LC-MS data sets, by showing the similarities and differences of the detected MS traces. These characteristics define the markers within the sample set with a “mass-retention time pair”. The chromatograms in Figure 4 show the data obtained from two CD-R brands. It would be difficult to characterize all of these differences without MarkerLynx XS, as they look quite similar upon inspection with the naked eye.
These data can then be used for further experiments using the MS/MS capabilities of the instrument to help identify structural information1.
Principal Component Analysis (PCA) is part of the extended statistics that comes as standard with MarkerLynx XS Application Manager, as shown in Figure 5. This mathematical tool will plot complex data by grouping samples that show similar characteristics (having similar markers). This highlights samples with a similar composition in a matter of seconds.
The six replicates of ten samples were injected in random order to remove bias. The pool sample (in yellow) was made up of a mixture of equal aliquots of all of the extracted CD-Rs. This is used to show the experiment is valid because this pool should contain properties from all samples and should therefore be found close to the center of the plot. If the pool sample does not appear near the middle, then it is likely that the experiment has not succeeded.
The PCA also illustrates that Brands A1 to A4 (from same manufacturer) all share the same characteristics, except for differences in disc color, showing that separation is not due to this. This shows that the manufacturer is adding extra dyes to their products to disguise the type of dye layer used in production. Three different types of dye layer are generally used and this will be detailed further in Part 2 of this application note1.
Brand A5 was made by the same manufacturer but was purchased from a European geography. It shares some characteristics of the Japanese CD-Rs A1 to A4 but not all, which implies a variance in composition. The other brands were all characterized and are shown in Figure 5. Brands D and E show many similarities, which means that they share many of the same markers and that their formulations will be similar.
-Simplified training of new users and daily operation with its background system monitoring.
-Automated system setup to accurately prepare the instrument for use without human bias.
-Minimal variation over large sample batches (shown by good sample grouping) gives confidence in system reproducibility, and reduces the need for sample retests.
720003160, July 2009