Trace levels of perfluorinated compounds were successfully analyzed using an ACQUITY UPLC with TQD System that includes three major components: an ACQUITY PFC Analysis Kit, an SPE method, as well as a rapid, sensitive, and selective UPLC-MS method.
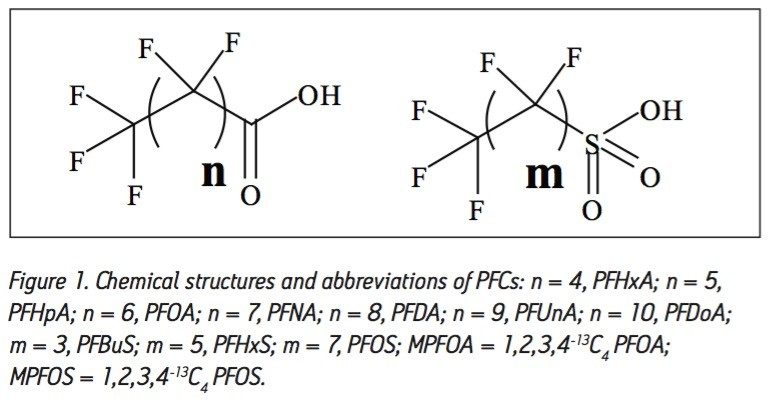
Perfluorinated compounds (PFCs) such as perfluorooctanoic acid (PFOA) and perfluorooctane sulfonate (PFOS) have been used for over 50 years in various applications that include surfactants, fire fighting foam, surface treatments, and as a polymerization aid in making polytetrafluoroethylene (PTFE), and other fluoropolymers.1,2 PFCs are extremely stable and not prone to environmental degradation. Long-chain PFCs such as PFOA and PFOS bioaccumulate in animals, causing tumors and disturbing reproductive development.3,4 Trace levels of PFCs have been measured in groundwater, wastewater treatment plants, lake water, the marine environment, and even in the Arctic.5 In recent toxicological studies,4 PFOA, PFOS, and other PFCs have been detected at parts per billion levels in wildlife tissues and human serum. Literature reports1-6 on the potential impact of PFCs on human health and the environment indicate that this is a global concern. Consequently, there is an increased demand for rapid, sensitive, and accurate analytical methods for the analysis of PFCs in environmental and biological matrices.
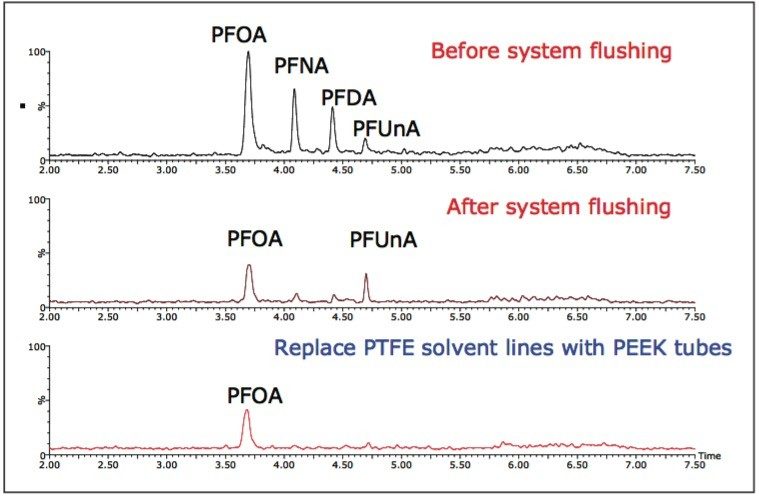
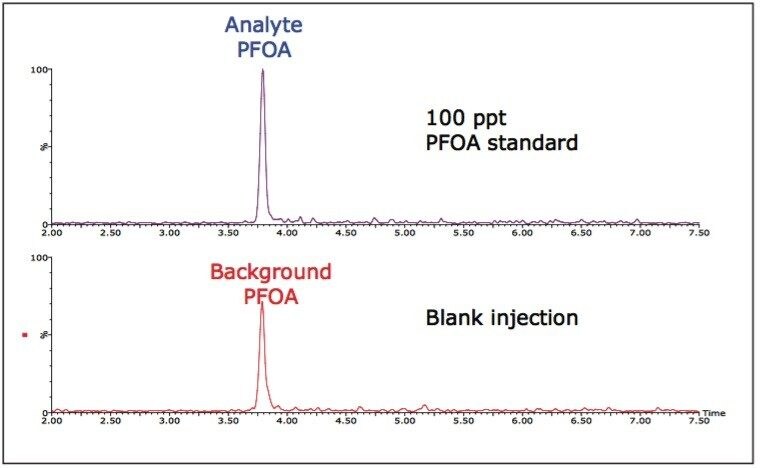
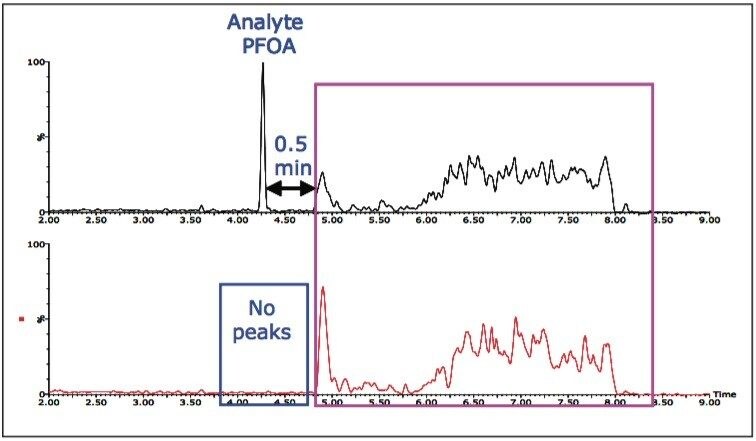
GC-MS can be used to analyze PFCs as an indirect analysis that first requires transesterification. With this approach, derivatization is time-consuming and the shorter chain PFCs are difficult to analyze because the methyl ester derivatives are very volatile.3 Although liquid chromatography/tandem mass spectrometry is used to analyze PFCs without derivatization, quantifying trace levels of PFCs in samples unambiguously is challenging because of the widespread background PFC contamination.3-4 Since PFCs are present in many components of lab instruments, trace levels of PFCs can leach out. In addition, PFCs are also detected in common HPLC solvents and in lab water. Because background PFC contamination is pervasive, quantifying trace levels of PFCs requires special care.4
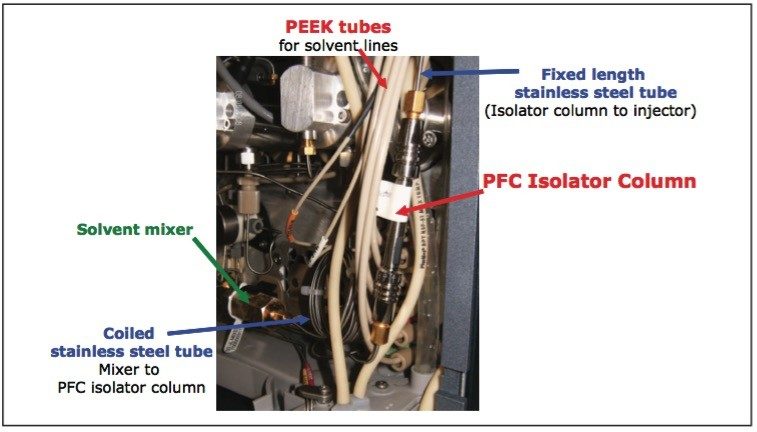
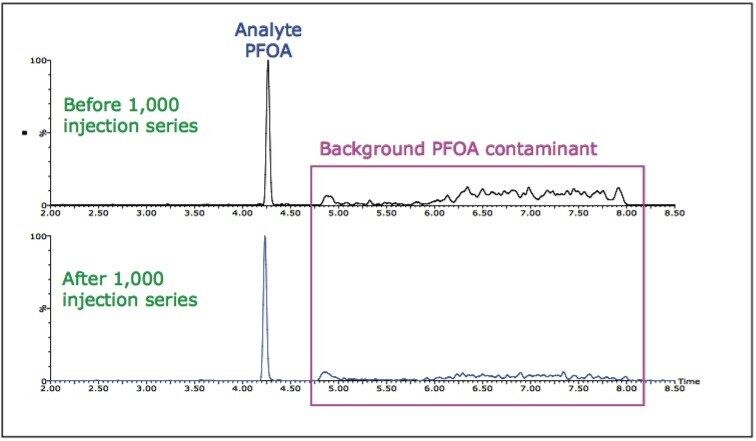
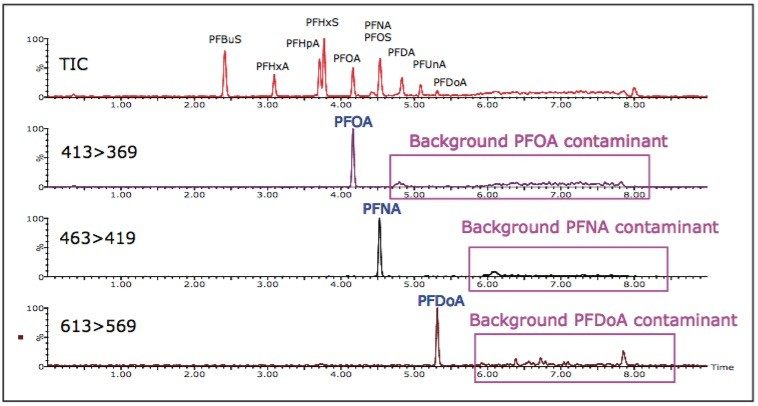
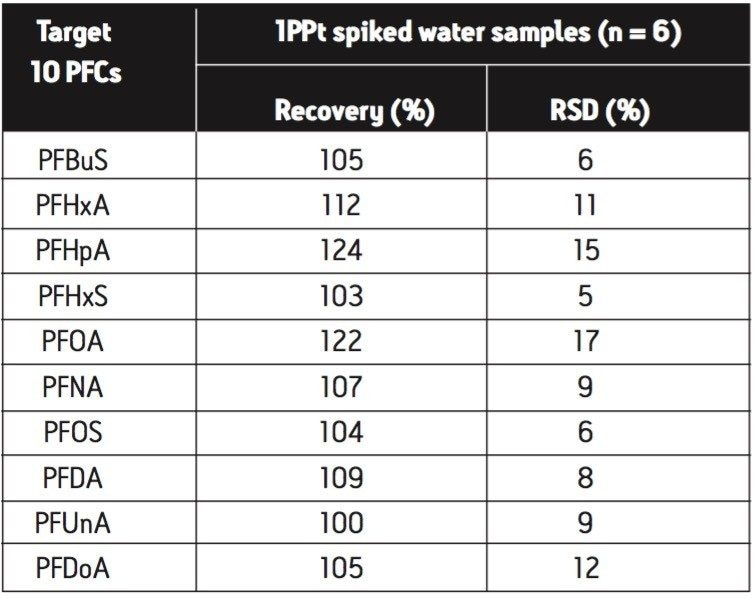
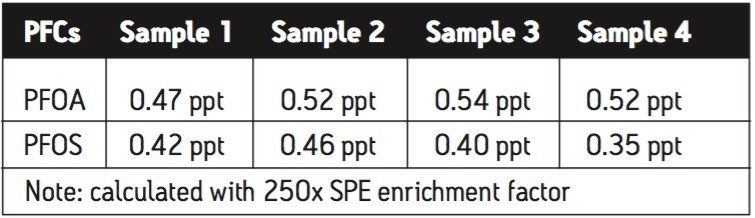
The PFC analysis system solution is comprised of a kit that eliminates interference from PFC contamination and an SPE method for sample preparation that allows for detection of 0.5 ppt PFOA and 0.4 ppt PFOS in bottled drinking water samples using the Waters ACQUITY UPLC System with the TQ Detector (UPLC-MS).
This system solution can facilitate workflow at labs for analyzing PFCs in various environmental and biological samples in order to satisfy legislative concerns and protect public health.
The Waters ACQUITY PFC Analysis Kit contains PEEK solvent lines, stainless steel tubing, screws, ferrules, filters, a PFC Isolator Column, an ACQUITY UPLC BEH C18, 2.1 x 50 mm column, OASIS HLB cartridges and vials, as well as PFC standards. The PFC Isolator Column is placed in-line between the solvent mixer and the injector as shown in Figure 2.7
PFC standards (Figure 1) were diluted in MeOH to make 250 ng/mL stock solutions. MPFOA and MPFOS were mixed and diluted with MeOH to make 7.5 ppb of PFC internal standard (IS) working solution. 1 mL of 250 ppb stock solution was mixed with 3 mL water to make a 62.5 ppb working solution. The PFC working solution was diluted with MeOH/H2O (25:75) to make calibration standard solutions in the range of 90 ppt to 10 ppb. 60 µL IS working solution was added to 864 µL calibration standard solution for UPLC analysis.
Note: 25% MeOH was used as an analytical blank. Vials with septa-less polyethylene caps were used to prevent PFC contamination.
LC system: |
ACQUITY UPLC System |
Weak wash: |
25% MeOH in water (500 µL) |
Strong wash: |
MeOH (500 µL) |
Seal wash: |
90:10 water: MeOH (5 min) |
Column temp: |
50 °C |
Injection: |
10 µL (full loop) |
Column: |
ACQUITY UPLC BEH C18 2.1x 50 mm |
Mobile phase A: |
2 mM ammonium acetate in water/MeOH [95:5] |
Mobile phase B: |
2 mM ammonium acetate in MeOH |
MS instrument: |
ACQUITY TQ Detector |
Ionization mode: |
ESI Negative |
Capillary voltage: |
-3.6 kV |
Extractor: |
-3 V |
Source temp: |
150 ˚C |
Desolvation temp: |
400 ˚C |
Desolvation gas flow: |
800 L/hr |
Cone gas flow: |
0 L/hr |
Collision gas: |
Argon at 3.4 x 10⁻³ mBar |
The mass resolution was adjusted so that the precursor and product ions were resolved with a peak width at half height of 0.85 Da.
The data were acquired using MassLynx Software, v.4.1. Incorporated into MassLynx Software, IntelliStart Software technology was used to optimize MRM scan parameters. TargetLynx Application Manager was used for data processing.
While liquid chromatography with tandem mass spectrometry is the method of choice for analyzing perfluorinated compounds, quantifying trace levels of perfluorinated compounds unambiguously remained a challenge. One of the most difficult problems in accurately quantifying trace levels of PFCs in samples is background PFC contamination.
Major sources of contamination are PTFE components of labware and the instrument, as well as mobile phases. Although some PTFE components used in the LC system can be replaced by PEEK or stainless steel materials, it is impractical to replace all PTFE components.4 Thus, trace levels of PFC contaminants can still exist. Extensively flushing the LC system or replacing some of the Teflon parts with those made of other materials can minimize contamination, but only to a certain degree. Figure 3 shows three TIC chromatograms of blank injections. The first chromatogram with several strong PFC peaks was obtained before flushing the system. The second one with less intense PFC peaks was obtained after extensive flushing of the system with methanol. The third chromatogram was obtained after the Teflon solvent lines were replaced with PEEK tubes; however, a PFOA peak is still evident.
The main reason for observing perfluorinated compound peaks in blank injections is due to the accumulation of PFC contaminants at the front end of the analytical column during the column equilibration and the early stage of the gradient. During the middle stage of the gradient when the organic strength of the mobile phase increases, the accumulated PFC contaminant peaks start to elute from the column.
Although methanol and water can be further purified to reduce PFC contaminants by filtering through anion-exchange, reversed-phase, and activated carbon cartridges, the steps involved are time-consuming and costly.
PFC contaminants cause a problem for quantifying trace levels of PFCs. Figure 4 compares MRM chromatograms of a 100 ppt PFOA standard and a blank sample without using the PFC Isolator Column. The data show that the background PFOA peak elutes at the same retention time as the analyte PFOA. Therefore, for accurate quantification, the background PFC contaminants originating from the LC system and mobile phases have to be eliminated.
The ACQUITY PFC Analysis Kit eliminates background PFC interference and enables accurate quantification of perfluorinated compounds. The kit provides PEEK tubing for solvent lines and stainless steel tubing to position the PFC Isolator Column in-line between the solvent mixer and the injector (Figure 2). Substituting PEEK for PTFE tubing reduces PFC contaminants leaching into the mobile phases. The isolator column is designed to hold up the PFC contaminants from the solvent delivery system during the column equilibration and the early stage of the gradient. Eventually, the accumulated PFC contaminants will elute from the column at the end of each injection cycle when 100% organic mobile phase is applied.
Figure 5 shows two MRM chromatograms obtained with the PFC Isolator Column in-line. The top chromatogram is an injection of PFOA standard (0.3 µg/L). It shows that the analyte PFOA peak elutes first and the background PFOA contaminant elutes 0.5 minutes later as a band of broad peaks. The bottom chromatogram without the analyte PFOA peak is a blank injection, confirming that the background PFOA contaminant has been isolated by PFC Isolator Column successfully. Using the PFC Isolator Column and an ACQUITY UPLC C18 Column in series, the maximum system back pressure ran at about 11,000 psi, which is well below the back pressure limit (15,000 psi) of the ACQUITY UPLC System.
Figure 6 is a comparison of two MRM chromatograms that were run one thousand injections apart. The data show that the isolation method is reproducible. The fact that there were no appreciable increases in system pressure and no negative effects on the chromatography after 1,000 injections demonstrate the great stability of the PFC Isolator Column and the ACQUITY UPLC BEH C18 Column.
Figure 7 shows the TIC chromatogram of 10 perfluorinated compounds using a basic MS method.8 The injection cycle time was 9 minutes. PFC analytes were easily identified and well separated. The MRM chromatograms indicate that the background PFC contaminants were successfully isolated from each analyte peak (Figure 7).
Using the retention time information of perfluorinated compounds obtained from Figure 7, a refined MS method with multiple MRM time windows can be set up (Figure 8). The method monitors 22 MRM transitions by arranging them into eight time windows. It allows for more time to scan target MRM transitions at the target PFC peak, giving better signal-to-noise ratio and peak detection. Table 1 lists the optimized MRM transition, cone voltage, and collision energy for each perfluorinated compound. Those MRM parameters were obtained automatically using IntelliStart Software. In this method, two MRM transitions for each compound were monitored. The primary MRM transition was used for quantification, while the secondary transition was used for ion ratio confirmation to eliminate false positive results.
Another issue for quantifying trace levels of PFCs can develop during sample preparation. The perfluorinated compounds need to be isolated and enriched effectively from the sample matrices prior to LC-MS/MS analysis. An SPE method was developed using Oasis HLB Cartridges with 250x enrichment factor to enhance the detection limits for analyzing PFCs in drinking water samples. Figure 9 shows a TIC chromatogram obtained from a bottled water sample spiked with 1 ppt of PFCs. The chromatogram shows that all of the PFC peaks were well detected with excellent signal-to-noise ratios. Figure 10 is an example of a typical calibration curve of PFOA having a correlation coefficient greater than 0.997. Table 2 lists the PFC recovery results obtained from six spiked bottled water samples. This SPE method provides good recovery for PFCs at 1 ppt concentration level with satisfactory reproducibility. The recovery and RSD values can be further improved if internal standards are added to the drinking water samples prior to the SPE procedure.
About 0.5 ppt of PFOA and 0.4 ppt of PFOS were detected in bottled drinking water samples (Table 3). Figure 11 shows typical primary and secondary MRM chromatograms of PFOA obtained from bottled water samples. Both primary and secondary transition ion peaks were well detected, and their ion ratios were in-line with the PFOA standard, which provided additional positive confirmation.
Trace levels of perfluorinated compounds were successfully analyzed using an ACQUITY UPLC with TQD System that includes three major components: an ACQUITY PFC Analysis Kit, an SPE method, as well as a rapid, sensitive, and selective UPLC-MS method. The ACQUITY PFC Analysis Kit eliminated interference from background PFC contamination and successfully separated analyte PFC peaks from PFC contaminant peaks, allowing accurate, trace level quantification. The SPE method effectively enriched and isolated perfluorinated compounds from the sample matrices.
The SPE/UPLC-MS method is easy to implement in any lab, such as contract analytical labs, government agencies, clinical, or medical research institutions. This method can be used to unambiguously quantify trace levels of perfluorinated compounds in drinking water with high sensitivity and resolution. The decreased run time can increase the productivity of analysts responsible for PFC analyses in drinking water.
720002813, July 2009