This application note describes an analytical approach which incorporates specificity, increased sensitivity, and higher throughput via decreased method development and analysis runtime, compared to traditional methods.
First pass metabolism is an important factor that affects the oral bioavailability of drugs. Metabolism affects a drug’s clearance and duration of action (half-life); drugs with high clearance often have a short half-life. The metabolism of the drug in the body and whether it forms metabolites are also important parameters in assessing the bioavailability, toxicity, and dosing potential for drug-drug interaction of a compound.
Estimates of in vivo metabolic clearance can be determined from in vitro metabolism kinetic data. Metabolic stability assays are typically performed to estimate a drug candidate’s metabolic half-life, or derive its intrinsic clearance. The analytical approach outlined in this note incorporates specificity, increased sensitivity, and higher throughput via decreased method development and analysis runtime, compared to traditional methods. The use of UPLC-MS/MS (Figure 1) and specialized software (ProfileLynx and QuanOptimize Application Managers) allowed for the automation of the analysis with faster time to results.
A set of 27 commercially available compounds were chosen to demonstrate the ProfileLynx Application Manager.
The microsome incubation for the 27 compounds followed a procedure that has been previously described elsewhere. A single 20-minute microsomal incubation procedure was used. The Pooled Male Rat Liver Microsomes (Sprague-Dawley) (Cat. # 452501), NADPH Regenerating System - Solution A (Cat. # 451220), and NADPH Regenerating System - Solution B (Cat. # 451200) were purchased from BD Biosciences - Discovery Labware (Bedford, MA). Potassium Phosphate Monobasic, Potassium Phosphate Dibasic, and Dimethylsulfoxide were purchased from Sigma-Aldrich (St. Louis, MO). 0.5 M EDTA solution was purchased from Invitrogen (Carlbad, CA). A Boekel Scientific Jitterbug Microplate Incubator Shaker was purchased from VWR (Bridgeport, NJ). Zolpidem, Midazolam, and Verapamil, which were used as standards to check activity of the rat liver microsomes, were purchased from Sigma-Aldrich (St. Louis, MO).
Solution 1 - 0.1M Potassium Phosphate Monobasic
13.6 g of potassium phosphate monobasic (KH2PO4) was weighed and transferred to a 1-L volumetric flask, diluted to volume with Milli-Q water, and mixed thoroughly.
Solution 2 - 0.1M Potassium Phosphate Dibasic
17.42 g of potassium phosphate dibasic (K2HPO4) was weighed and transferred to a 1-L volumetric flask, diluted to volume with Milli-Q water, and mixed thoroughly.
100 mM Phosphate Buffer
190 mL of solution 1 was combined with 810 mL of solution 2, mixed thoroughly and filtered through a 0.2-μm nylon filter. The pH was adjusted to 7.4 with phosphoric acid.
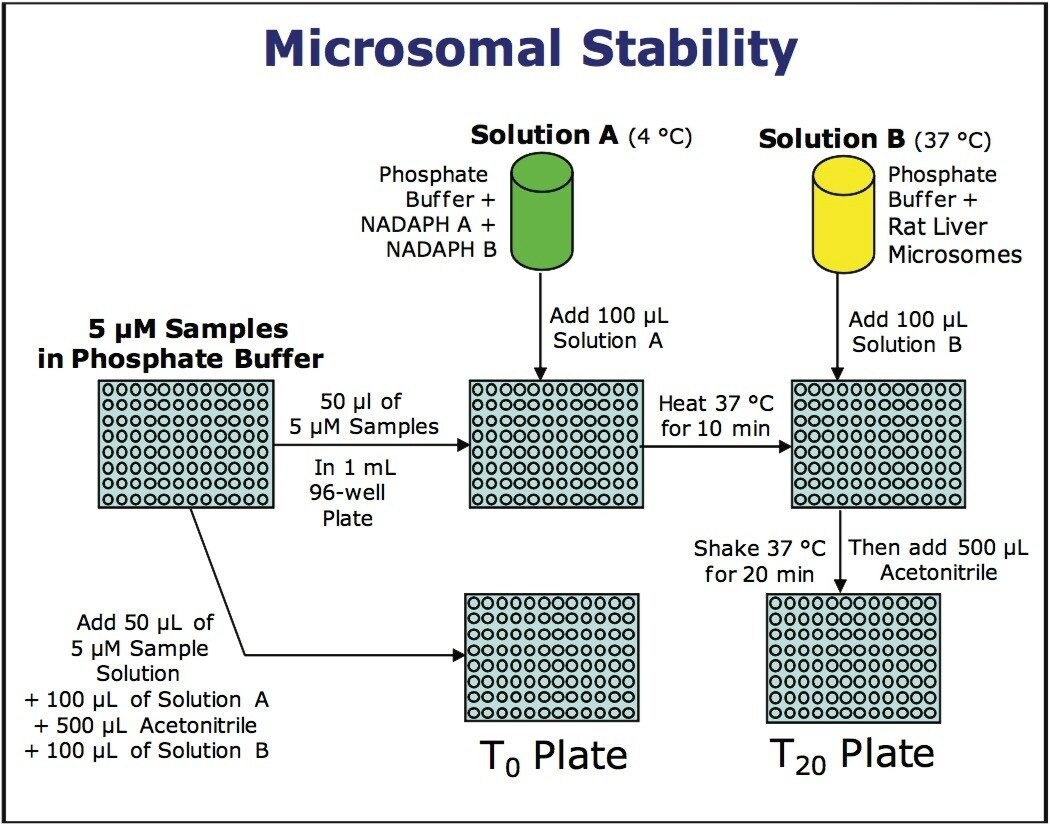
Solution A - Cofactor Solution
10.938 mL of 100 mM phosphate buffer was added to each of two ~45 mL plastic culture tubes (VWR), and the tubes were put in an ice bath at 4 °C. 1.609 mL of cofactor A and 322 μL of cofactor B were added to each tube, which were then mixed and kept at 4 °C.
Solution B - Rat Liver Microsome Solution
10.938 mL of 100 mM phosphate buffer was added to each of two ~45 mL plastic culture tubes (VWR), and the tubes were warmed to 37 °C on a Boekel Scientific Jitterbug shaker. 729 μL of rat liver microsomes were added to each of the tubes and mixed thoroughly.
Sample Dilution Buffer
10 mL of 0.5 M EDTA solution was added to 990 mL of the 100 mM phosphate buffer and was mixed thoroughly.
5 μM Sample/Standard Plate
Standards and samples were prepared at a concentration of 0.5 mM in DMSO. 10 μL of each of these samples (and standards) were transferred to a 2-mL, 96-well plate. To each well was added 990 μL of sample dilution buffer and the solutions were mixed thoroughly.
T20 Plate
100 μL of solution A (cofactor solution) was transferred to each well of a 1-mL, 96-well plate. To this plate was added 50 μL of each of the samples/standards from the 5 μM sample/standard plate. The plate was warmed to 37 °C on the Jitterbug shaker for approximately 10 minutes.
After warming to 37 °C, 100 μL of solution B (rat liver microsome solution) was added to each well and the plate was shaken at 37 °C on the Jitterbug shaker for 20 minutes incubation. After 20 minutes incubation, 500 μL of 4 °C acetonitrile was added to each well to quench the reaction.
T0 Plate
To each well of a 1-mL, 96-well plate was added 500 μL of 4 °C acetonitrile, 100 μL of solution A and 100 μL of solution B. To this plate was added 50 μL of each of the samples/standards from the 5 μM sample/standard plate. The plate was mixed thoroughly.
Preparation for LC-MS/MS
The T20 and T0 plates were centrifuged for 10 minutes at 3000 RPM. 500 μL of the supernatant from each well was transferred to a new 1-mL, 96-well plate. The plates were capped.
These samples were analyzed via UPLC-MS/MS. The QuanOptimize Application Manager was used for the automated optimization of the MS (multiple reaction monitoring (MRM) conditions for each compound.
LC system: |
Waters ACQUITY TQD System |
Column: |
ACQUITY UPLC BEH C18 Column 2.1 x 50 mm, 1.7 μm |
Column temp: |
40 °C |
Flow rate: |
600 μL/min |
Mobile phase A: |
0.1% Formic acid in water |
Mobile phase B: |
0.1% Formic acid in acetonitrile |
Gradient: |
5 to 95% B/1.3 min |
MS system: |
Waters TQD Detector |
Ionization mode: |
ESI Positive |
Capillary voltage: |
3200 V |
Source temp: |
150 °C |
Desolvation temp: |
450 °C |
Desolvation gas: |
900 L/hr |
Cone gas flow: |
50 L/hr |
Inter-scan delay: |
20 ms |
Inter-channel delay: |
5 ms |
Dwell: |
200 ms |
Acquisition range: |
100 to 1000 m/z |
The microsomal stability was determined using MassLynx Software’s ProfileLynx Application Manager. Relative amounts were calculated using a single point calibration, which compares the peak area of the analyte at time 0 minutes to that of the analyte at time 20 minutes to return a ratio.
Compounds were denoted as standard or analyte in Sample Type column of the sample list. The standard and analyte were linked in the sample list with the Compound A column.
In the ProfileLynx browser, the stability of the analyte is reported as a ratio of the peak area of the standard. Any stability values outside of a specified minimum and maximum range were automatically flagged within the ProfileLynx results browser (Figure 2). For this experiment, the minimum was set at 50 and the maximum at 100. The interactive browser allowed for the editing of peak integration. Peak assignments were easily changed and peak integrations were quickly optimized. Results were then exported in a format amenable to the corporate database.
The ProfileLynx Metabolic Stability Browser results for Doxepin (Figure 3) indicate that Doxepin is almost completely metabolized by the rat liver microsomes under these conditions with a stability of 0.003 (only 0.3% remaining). The compound results are highlighted in the browser, indicating that they are outside the range set in the method of 0.05 to 1.00.
The metabolic stability results for Tolazamide (Figure 4) demonstrate a compound that exhibits very little metabolism under the conditions used here. Nearly 99% (stability = 0.99) of the Tolazamide sample was remaining after incubation for 20 minutes.
The 27 compounds in our sample set were analyzed with a LC-MS/MS protocol including MS MRM parameter optimization, MS acquisition method creation, data acquisition, data processing, and report generation. The data generated from the variety of assays were all processed with the same software automatically. A single report was created for 18 compounds containing the stability results enabling the researcher to analyze results quickly, thus increasing laboratory throughput. Results are displayed in an interactive, graphical summary format based on sample or experiment.
During the determination of metabolic stability, it is important to have a high resolution LC system so that metabolites produced by the microsomes are resolved from the parent compound. Failure to achieve this may result in co-elution and overestimation of the amount of parent compound present if the metabolite is thermally labile and can convert to the parent compound in the MS source. The UPLC system provided very sharp peaks with a width in the region of 2 to 3 seconds at the base, thus generating a high resolution separation able to accurately quantify the peaks of interest and ensure that no overestimation of the drug concentration was made due to the thermal degradation of a chemical analogue in the MS source.
The use of UPLC-MS/MS had other considerable advantages over traditional methods, including LC/UV. The sensitivity of LC-MS/MS permitted the utilization of lower level incubations, consuming less material and more closely approximating therapeutic levels. The combination of the speed of UPLC and the specificity of MS/MS allowed for abbreviated chromatography with runtimes of two minutes or less (compared to up to 30 minutes for LC/UV), with a higher degree of assurance that similar compounds (metabolites) were differentiated. Faster results meant that metabolically unstable compounds could be eliminated or modified before in vivo animal pharmacokinetic evaluations.
Using the ProfileLynx and QuanOptimize applications allowed for:
720002611, May 2008