For research use only. Not for use in diagnostic procedures.
In this application note we present a comparison of two quantification methods for the MRM analysis of CRP in human serum following Top6/Top20 immuno-depletion.
Human serum is a rich medium for the discovery of prospective biomarkers. It is believed that serum contains tens of thousands of proteins spanning 10 to 11 orders of magnitude in protein abundance. However, 99 percent of the serum protein mass can be attributed to only 22 different high- and medium-abundance proteins. The inherent complexity and the large dynamic range of plasma proteome present a significant challenge to the discovery and quantification of low-abundance proteins in clinical plasma samples.
Because of its high sensitivity and specificity, the multiple reaction monitoring (MRM) method has received considerable attention in the area of protein quantification in complex biological fluids.
The Waters nanoACQUITY UPLC System improves the sensitivity of MRM analysis by delivering separated components at high peak concentrations to the nano-electrospray ionization source of the Quattro Premier XE Mass Spectrometer. In addition, the electrospray ionization efficiency increases at nL/min flow rates. As a result, the overall sensitivity of the MRM assay is better with nanoscale LC systems than with analytical scale HPLC systems.
Discovered in 1930 by researchers at the Rockefeller Institute for Medicinal Research, C-reactive protein (CRP) is a marker of inflammation or infection, which can increase up to 1000-fold after the onset of a stimulus. The native protein consists of five identical subunits maintained in a symmetric pentameric form by non-covalent interactions. Each subunit has the ability to bind two calcium ions, and the protein is known to bind small molecules and protein/RNA targets.
Under physiological conditions, the median concentration of CRP in human serum is 0.8 mg/L.1 Patients with serum CRP concentrations above 3 mg/L are considered to be at high risk for cardiovascular disease, hypertension and diabetes. Several mass spectrometry-based quantification methods for CRP in serum have been reported recently.2-4
LC system: |
Waters nanoACQUITY UPLC System |
Trap: |
Symmetry C18, 5 μm 180 μm x 20 mm |
Column: |
nanoACQUITY UPLC BEH 130 C18, 1.7 μm 75 μm x 100 mm |
Flow rate: |
300 nL/min |
Injection volume: |
5 μL (full loop injection mode) |
Column temp: |
35 °C |
Mobile phase: |
A: 0.1% Formic acid in water B: 0.1% Formic acid in acetonitrile |
Gradient: |
1 to 50% B over 30 minutes |
MS system: |
Waters Quattro Premier XE Mass Spectrometer |
Ionization mode: |
ESI+ |
Cone voltage: |
35 V |
Capillary voltage: |
2.8 kV |
Source temp.: |
90 °C |
MS mode: |
MRM MS1/MS2 |
Mass window: |
1 Da |
Dwell time: |
25 ms |
Collision energy: |
20 eV |
A 20 μL aliquot of normal human serum (Gemini Bio, Woodland, CA) was depleted of the six most abundant proteins: Top6 (albumin, IgG, anti-trypsin, IgA, transferrin and haptoglobulin) according to manufacturer’s specifications (Agilent, Palo Alto, CA). Another serum aliquot (80 μL) was depleted of twenty high abundance proteins: Top20 (albumin, IgGs, transferrin, anti-trypsin, fibrinogen, haptoglobin, acid-1 glycoprotein, plasminogen, a-2-macroglobulin, ceruloplasmin, apolipoproteins A1, A2, B, and complement C1, C3, and C4) using a ProteoPrep imuno-depletion cartridge (Sigma- Aldrich, St. Louis, MO).
Serum samples were denatured in 0.1% RapiGest reduced with 5 mM DTT, alkylated with 10 mM IA and digested with 1:50 (v/v) sequencing grade trypsin (Promega, Madison, WI) overnight (16 hr).
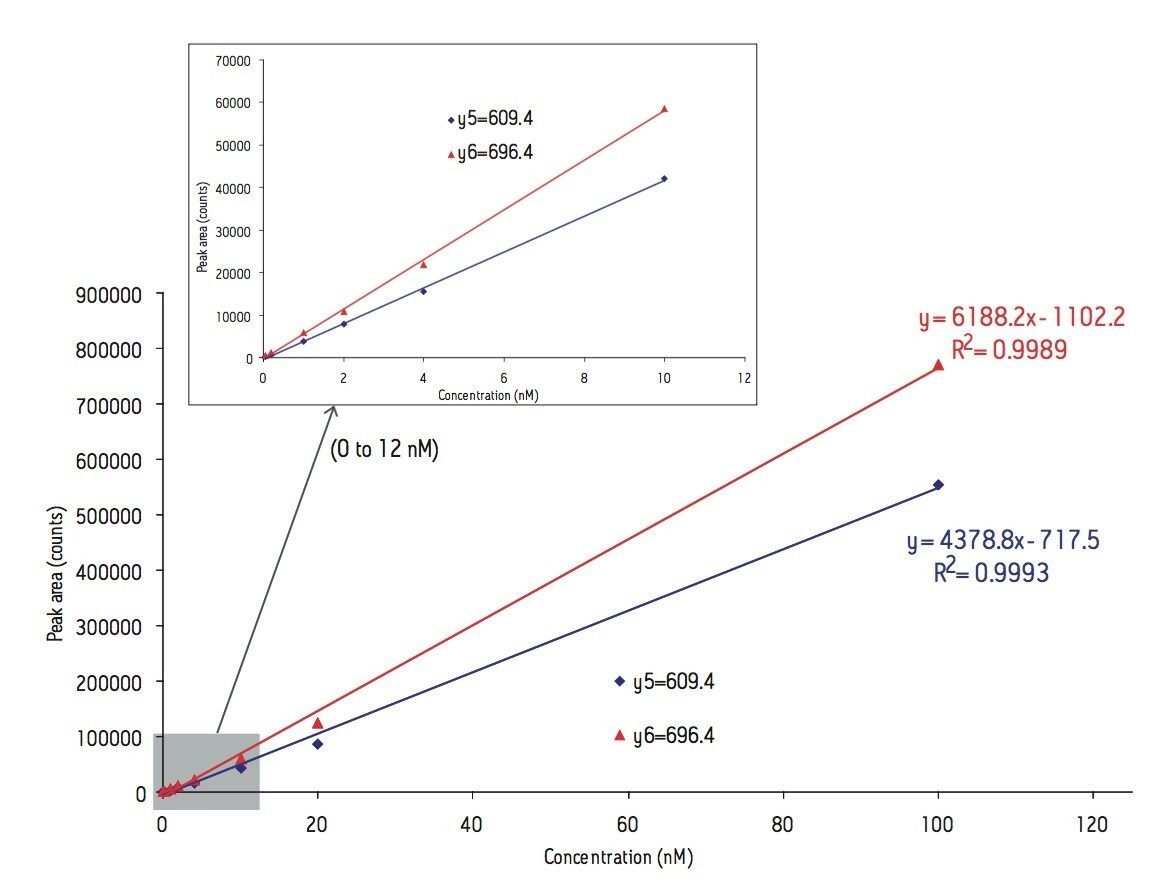
Recombinant C-reactive protein (US Biological, Swampscott, MA) was digested using the same protocol mentioned above and spiked in an undepleteted human serum digest at the concentration of 0.05, 0.2, 1, 2, 4, 10, 20, and 100 nM to build up an external calibration plot for quantitations.
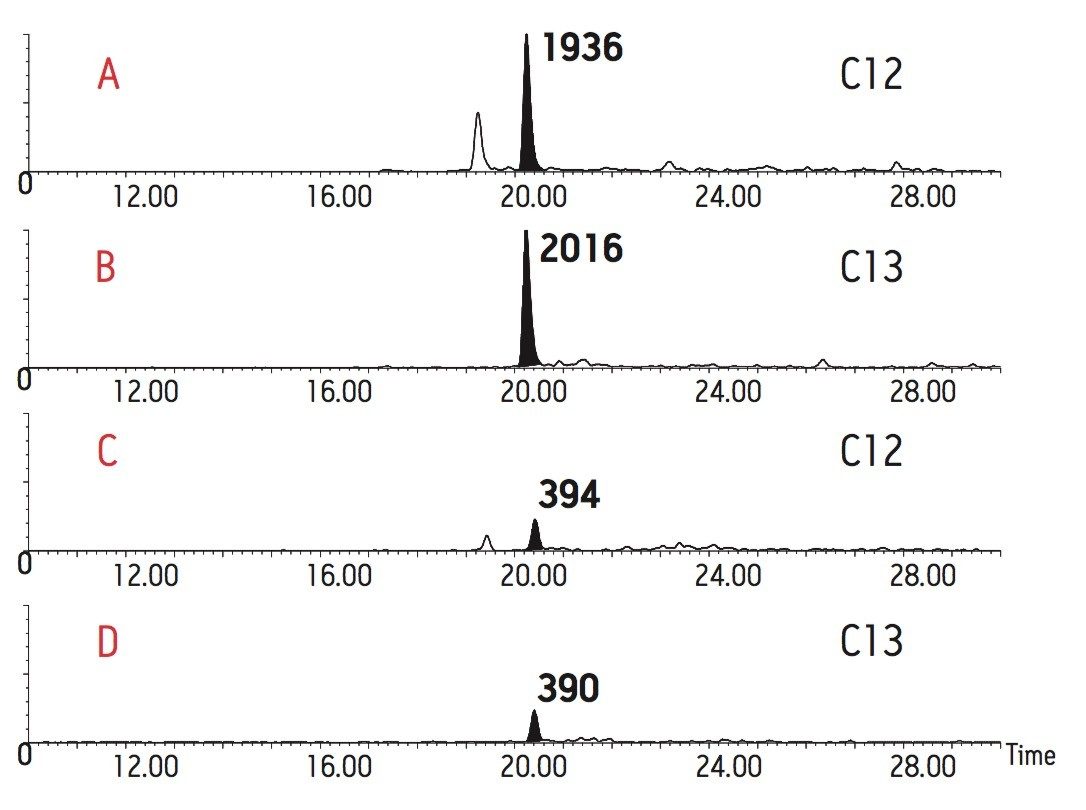
A synthetic peptide containing a 13C-labeled leucine and representing the sequence of T5 peptide from CRP (ESDTSYVSLK) was obtained from New England Peptide (Gardner, MA). It was spiked at two different concentration levels in the Top6 depleted serum digest (0.33 nM) and Top20 depleted serum digest (1 nM).
MRM assays were performed on the nanoACQUITY UPLC System coupled to the Quattro Premier XE Triple Quadrupole instrument.
The lowest detectable CRP concentration was 0.25 μg/L (0.01 nM) for samples spiked-in in 1 μM Glu Fib. This corresponds to 50 attomoles of CRP digest loaded on a 75-μm i.d. column (Figure 2). The RMS signalto- noise ratio for the chromatographic peak obtained by monitoring the m/z 564.7 → 696.4 transition of T5 peptide from CRP was 23 and the CV for 10 consecutive peak area measurements was 21%.
In the presence of the undepleted serum digest, the lowest detectable CRP amount was 250 attomoles. Figure 3 displays three replicate MRM chromatograms recorded for 0.05 nM of CRP digest spiked in an undepleted human serum digest. The peak area CV obtained for three consecutive measurements performed at the limit of quantification was 7.5% and the RMS S/N was 20.
Serum samples were processed to enrich low-abundance proteins through the selective removal of Top6 or Top20 most abundant proteins using commercially available immuno-depletion kits. The CRP concentration was measured using the external calibration plot shown in Figure 4. Alternatively, CRP concentration was also measured using a spiked 13C labeled T5 peptide containing an isotopically labeled leucine. The MRM chromatograms obtained for spiked Top6 and Top20 depleted digest are presented in Figure 5.
The MRM absolute quantification of proteins is based on the assumption that a particular tryptic peptide is a stoichiometric representative of the protein from which is cleaved. Using this method, proteins are normally quantified by either spiking-in a known amount of synthetic stable isotope-labeled peptides as internal standards or using an external calibration plot established from a prior analysis on a set of known concentrations of a tryptically digested protein added in the biological fluid digest.
C-reactive protein, a diagnostic marker for rheumatoid arthritis,2, 5 known to be present at a median concentration of 0.8 mg/L1 in human serum, was quantified using an external standard calibration method and using an internal standard 13C labeled peptide.
T5 peptide (ESDTSYVSLK) was identified as the best responding peptide in ESI-MS analysis, based on the information provided by the LC-MSE analysis of the recombinant CRP digest performed on a Q-Tof Premier instrument coupled to a nanoACQUITY UPLC System. Collision energy and cone voltage were further optimized on the Quattro Premier XE Mass Spectrometer to enhance the MRM signal intensity for the best two transitions: m/z 564.7 → 696.4 (y6) and 564.7 → 609.4 (y5).
In the absence of the interfering chemical matrix produced by the serum digest, the lowest detectable CRP concentration was 0.25 μg/L (or 50 attomoles of CRP digest on column), as shown in Figure 2.
CRP at the normal physiological level was not detected in the undepleted serum, but was detected in both Top6/Top20 depleted samples. The limit of quantification for CRP in human serum was found to be 1.25 μg/L. This corresponds to 250 attomoles of protein digest loaded onto a 75 μm i.d. column (see Figure 3). Peak areas shown in this figure for three replicate injections indicate a very good reproducibility of the MRM assay even at the limit of quantification (peak area CV was 7.5%).
The calibration plot obtained for the CRP digest spiked in undepleted serum digest is displayed in Figure 4. The calibration curve is linear over three orders of magnitude for CRP concentrations in the range of 0.05 to 100 nM.
The slopes of the calibration plots for two T5 transitions were close to 1, indicating very good linearity.
The CRP concentration measured using the external standard calibration plot was used to calculate the appropriate levels of the spiking-in 13C labeled T5 in Top6/Top20 depleted samples, as shown in Figure 5. CRP concentration in serum was then calculated using the single point measurement provided by the 13C internal standard, assuming that the endogenous T5 peptide from CRP has the same response factor as the labeled peptide.
Table 1 shows a comparison of CRP concentrations measured in depleted human serum using these two quantification methods. The column labeled 13C IS corresponds to the internal standard quantification method and the CRP calib method is the external standard method based on spiking known amounts of CRP digest in undepleted serum. The CRP levels measured by these two quantification methods agree within 20%.
720002177, May 2007