UPLC has been widely accepted due to the improvements over HPLC in sensitivity, resolution, and speed. For applications such as impurity and metabolite profiling, methods developed with UPLC Technology must be transferred to the preparative scale.
The use of focused gradients allowed for maximum loading while minimizing total cycle time for preparative HPLC
UltraPerformance LC (UPLC Technology) has been widely accepted due to the improvements over HPLC in sensitivity, resolution, and speed. For applications such as impurity and metabolite profiling, methods developed with UPLC Technology must be transferred to the preparative scale in order to isolate and purify desired compounds for further characterization.
Therefore, a systematic approach for transferring UPLC separations to the preparative scale was developed. Key parameters to consider include: column chemistry, particle size and dimension, injection volume, separation temperature, mobile phase composition, flow rate, gradient slope, cycle time, detector sensitivity, injector design, and system volume (both UPLC and preparative HPLC). Step-by-step calculations are included for a better understanding of evaluating method transfer validity. In addition, optimization of the preparative HPLC separation for impurity isolation and purification is discussed.
Instrument: |
ACQUITY UPLC System with PDA |
Column: |
ACQUITY UPLC BEH C18, 2.1 x 50 mm, 1.7 μm p/n: 186002350 |
Mobile phase A: |
10 mM NH4HCO3, pH 10.0 |
Mobile phase B: |
ACN/100 mM NH4HCO3, pH 10.0 (90/10) |
Flow rate: |
1.0 mL/min |
Inj. Volume: |
2 μL (partial loop; 5 μL sample loop) |
Sample: |
38 μg/mL total concentration in DMSO (compounds shown in Figure 1) |
Column temp.: |
Ambient |
Gradient: |
5-95% B in 2 min, hold at 95% for 1 min, reset, 5 min total run time |
Strong wash solvent: |
90/10 ACN/H2O |
Weak wash solvent: |
5/95 ACN/H2O |
Detection: |
245 nm |
Sampling rate: |
20 pts/sec |
Columns: |
ACQUITY UPLC BEH C18, 2.1 x 50 mm, 1.7 μm p/n: 186002350 XBridge Prep C18 OBD, 19 x 150 mm p/n: 186002979 |
Mobile phase A: |
10 mM NH4HCO3, pH 10.0 |
Moble phase B: |
ACN |
Sample: |
2 mg/mL degraded ranitidine (see text) |
Column temp.: |
Ambient |
Detection: |
235 nm |
Sampling rate: |
20 pt/sec (UPLC); 1 pt/sec (prep HPLC) |
Dwell volume: |
5.4 mL (prep system with 5 mL loop) |
Gradient, injection volume, and flow rate are indicated on chromatograms.
To maintain resolution, the ratio of column length (L) to particle size (dp) must remain constant. For example, the following columns have the same resolution:
50 mm (L)/1.7 μm (dp) = 29,412
100 mm (L)/3.5 μm (dp) = 28,571
150 mm (L)/5 μm (dp) = 30,000
Based on this calculation, an XBridge Prep C18 OBD, 19 x 150 mm, 5 μm column was chosen for scaling up the UPLC separation shown in Figure 2A. Since the same base particle is used for both XBridge and ACQUITY UPLC BEH Columns, selectivity remains constant.
where Vol is the injection volume (μL), D is the inner diameter of the column (mm), and L is the column length (mm). A 2 μL injection on a 2.1 x 50 mm UPLC column corresponds to a 491 μL injection on a 19 x 150 mm preparative column.
Geometic Scale-up
Based on column dimensions, the following equation is used to geometrically scale flow rate:
where F is flow rate (mL/min). A 1.0 mL/min flow rate on a 2.1 mm i.d. column equates to an 81.9 mL/min flow rate on a 19 mm i.d. column. However, this flow rate is not reasonable for the 19 x 150 mm column dimension. Typical flow rates are in the 15–40 mL/min range.
Since optimal flow rate is inversely proportional to particle size (dp), we can use the following equation to calculate the proper flow rate for the preparative column:
Using this equation, a 1.0 mL/min flow rate on a 2.1 mm i.d., 1.7 μm UPLC column corresponds to a 27.8 mL/min flow rate on a 19 mm i.d., 5 μm preparative column.
The differences in dwell volume (also called system volume) between the ACQUITY UPLC System and Preparative HPLC System will result in retention time shifts. The dwell volume of any system is defined as the volume between the pump and the column inlet. In order to properly scale from UPLC to the preparative scale, one must compensate for this dwell volume by introducing an initial hold time at the start of the preparative gradient(1).
Measured dwell volume = 0.105 mL (5 μL sample loop)
Volume of a 2.1 x 50 mm UPLC column = 0.173 mL
Dwell volume (mL)/column volume (mL) = column volumes
0.105 mL/0.173 mL = 0.607 column volumes (c.v.)
The ACQUITY UPLC System used for this work has a dwell volume of 0.607 c.v.
Measured dwell volume = 2.6 mL (1 mL sample loop)
Volume of 19 x 150 mm preparative column = 42.53 mL
2.6 mL/42.53 mL = 0.061 c.v.
The Preparative HPLC System has a dwell volume of 0.061 c.v.
0.607 c.v. – 0.061 c.v. = 0.546 c.v.
0.546 c.v. x 42.53 mL (c.v. of prep column) = 23.22 mL
This is also the initial hold volume
Hold time = Initial hold volume/flow rate
= 23.22/27.8 mL/min
= 0.83 minutes
This initial hold is programmed before the start of the preparative gradient to compensate for the volume difference between the UPLC and Preparative HPLC Systems.
In order to properly scale from UPLC to preparative HPLC, column volumes must remain constant for each segment of the gradient.
Below is an example of how to calculate the duration of a gradient segment in column volumes:
Segment duration = segment duration in min x flow rate/column volume
Segment duration = 2 min x 1.0 mL/min/0.173 mL = 11.56 c.v.
To preserve the separation profile, the UPLC segment durations need to be maintained in the preparative HPLC gradient table.
Gradient segment volume = duration in c.v. x column volume
Gradient segment volume = 11.56 c.v. x 42.53 mL = 491.65 mL
Gradient segment time = segment volume/flow rate
Gradient segment time = 491.65 mL/27.8 mL/min = 17.67 min
Since the first gradient segment is 17.67 min long, and the initial hold time is 0.83 min, the ending time for the segment is 0.83 min + 17.67 min, or 18.50 min.
Using these same calculations for gradient segment volume and gradient segment time for the remaining segments in the UPLC gradient table, the gradient table for the preparative HPLC run can be completed. The scaling comparison between UPLC and Preparative HPLC can be found in Figure 2.
It is clear from Figure 2 that the scaling procedure was successful for transferring the UPLC separation of 5 standard basic compounds. Relative retention times and resolution between peaks was almost identical on both the UPLC column and preparative HPLC column.
However, total cycle time of the preparative separation can be optimized by using a shorter length column. This will also help to decrease mobile phase usage, backpressure, and final volume of collected fractions. By slightly increasing the flow rate from 27.8 to 30.0 mL/min, and using a 50 mm length column instead of a 150 mm length column, the preparative HPLC separation can be optimized for faster cycle times. Using the calculations described previously for initial hold time and gradient segment duration, a new gradient table can be formulated:
Figure 3 shows the separation of the standard mixture on UPLC (A) and on the 19 x 50 mm preparative Column (B). Again, resolution and relative retention times are similar, as in Figure 2. However, cycle time on the 50 mm length column is now 14 minutes instead of 45 minutes (150 mm long column). Figure 4C shows what the overloaded chromatogram looks like for purification of 190 mg of total material on the 50 mm length preparative column. The maximum amount of material that could be loaded onto the 19 x 50 mm Column was determined in a separate loading study (data not shown).
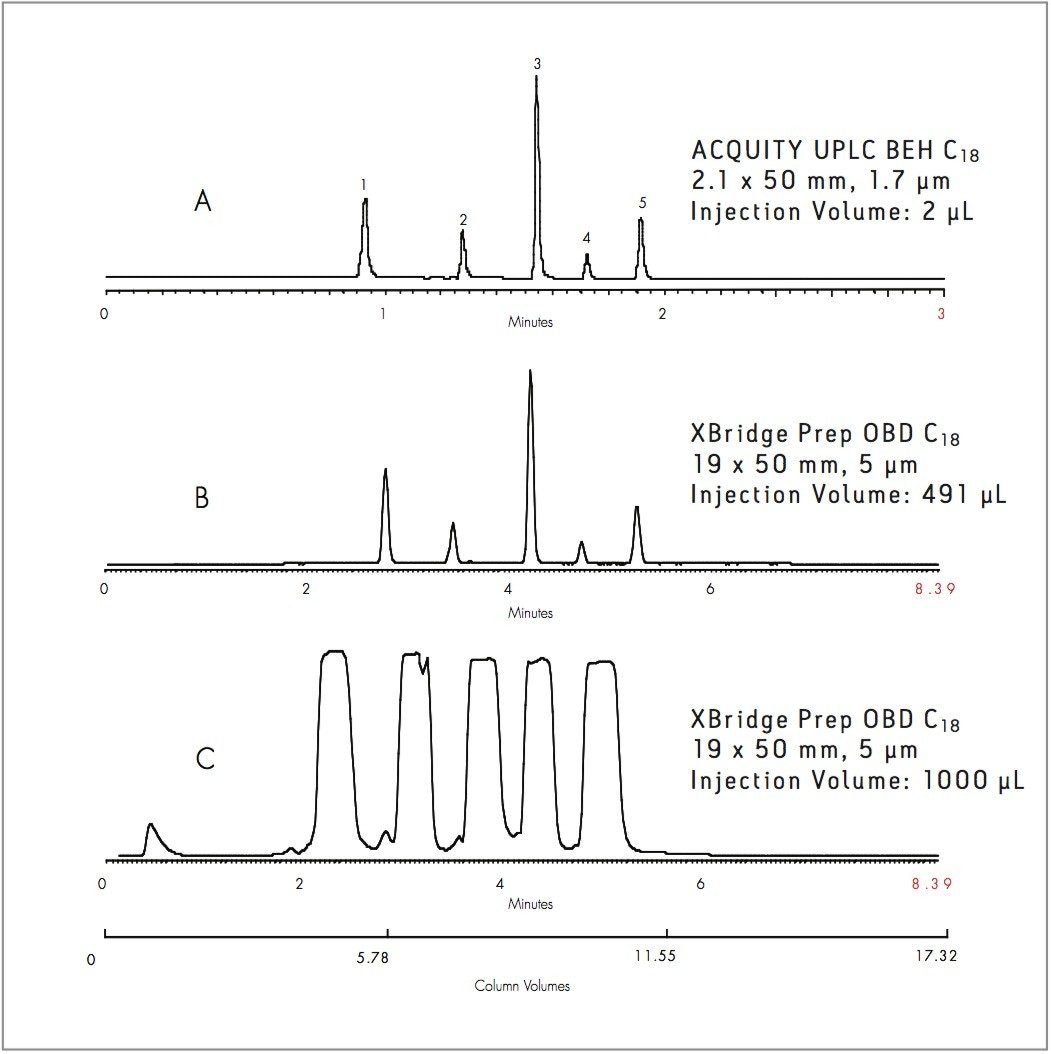
Separation and subsequent scale-up purification of very complex mixtures is more challenging. Crucial parameters in the success of these applications include: (a) maintaining baseline resolution between closely eluting peaks under high mass loading conditions, (b) effectively scaling up the separation so that it is identical to the UPLC separation, and (c) collecting and re-analyzing each fraction to ensure high purity of isolated components.
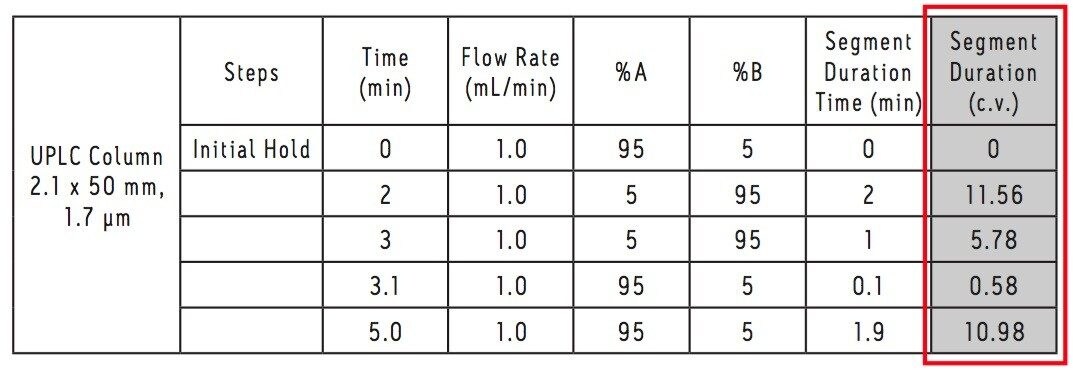
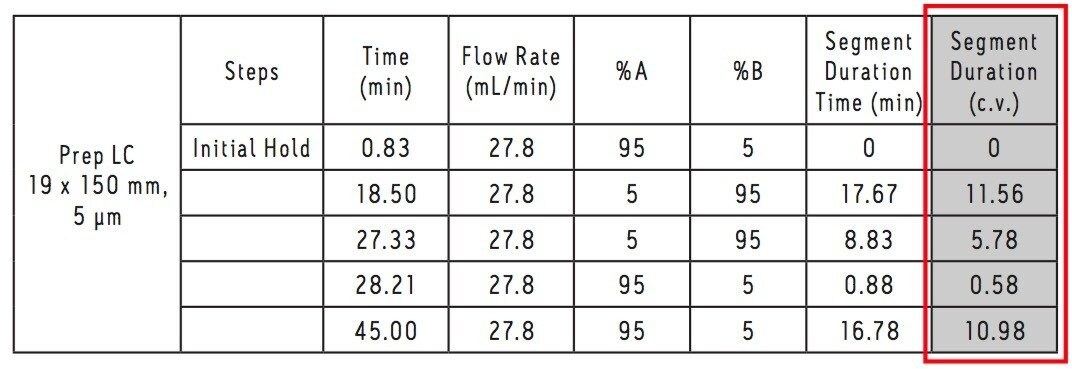
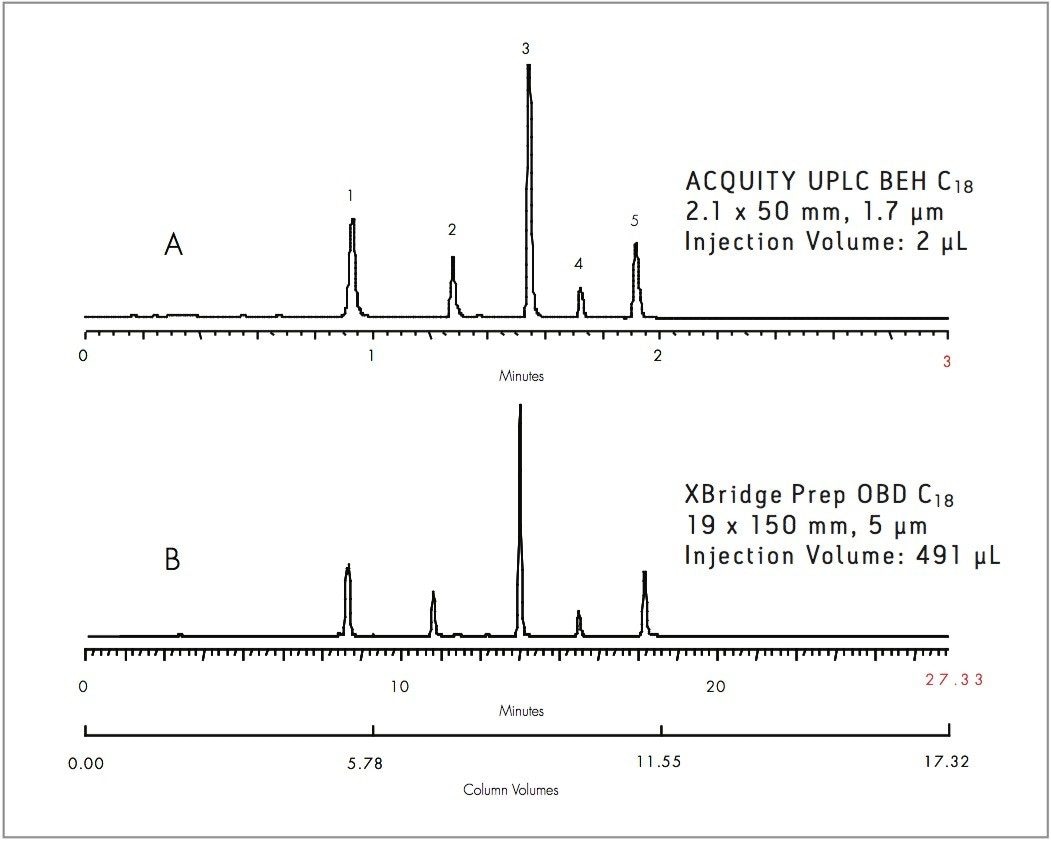
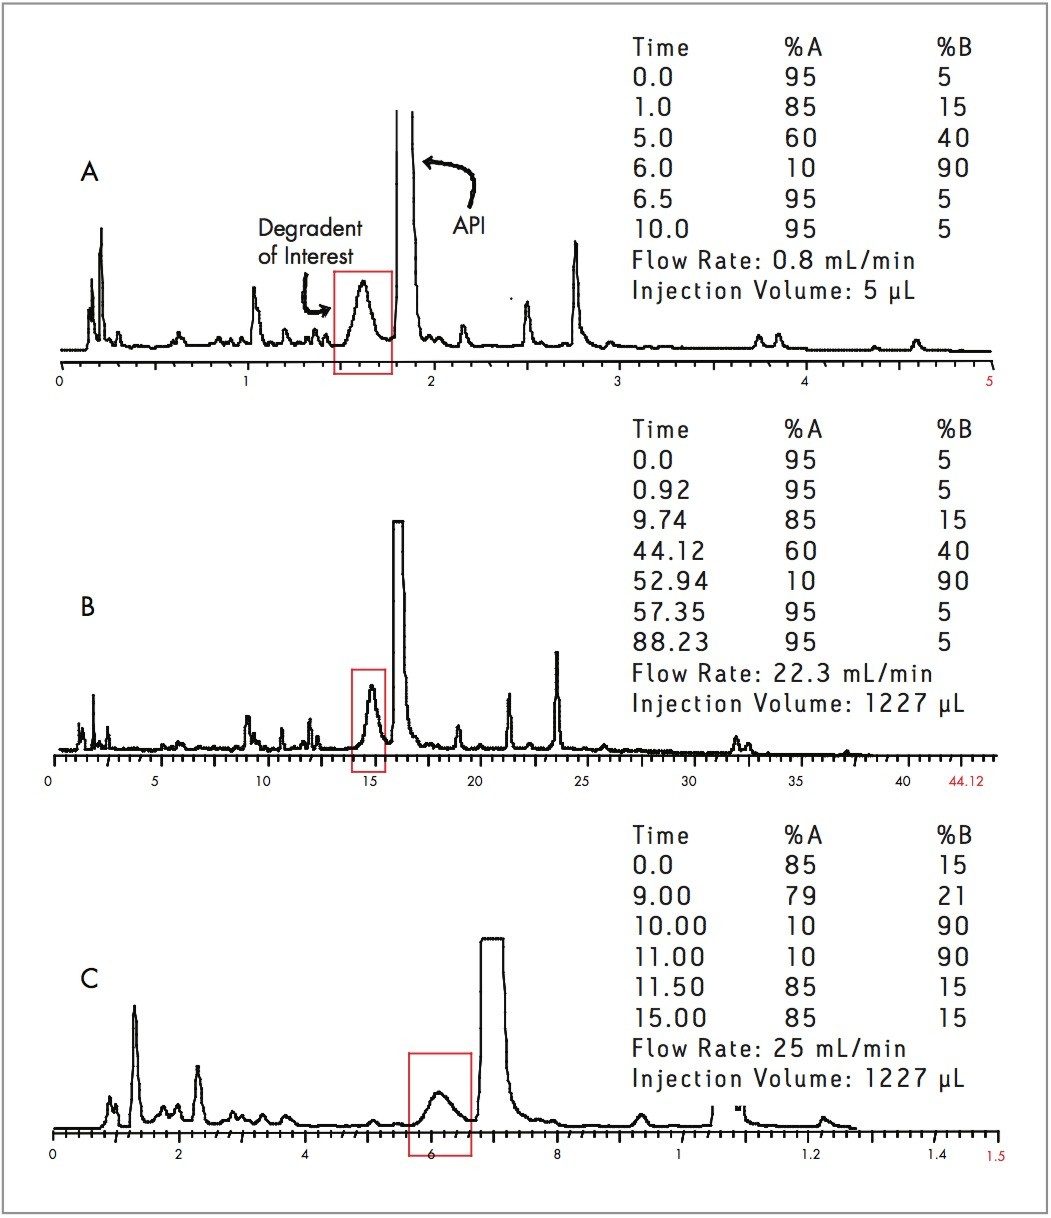
Ranitidine, the active pharmaceutical ingredient (API) in Zantac, was degraded by heating a 2 mg/mL standard solution in MeOH/H20 (20/80) for 48 hours at 85 °C. A UPLC method was developed to separate all impurities and degradants from the API (Figure 4A). The method was then transferred to a 19 x 150 mm, 5 μm XBridge Prep C18 OBD Column to demonstrate that the separation is linearly scaled between both instrument platforms (Figure 4B). Resolution of the highlighted degradant from the API was maintained at the preparative scale, but total cycle time was almost 90 minutes.
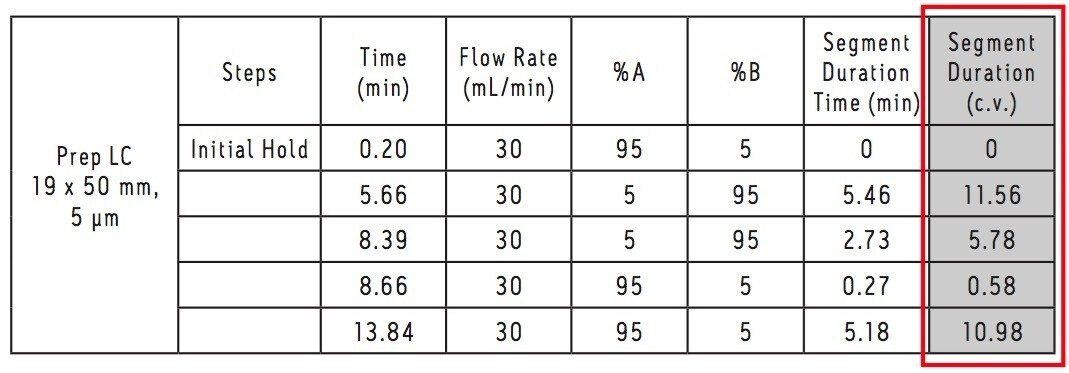
To optimize the cycle time, a focused gradient was developed on the 19 x 150 mm Column(1,2). Figure 4C shows the optimized separation of the highlighted degradant from the API. This particular peak was collected, re-analyzed, and shown to have a purity >99% by UV.
Focused gradients not only provide better resolution between closely eluting peaks, but also help to reduce overall cycle time.
A systematic approach for transferring separation methods developed on UPLC Technology to preparative HPLC was presented. Key factors include adjusting the flow rate for particle size, calculating system volume differences, and scaling the gradient so that column volume is kept constant. In addition, the use of focused gradients allowed for maximum loading while minimizing total cycle time for preparative HPLC. Since XBridge Prep OBD Columns are built on the same base particle as ACQUITY UPLC BEH Columns, UPLC can be used for rapid method development of preparative separations. Subsequently, these methods can be easily transferred from UPLC to preparative LC systems.
720002375, October 2007