• Application Note

High Throughput QC Screening of Synthetic Compounds using UPLC oa-TOF MS

High Throughput QC Screening of Synthetic Compounds using UPLC oa-TOF MS

  • Davy Petit
  • Alain Fauconnier
  • Jehan Claessens
  • Hans Vissers
  • Jan Claereboudt
  • Ashley Sage
  • Joanne Cardwell
  • Waters Corporation
  • UCB Pharma
Group of technicians working in laboratory

Abstract

This application note evaluates the performance of a UPLC oa-ToF MS system for the high throughput QC screening of pharmaceutical-like synthetic compounds. The overall result is a UPLC oa-ToF MS system providing a very powerful analytical platform for high throughput screening applications.

Benefits

  • High throughput QC screening of pharmaceutical-like synthetic compounds
  • UPLC oa-ToF MS system provides a very powerful analytical platform for high throughput screening applications

Introduction

Generic or standard chromatographic methods in combination with orthogonal acceleration time-of-flight (oa-ToF) mass spectrometry have become critical tools for use in high-throughput QC screening of synthetic medicinal compounds. Short analysis times are often employed due to the high sample numbers required for fast lead discovery strategies. Over recent years, the combination of LC and ToF MS has proven to be a suitable analytical technique to address these needs. Furthermore, the technique provides mass accuracy within 5 ppm of the actual value which is required for journal publication, patent submission and accurate structural identification via elemental composition calculations.

The use of more conventional techniques such as NMR cannot address these high throughput analytical needs due to relatively poor sensitivity, high sample purity requirement, necessity of operator expertise and the use of costly solvents. To simplify and streamline the analytical procedures, automation in combination with open access is a key factor for this type of application.

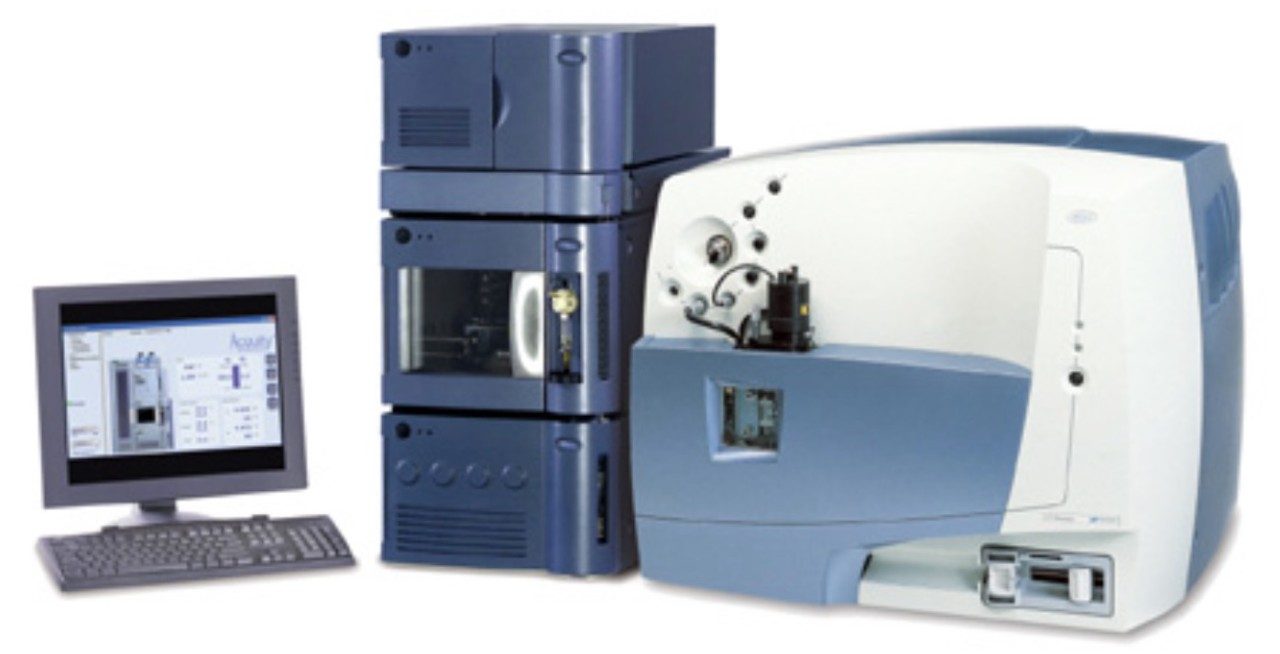
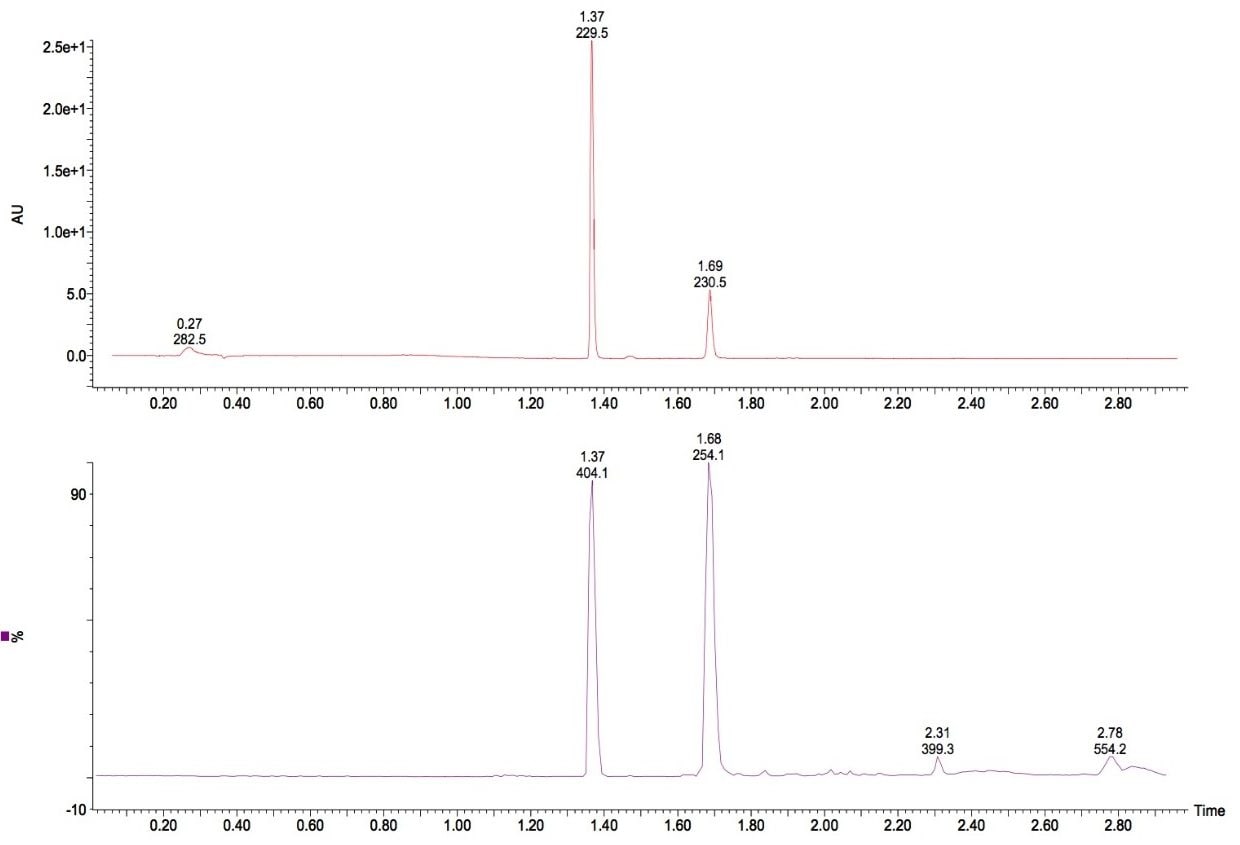
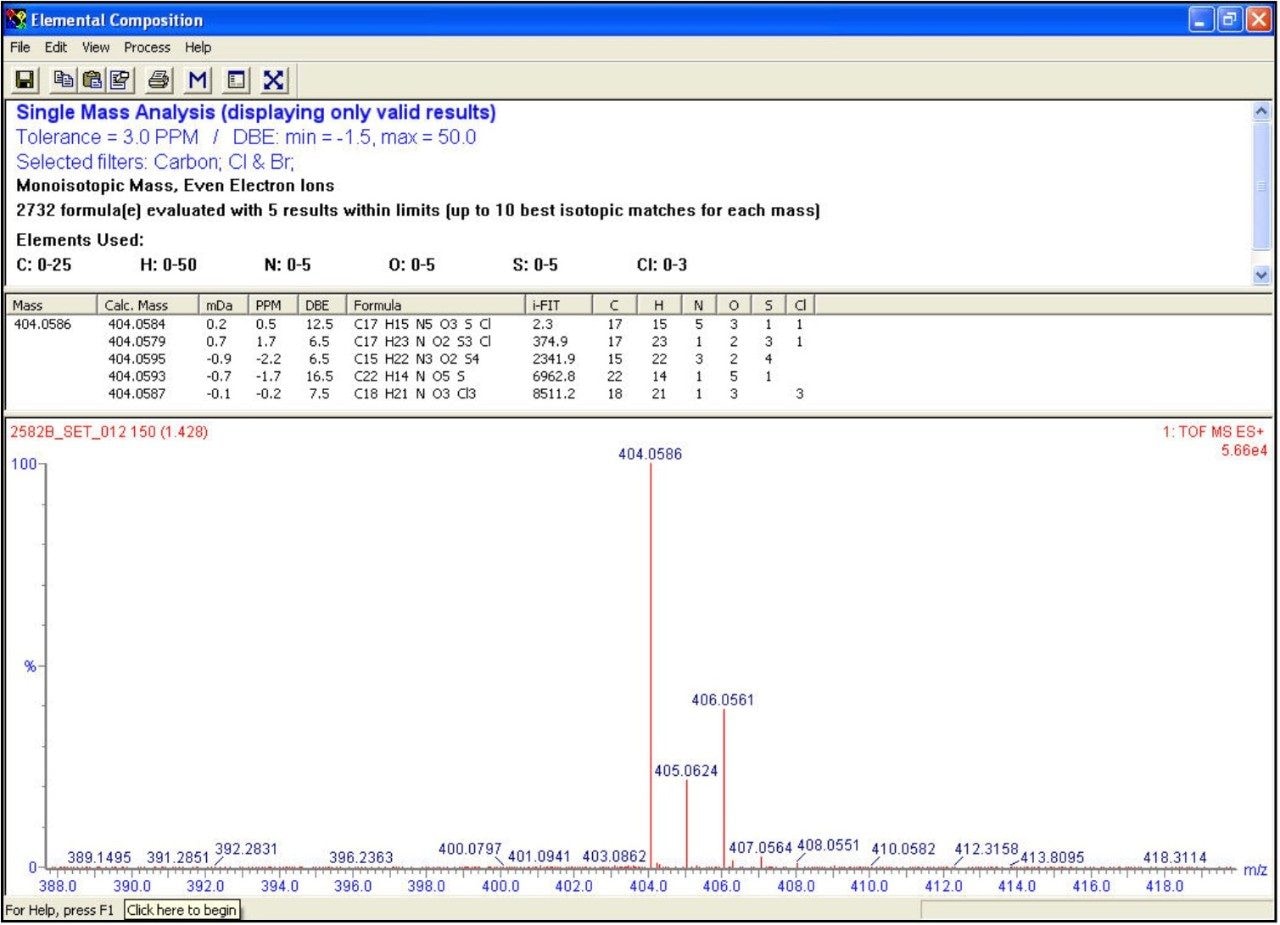
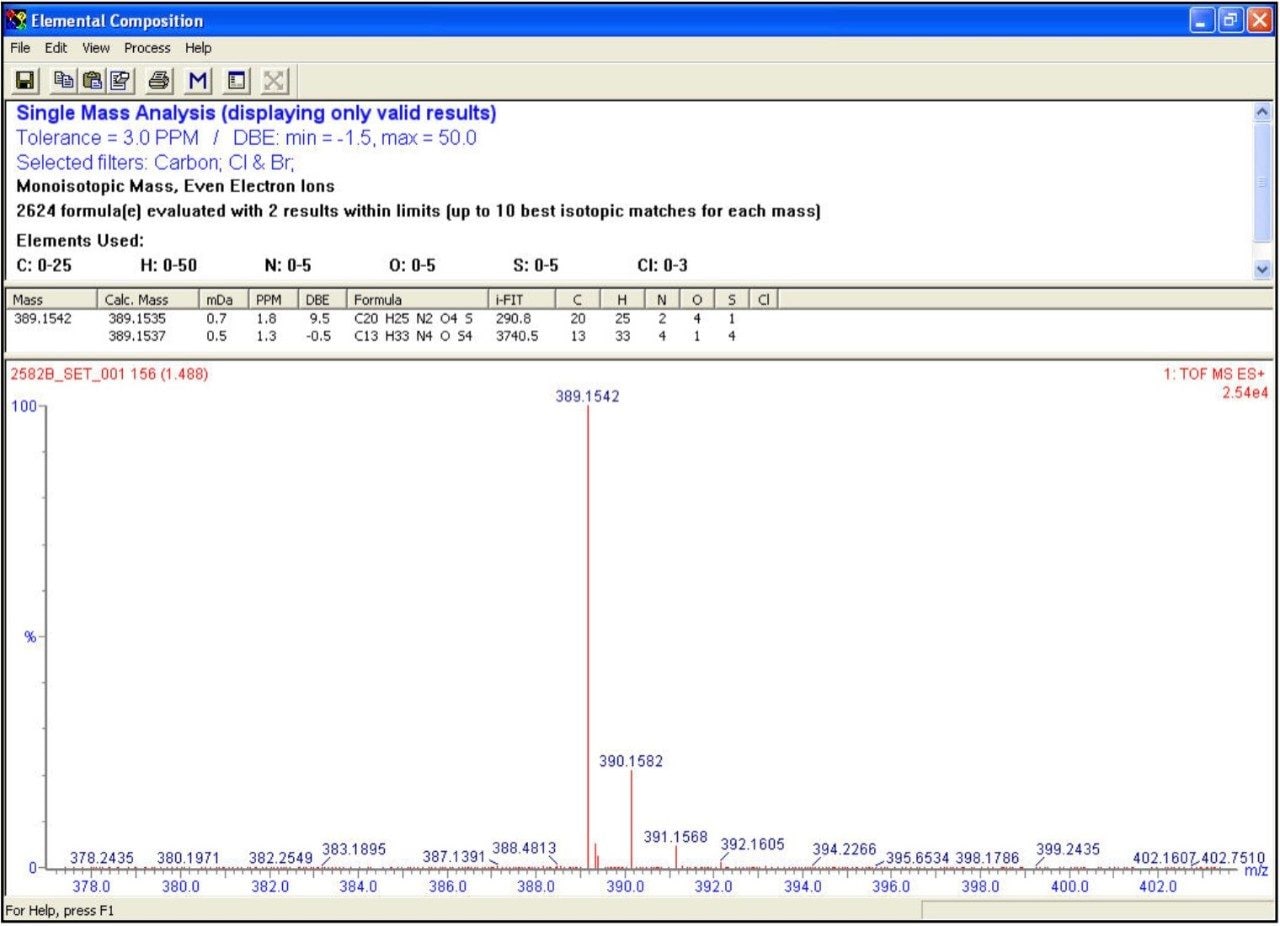
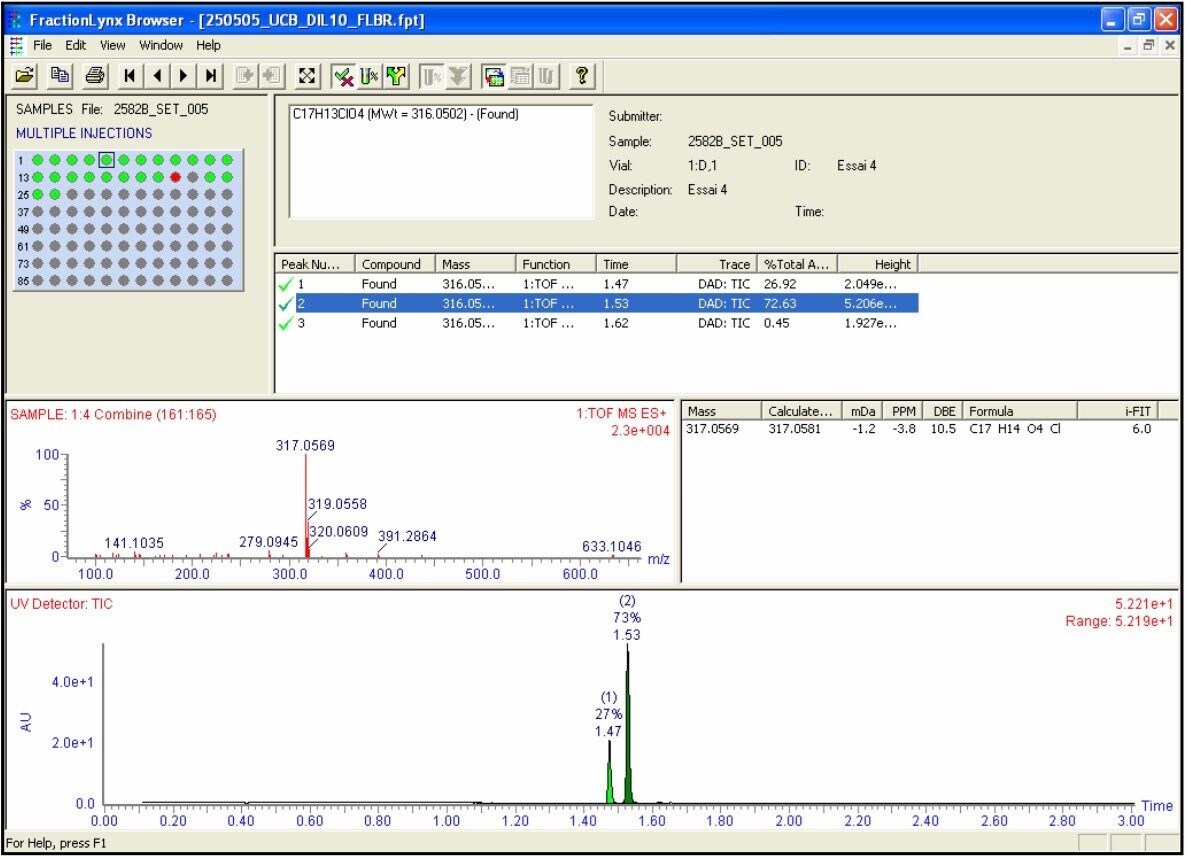
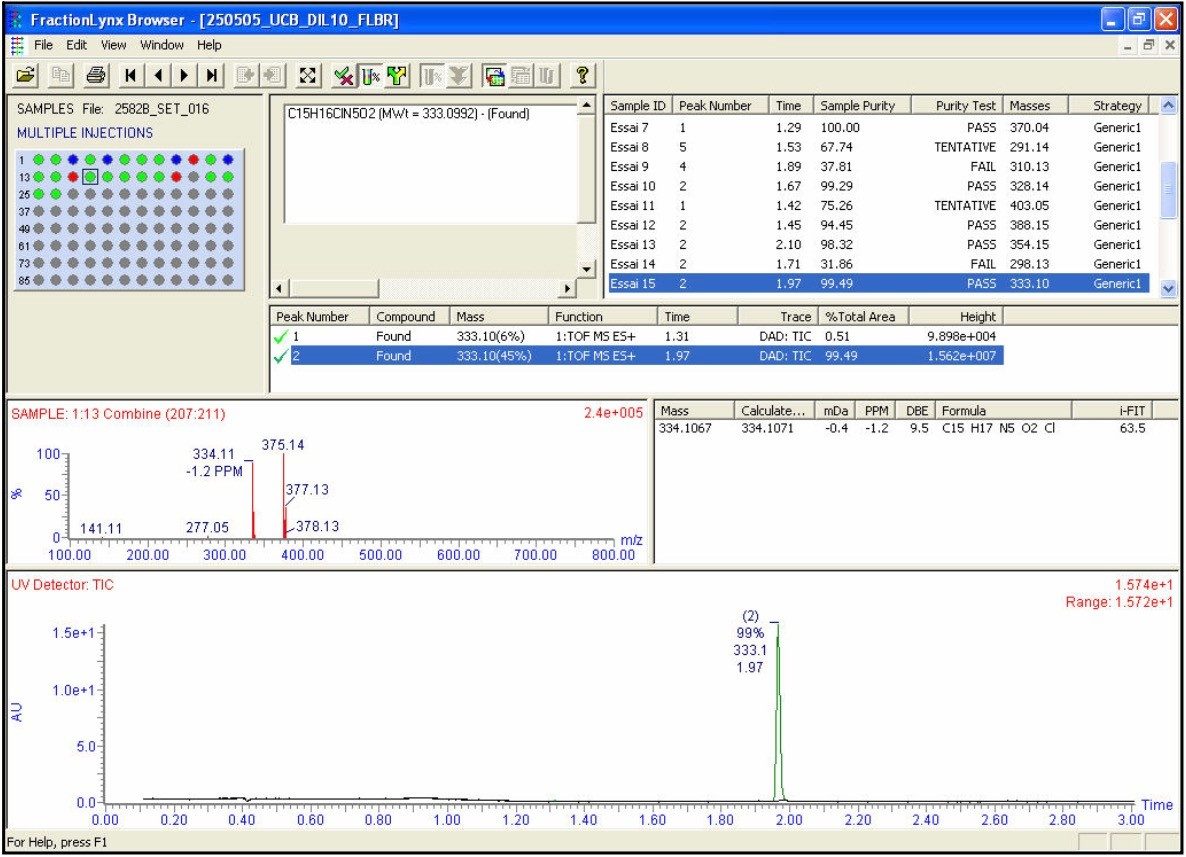
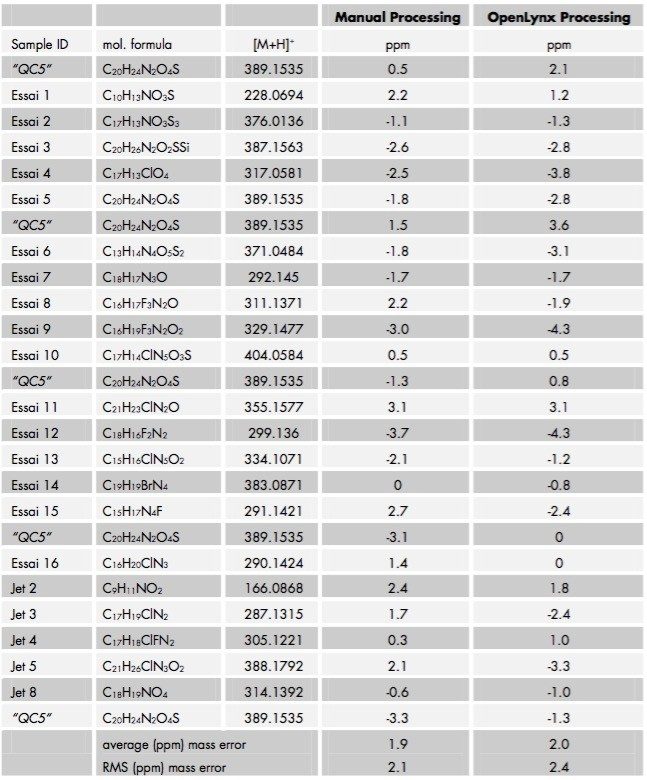
A fast, generic liquid chromatographic method at high pH has been designed to provide excellent selectivity for the investigation of basic compounds without compromise of either chromatographic resolution or speed of analysis. To obtain such an analytical method, Ultra Performance LC (UPLC) in conjunction with oa-ToF MS detection has been employed. With this analytical system, identification of the anticipated samples, isomers and possible impurities with mass accuracy deviations less than 5ppm from the actual were obtained using LockSprayTM. With such high accuracy data, the calculation of elemental compositions for each of the analytes was possible. Subsequent elemental composition results were produced using MassLynx i-FIT algorithm which takes into account the distribution of the spectral isotopes for the compounds of interest, and employs novel data interpretation to simplify results lists returned. To simplify and speed-up the processing of the sample batch, OpenLynx Application Manager was also utilized for fully automated QC of the compounds analyzed. Results were calculated for sample purity by UV, exact mass and elemental composition

The Waters ACQUITY UPLC System and Waters Micromass LCT Premier Mass Spectrometer.

Experimental

All samples were analyzed using a Waters Micromass LCT Premier mass spectrometer equipped with a dual electrospray (ESI) LockSpray ion source. Leucine Enkephalin was used as the reference mass compound during all ESI-MS exact mass experiments and introduced via the LockSpray channel using a Waters Reagent Manager. The ToF analyzer was calibrated with cluster ions of sodium formate. Data were acquired in positive ESI at spectral resolution of >10,000 FWHM with the extended dynamic range functionality provided by the LCT Premier instrument.

The mass spectrometer was connected to a Waters ACQUITY UPLC system with PDA detection. Highest separation efficiency is normally obtained at optimum HETP, which is at a higher linear velocity for 1.7 µm UPLC particles compared to more conventional 3 µm HPLC stationary column packing. The gradient was therefore scaled in proportion to the flow and gradient of a traditional HPLC separation of basic synthetic medicinal compounds, which was from 5 to 85% B in 2.35 min at 0.4 mL/min. The injection to injection cycle time was 3.75 min. Mobile phase A comprised 395 mg/L NH4HCO3 + 250 µL NH4OH 30% and mobile phase B was CH3CN/mobile phase A (90/10, v/v) The column used during this study was a BEH 2.1 x 50 mm, 1.7 µm column, maintained at 55 °C.

All samples were obtained as solids or oils in 2 mL vials containing approximately 0.3 mg of sample and reconstituted with 1.5 mL of CH3CN/H2O (75/25, v/v). The sample solutions were vortexed for 20 seconds until a clear solution was obtained. The samples were diluted a further 10-fold with CH3CN/H2O (75/25, v/v) prior to LC-PDA-MS analysis.

Results and Discussion

The first example is shown in Figure 1a, illustrating the PDA total absorbance chromatogram in the top trace and the base peak intensity chromatogram in the lower trace. The exact mass and elemental composition of the peak eluting at 1.37 was determined by means of manually processing of the data. The elemental composition report is given in Figure 1b. 

PDA total absorbance chromatogram (top) and BPI (Base Peak Intensity) chromatogram of sample “Essai 10.”
Figure 1a. PDA total absorbance chromatogram (top) and BPI (Base Peak Intensity) chromatogram of sample “Essai 10.”
 Elemental composition report of compound eluting at tr 1.37 min
Figure 1b. Elemental composition report of compound eluting at tr 1.37 min at Figure 1a.

Based on mass accuracy only, C18H21NO3Cl3 (-0.2 ppm) would have been the most likely elemental composition for this compound. However, as the isotopic distribution of the acquired spectrum closely matches the theoretical distribution of C17H15N5O3SCl (0.5 ppm) the latter correct composition was assigned. This resulted in better ranking by i-FIT, which is shown by the higher probability - expressed as lower value - in the elemental composition table. Also shown in the chromatogram is an isomeric form of the main compound eluting at 1.69 min. With such a short gradient run-time, this level of chromatographic resolution is only obtainable through the use of UPLC.

Another example is shown in Figures 2a and 2b. The displayed information and algorithms used are similar as shown for the previous example. The elemental composition algorithm would have assigned C13H33N4OS4 (1.3 ppm) as the correction composition. However, the i-FIT algorithm ranked C20H25N2O4S (1.8 ppm) higher based on the observed 32S and 34S isotopic distribution. Also note the high quality of the chromatographic separation shown by the base line separation of a small impurity eluting at 1.34 min.

PDA total absorbance chromatogram and BPI chromatogram of sample “Essai 5.”
Figure 2a. PDA total absorbance chromatogram (top) and BPI chromatogram of sample “Essai 5.”
 Elemental composition report of compound eluting at tr 1.4 min
Figure 2b. Elemental composition report of compound eluting at tr 1.4 min at Figure 2a.

The OpenLynx application manager was used to QC a set of 21 real samples and 5 QC controls. The assay was setup with QC checks based on sample “QC5” (C20H24N2O4S, [M+H]+ = 389.1535). The QC checks were conducted every fifth injection to facilitate full control and verification of the total LC-MS system stability and robustness. An example of the OpenLynx browser output is shown in Figures 3a and 3b. Figure 3a shows the identification view with details on the exact measurement and i-FIT elemental composition conformation. The top left Pane - confirmation view – shows the autosampler bed layout with the identified samples in green.

In this example, two isobaric compounds were positively identified eluting at 1.47 and 1.53 min, respectively. Figure 3b shows the purity view with QC selection based on UV purity. The top left pane shows the autosampler bed layout again with the pure sample labeled in green (purity greater > 80%). Blue labeled spots are tentative identifications (60% < purity greater <80%) and red ones are failed samples.

OpenLynx Browser user interface showing the identification view with elemental composition details
Figure 3a. OpenLynx Browser user interface showing the identification view with elemental composition details. Top left pane: green dots are indicating positive found samples.
OpenLynx Browser user interface showing the UV-PDA purity QC view
Figure 3b. OpenLynx Browser user interface showing the UV-PDA purity QC view. Top left pane: showing green dots (purity greater > 80%). Blue labeled dots are tentative identifications (60% < purity greater <80%) and red ones are failed samples.

In order to assess the performance of the OpenLynx application manager for exact mass measurement determination, all samples analyzed were processed manually. Table 1 provides a comprehensive overview of all the exact mass data obtained for all samples. As can be seen from the results, both data sets are consistent and the average mass errors for all 26 runs are well below 3 ppm providing high levels of accuracy and thus a high degree of confidence in the data.

Table summarizing mass measurement errors through manual processing and through automated reporting in OpenLynx.
Table 1. Table summarizing mass measurement errors through manual processing and through automated reporting in OpenLynx. 

Conclusion

The aim of this application note was to evaluate the performance of a UPLC oa-ToF MS system for the high throughput QC screening of ‘pharmaceutical-like’ synthetic compounds. The introduction of UPLC as a separation technique provides analysts with the ability to drive analytical runtimes down without any compromise in chromatographic resolution that would have normally been seen with HPLC. The use of high performance oa-ToF mass spectrometers with enhanced spectral resolution allows exact mass measurements to be generated easily over wide dynamic ranges, providing highly specific answers. Having the ability to generate an exact mass measurement routinely provides the capability of determining elemental compositions and in return a high level of confidence in the data produced. The overall result is a UPLC oa-ToF MS system which provides the analyst with a very powerful analytical platform for high throughput screening applications.

Acknowledgement

UCB Pharma, Braine-l’Alleud, Belgium (www.ucbpharma.com) is kindly acknowledged for manufacturing and providing the synthetic medicinal compounds.

720001435, January 2006

Back To Top Back To Top