• Application Note

High Throughput Mass-Directed Purification of Drug Discovery Compounds

High Throughput Mass-Directed Purification of Drug Discovery Compounds

  • Darcy Shave
  • Andrew Brailsford
  • Warren B. Potts
  • Ronan Cleary
  • Paul Lefebvre
  • Cozette Cuppett
  • Waters Corporation

Abstract

In this application note, Waters Purification Factory was used to demonstrate the purification of almost 4000 samples in just 10 days (4 microtitre plates/day).

Introduction

With parallel synthesis laboratories setting production targets in excess of 100,000 compounds per year, it is likely that over 300,000 samples will need to be created annually as a result of high compound attrition rates. These libraries must be screened and purified before use by pharmaceutical companies. To support this activity, it is not unusual for contract labs to have single contracts requiring the purification of 100,000 compounds per year.

The ability to handle the high-productivity demands created by these libraries requires the use of purification systems with ultra-high throughput and low cost per sample. It has been shown that a four channel LC-MS Purification System can reduce the time it takes to process a 16 plate combinatorial library down to 11 days, compared to 26 days for a single channel system.1 To meet this purification challenge, the Waters Purification Factory was used to demonstrate the purification of almost 4000 samples in just 10 days (4 microtitre plates/day). Based on well-established technologies, including the Waters Micromass ZQ Mass Spectrometer, MUX-technology, XTerra Prep Columns and FractionLynx Application Manager, the Purification Factory provides automated mass-directed purification of four samples simultaneously. The multiplexing of sample streams into a single mass spectrometer provides a space- and cost-effective solution for these high throughput laboratories.

Waters Purification Factory.

Experimental

Sample Preparation

A stock solution containing a mixture of three compounds, sulfathiozole, ketoprofen, and tylosin tartrate was made. Each compound had a concentration of 20 mg/mL in DMSO. The injection volume was 500 μL; 30 mg of sample was injected onto each column. Each day, four 96 well microtitre plates of this solution were purified. Tylosin tartrate was the targeted compound.

Sample Purification

Four 96 well microtitre plates of the sample mixture were purified every day for ten days. Four injections of 500 μL were performed, at the same time, one down each channel of the MUX System. With an inject-to-inject cycle time of approximately 11.5 minutes, it took only 18.5 hours to purify all 384 samples. Fractions were collected into 18 x 150 mm test tubes using the “1 for 1” collection mode. These fractions were then dried down on a Genevac R-4 (Genevac Inc, Valley Cottage, NY). Prior to fraction collection, representative subsamples of the tubes (10 per channel per day) were weighed.

Fraction Analysis

A total of 400 dry samples (10 per channel per day) were weighed to determine recovery, and then reconstituted in 1 mL of DMSO and transferred to 96 well microtitre plates. The reconstituted samples were analyzed on an Alliance HT HPLC System with a Quattro micro API Tandem Quadrupole Mass Spectrometer and a 2996 Photodiode Array Detector.

Instrumentation and Conditions

Preparative Instrumentation

Purification was done on a Waters Purification Factory. The system consisted of:

Inlets:

Four Waters 2525 Binary Gradient Modules

Autosampler:

Waters 2777 Sample Manager with 4 Injection Valve Module

Detectors:

Waters Micromass ZQ with MUX-technology

Waters 2488 Multi-channel UV/Vis Detector

Collectors:

Four Waters Fraction Collector IIIs

Flow splitter:

Four LC Packings 1:1000 Splitters

Makeup:

Waters 515 Pump, controlled by a Waters Pump Control Module

Software:

MassLynx v4.0 SP2

Preparative LC Conditions

Column:

Four Waters XTerra Prep MS C18, 5 μm, 19 x 50 mm

Mobile phase A:

(0.1% Formic acid) water

Mobile phase B:

(0.1% Formic acid) acetonitrile

Gradient:

A%=95 B%=5 Time=0 min

A%=95 B%=5 Time=1 min

A%=5 B%=95 Time=8 min

A%=5 B%=95 Time=9 min

A%=95 B%=5 Time=9.1 min

Flow rate:

20 mL/min, split 1:1000

Injection volume:

500 μL (30 mg on column)

Run time:

10 min

Makeup flow on the detector side is 2 mL/min, split four ways. Each analytical flow (0.5 mL/min) is further split so that 0.15 mL/min is flowing into each channel of the MUX interface.

Preparative MS Instrument Settings

Polarity:

ES+

Capillary:

3.00kV

Cone:

20.00V

Cone gas flow:

100 L/Hr

Desolvation gas flow:

600 L/Hr

Source temperature:

120 °C

Desolvation temperature:

400 °C

Scan time:

0.5 sec

Interspray delay:

0.1 sec

Sample Drydown

Samples were dried in a Genevac R-4 Evaporation System. The temperature of both the rotor and the chamber was 35 °C. Using both the Aquaspeed and Dri-Pure functions of the R-4, total drying time for 40 tubes (one day’s run) was 6 hours.

Analytical Instrumentation

Fraction analysis was performed using the same gradient conditions as for the preparative runs. Scale-down was calculated using the Waters Prep Calculator.

System:

Waters Alliance System

Detectors:

Waters Micromass Quattro micro API

Waters 2996 Photodiode Array Detector

Software:

MassLynx v4.0 SP2

Analytical LC Conditions

Column:

Waters XTerra MS C18, 5 μm, 4.6 x 50 mm

Mobile phase A:

(0.1% Formic acid) water

Mobile phase B:

(0.1% Formic acid) acetonitrile

Gradient:

A%=95 B%=5 Time=0 min

A%=95 B%=5 Time=1 min

A%=5 B%=95 Time=8 min

A%=5 B%=95 Time=9 min

A%=95 B%=5 Time=9.1 min

Flow rate:

1.2 mL/min

Injection volume:

100 μL

Run time:

10 min

Analytical MS Instrument Settings

Polarity:

ES+

Capillary:

3.00kV

Cone:

30.00V

Cone gas flow:

50 L/Hr

Desolvation gas flow:

250 L/Hr

Source temperature:

110 °C

Desolvation temperature:

250 °C

Scan time:

0.3 sec

Interspray delay:

0.1 sec

Results and Discussion

The primary objective of this experiment was to increase the throughput of the purification process, while maintaining acceptable sample recovery and purity. To this end, chromatographic conditions were developed to allow for the fastest run time and still meet 85% purity criteria.2,3 In addition, minimal user intervention in the process was required to maximize efficiency.

Using the Waters Purification Factory, it was possible to purify 3940 samples in 10 days. Inject-to-inject cycle times were 11.5 minutes long and the system only ran 18.5 hours a day. If the system were to be run at full capacity, over 500 samples could be purified every day with this gradient length. Intervention was minimized due to the robustness of system operation and ruggedness of the preparative columns.

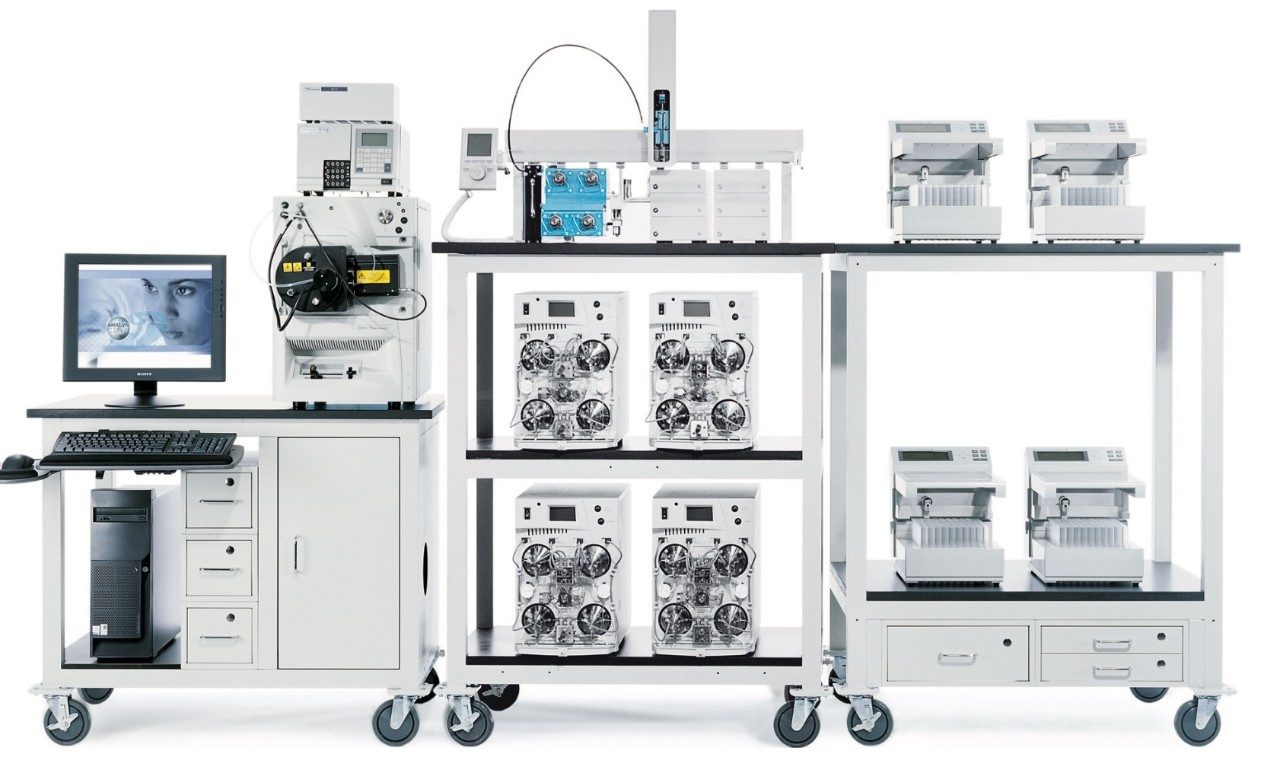
One of the major problem areas of high throughput preparative chromatography is the potential for blockage of either the column or the splitter due to the high concentration of material being injected. Using four 2525 pumps alleviates this issue. If one channel does have a problem, the fractions from the other channels are not affected. In addition, because any pressure changes are not spread over the other channels, blockages are detected earlier by the system and the system can safely shut down. 

Four pumps also have another throughput enhancement. They allow for the possibility to set up different gradients on each channel, increasing the number of different compounds and associated chromatography that can be analyzed. It allows for the running of shallower gradients that focus in on the peak of interest, decreasing gradient run time. By using the AutoPurify feature of FractionLynx, this capability can even be automated.4

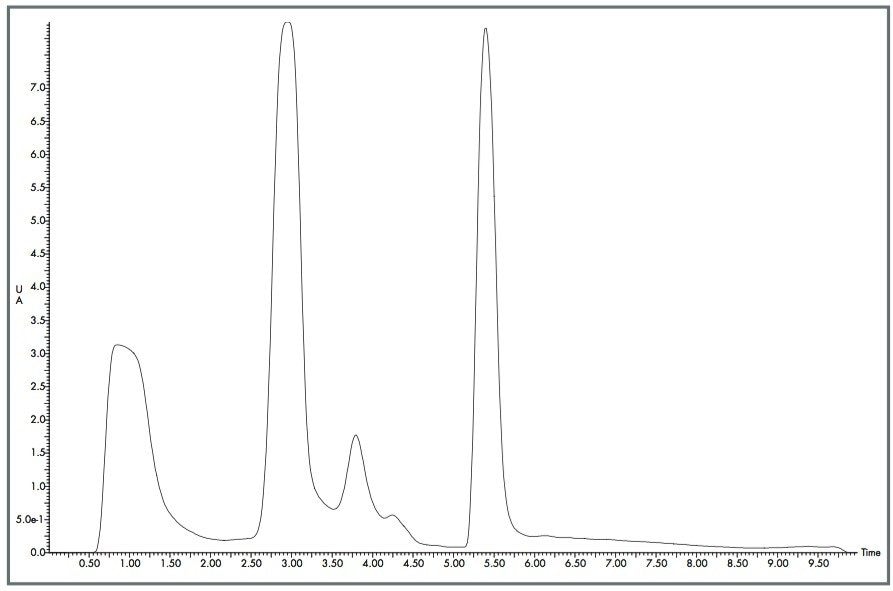
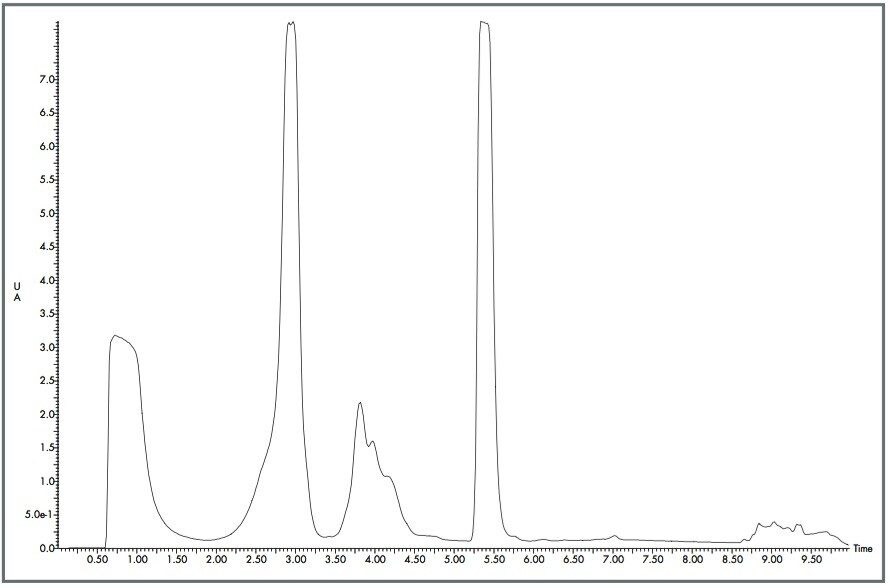
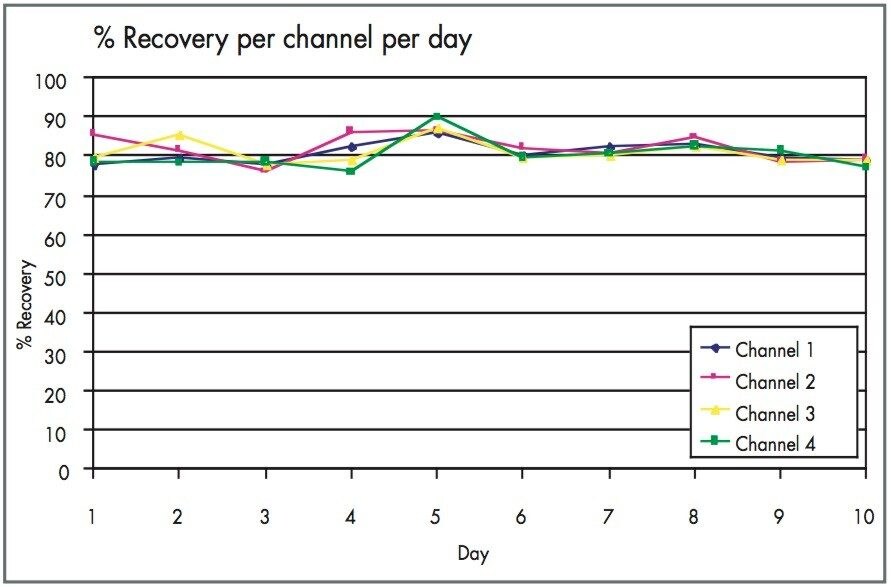
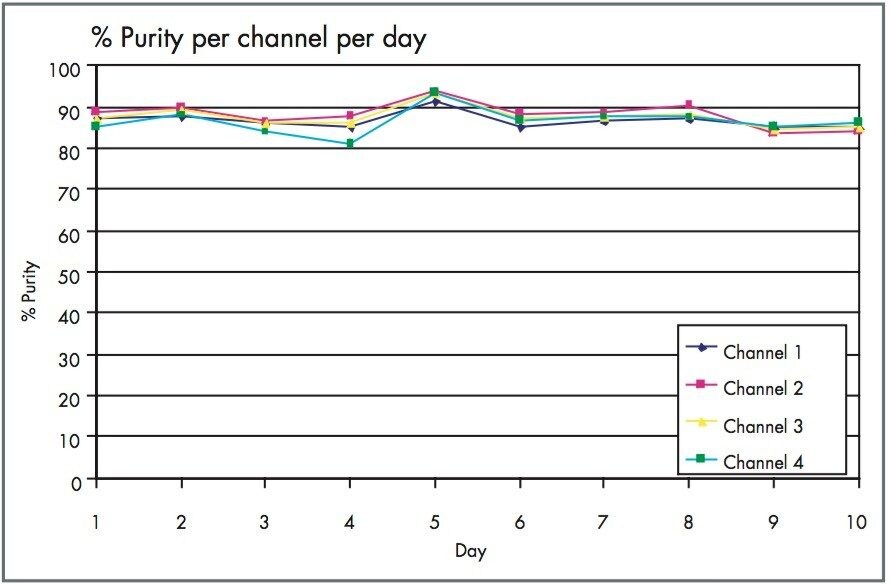
The Optimized Bed Density design of the Waters XTerra Prep Columns allowed 30 mg of material to be loaded onto each column 960 times with little change in peak shape, as shown in Figures 1 and 2. Even with nearly 1000 injections per column, the columns showed acceptable performance and could be used for additional studies.5

Figure 1. A UV chromatogram from Day 1, the 3rd injection onto column 1.
Figure 2. A UV chromatogram from Day 10, the 951st injection onto column 1.

Compound purity was determined using percent peak area of the UV chromatogram. By multiplying total recovery by purity, we were able to determine how much of the target compound was collected. Figure 3 shows the average recovery from the sampled fractions over the entire 10 days. Average recovery of the target compound was 81.1% with a standard deviation of 5.6%. Results were consistent over the length of the experiment.

Figure 3. Average recovery of tylosin tartrate fractions per channel per day.

Figure 4 shows the average purity of the sampled fractions over the 10 days. Average purity was determined to be 87.3% with a standard deviation of 1.2%. Figure 5 shows the overall success of the Purification Factory. Before purification, all the samples were less than 30% pure. After purification, all the samples were over 80% pure and two-thirds were over 85% pure.

Figure 4. Average purity of tylosin tartrate fractions per channel per day.
Figure 5. Purities of representative fractions before and after purification.

As mentioned previously, chromatography was optimized primarily for throughput and secondarily for purity and recovery. Therefore a compromise was made in choosing fraction collection parameters that balanced purity and recovery. Figure 6 shows that the threshold was set such that the tail of the first peak, sulfathiozole, was collected and the tail of the tylosin peak was not. Increasing the peak detection threshold (the value above which peak intensities must be before they will be considered for peak detection) would allow for the collection of purer fractions but at the cost of sample recovery. Lowering the peak detection threshold would allow for the collection of more sample but at the cost of purity. Additionally, a longer run time would have been allowed for the collection of more samples at higher purities, but would have reduced total throughput.

Figure 6. Overlaid extracted ion chromatograms of the three compounds present in mixture.

Fraction collection was triggered based upon mass but could also have been triggered using the UV chromatogram generated by the 2488 Multi-channel UV Detector or a combination of these data sources. Triggering by a combination of MS and UV signals would have also increased the purity of the collected fractions, again at the cost of recovery.

Conclusion

The Purification Factory was designed in response to the high throughput purification demands resulting from the generation of large libraries of compounds using parallel synthesis. Using four LC pumps, the Waters 2525 Binary Gradient Manager, with the MUX ZQ and four Waters Fraction Collectors IIIs, the system was able to collect fractions with an average purity of 87% and an average recovery of 81%. The fraction collection parameters were set such that there was a compromise between recovery and purity. To increase one would have meant decreasing the other.

Throughput was enabled by the use of the Waters ZQ with MUX technology, which allows for four sample streams to be sprayed independently into a single mass spectrometer. Almost a thousand compounds were injected onto each XTerra Column with little to no change in peak shape. MassLynx Software independently tracked each channel, while FractionLynx triggered the collection of fractions accordingly. MassLynx also allowed the independent control of four pumps and four fraction collectors. By combining these technologies, it is possible for only a few chemists to purify 120,000 samples in twelve months.6

References

  1. Isbell, J.; Xu, R.; Cai, Z.; Kassel, D.B., J. Comb. Chem., 2002, 4, 600–611.
  2. Xu, R.; Wang, T.; Isbell, J.;Cai, Z.; Sykes, C.; Brailsford, A.; Kassel, D.B., Anal. Chem., 2002, 74, 3055–3062.
  3. Wenz, W.; Koppitz, M., “An Automated Program for the Analysis, Purification and Characterization of Synethetic Compound Libraries at Schering AG,” presented at the Waters Purification Forum, Paris, France, June 14–16, 2004.
  4. Lefebvre, P. et al. “Compound Purification Workflow Management and Optimization,” presented at the 2003 Pittsburgh Conference, Orlando, Florida, March 9–14, 2003.
  5. Xia, F. et al. “Stability and Reliability: New Approaches in Preparative Column Design,” presented at the 2003 American Association of Pharmaceutical Scientists Annual Meeting and Exposition, Salt Lake City, Utah, Oct. 26–30, 2003.
  6. Isbell J. et al. “Purification of 10,000 Samples per Month using a MUX Purification System,” presented at the 2004 American Society of Mass Spectrometry Conference, Nashville, Tennessee, May 24–27, 2004.

720001011, November 2004

Back To Top Back To Top